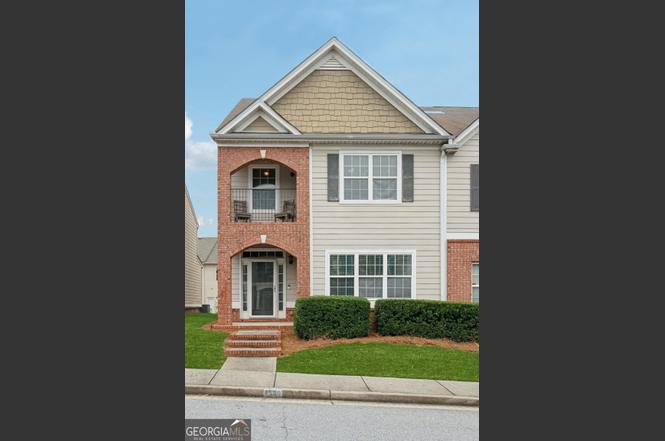
7556 Rutgers Cir · South Fulton, GA
Flood risk 1/10 · Minimal
- FEMA flood zone
- X (unshaded)
- Chance of flooding over 30 yrs
- 0.0%
- Est. flood insurance / yr
- $507 – $1,088
Fire risk 1/10 · Minimal
- Est. fire insurance / yr
- $963 – $1,789
Heat risk 6/10 · Moderate
- Hot days now (above 104°F)
- 8 days/yr
- Hot days in 30 yrs
- 22 days/yr
Wind risk 6/10 · Moderate
- Chance of severe wind over 30 yrs
- 27.0%
Air-quality risk 3/10 · Minor
- Unhealthy air days now
- 4 days/yr
- Unhealthy air days in 30 yrs
- 4 days/yr
Risk factors via First Street. Map © Google.
Why this score? — see what drove the D grade
The composite is a weighted blend of 9 inputs, each scored 0–100. Each bar is that input's sub-score; the figure is the points it added to the 100-point composite (weight × sub-score).
- Cash flow +12.2/30.0
- ARV discount +11.3/15.0
- Schools +4.5/10.0
- DSCR +3.6/10.0
- 1% rule +3.5/10.0
- Rent growth +3.1/5.0
- Livability +2.5/5.0
- Condition / age +2.5/5.0
- Appreciation +0.0/10.0
$274,500
🖨 Deal sheet (PDF) 📄 Offer letter ✓ Due diligence
Listing remarks MLS
Welcome home to this beautiful 3-bedroom, 2.5-bath townhome located in the sought-after Renaissance at South Park community in Fairburn, Georgia. Designed with both comfort and style in mind, this spacious residence features an open and inviting floor plan with a huge living room and separate dining area-perfect for entertaining guests or enjoying everyday living. The well-appointed kitchen showcases elegant granite countertops, ample cabinet space, and a layout that seamlessly connects to the main living areas. Upstairs, you'll find generously sized bedrooms, including an impressive primary suite complete with a private sitting area and exclusive balcony access, creating the perfect retreat for relaxation. Additional highlights include cozy carpeted bedrooms and living spaces, a convenient two-car garage, and low-maintenance townhome living in a prime location. With easy access to shopping, dining, major highways, and Hartsfield-Jackson Atlanta International Airport, this home offers the perfect blend of convenience and comfort.
Key facts
- $175 HOA
- 2 garage spots
- Pool
Property features AI
Finance
- Other: Single-unit community
- HOA & community: HOA with a $175 monthly association fee
Exterior
- Parking: Garage (2 spaces)
- Utilities: Public water; Public sewer; 220 Volt electrical service
- Home design: Two levels; Aluminum siding; Composition roof
- Construction: Aluminum siding construction; Composition roof
- Exterior features: Deck; In-ground pool; Resale condition; Fee simple ownership
Interior
- Kitchen: Dishwasher
- Bedrooms: Three bedrooms on the upper level
- Flooring: Laminate flooring; Luxury vinyl flooring
- Bathrooms: Two full bathrooms; One half bathroom (main level)
- Heating & cooling: Central heating; Central air; Ceiling fans
- Interior features: Decorative fireplace; Built-in bookcases; Double-pane windows; No shared/common walls; Attic
Neighborhood map
What this means for you Summary
Snapshot
- This is a 3-bed/2.5-bath townhouse listed at $274k.
Deal economics
- At list price, monthly cash flow is $-54 ($-648/yr) — negative.
- To cash-flow at today's rent, offer at most $265k (3.5% below list).
- To meet the 1% rule (rent ≥ 1% of price), the offer needs to be $232k (15.4% below list).
- Recommended offer: $232k (15.4% below list) — sets the bar for 1% rule.
- Cap rate 6.1% vs local median 4.6% in South Fulton — top-decile yield for the area; either an underpriced asset or a hidden risk that comps aren't pricing in. Stress-test before assuming the spread holds.
Location & tenants
- Location reads: area grade D — affects rentability + tenant quality, not the cash-flow math above.
- Fulton County (suburban): math 49% / reading 53% proficiency, ranked #12 of 174 in GA (top 7%) — acceptable for families but not a draw, mixed tenant base, ~2y average lease.
- Zoned schools: Oakley Elementary School (math 22% / reading 22%, grade F, #810 of 1,228 statewide, top 69%, 712 students, 100% FRL); Bear Creek Middle School (math 17% / reading 26%, grade F, #339 of 470 statewide, top 72%, 1,108 students, 100% FRL); Creekside High School (math 30% / reading 24%, grade F, #160 of 424 statewide, top 38%, 1,768 students, 100% FRL) — zoned schools average 100% FRL vs 41% district-wide (59 pts higher); higher-poverty schools than district average — tighter screening recommended.
- Zoned-school proficiency averages 24% at this address vs 51% district-wide (-27 pts) — the specific schools serving this property underperform the Fulton County average; the district grade overstates school quality for this exact location.
- Market conditions: Rents rising (+2.5%/yr); 546 active listings in the ZIP; 25 comparable units currently listed for rent nearby; rentals leasing fast (median 6d on market — plan ~1-2 weeks tenant-placement turnaround); solid renter incomes; 11,565 units permitted in Fulton County in 2024 (8,159 in 5+ unit buildings).
Forward outlook
- Local home prices are declining (-3.0%/yr); year-one equity from $2k of loan paydown is wiped out by about $8k of value loss. Plan a longer hold.
- Fulton County population projected at +38% by 2050 — long-run rental-demand tailwind backs the buy-and-hold thesis.
Negotiation context
- Only 7 days on market — expect competitive offers; lowballing is unlikely to land.
- 20 sale attempts since 9y ago with the ask held roughly flat each time — persistent listings suggest the price (not the market) is what's stuck; bring a comps-based counter.
Risks & watch-outs
- Climate carrying-cost: major wind risk, 27% chance of damaging wind over 30y; extreme-heat days projected 8→22/yr by 2055 (HVAC capex compounding) — expect insurance premiums to compound above CPI over the hold.
Questions for the listing agent
- What do current leases actually rent for vs. the listed asking? Can we see a recent rent roll and the last 12 months of T-12 income?
- What does the HOA fee cover, when was the last increase, and are there any pending special assessments or reserve-fund shortfalls?
- Is there a deadline driving the sale (1031 exchange, divorce, estate, relocation)? That informs how much negotiation room exists.
- The area grade is low — what's the realistic commute time and amenity access for the typical tenant pool here? Any planned neighborhood developments (good or bad) we should know about?
- What's the average days-on-market for RENTAL listings here right now (not sales)? A rising rental-DOM trend means longer vacancies and softer asking-rent achievability than the comps imply.
- What's the recent tenant-quality profile in this submarket — average credit score on applications, eviction rate, late-payment / NSF rate, and stable-employment percentage? A property-management company in the area should have these aggregated.
- How much new for-sale + rental construction is in the pipeline within 1–3 miles? Heavy new supply typically softens prices + rents 12–24 months out; constrained supply supports both.
Investment metrics
- 1% rule
- 0.85% ✗
- Cap rate
- 6.06%
- Cash-on-cash
- -0.84%
- DSCR
- 0.96
- GRM
- 9.8
CMA / ARV
- ARV (on-the-fly)
- $299,752
- Comps found
- 9
Show comp detail 9 sales within ~0.75 mi
| Address | Dist | Beds/Ba | Sqft | Sold | Price | $/sf | Match |
|---|---|---|---|---|---|---|---|
| 5529 Festival Ave | 0.08mi | 3/3.5 | 1,630 (-3%) | 11mo | $235,000 | $144 | 78 |
| 7818 Marie Way | 0.36mi | 3/2.5 | 1,640 (-3%) | 2mo | $299,990 | $183 | 77 |
| 5528 Cosimo Rd | 0.36mi | 3/2.5 | 1,640 (-3%) | 5mo | $299,990 | $183 | 74 |
| 5524 Cosimo Rd | 0.37mi | 3/2.5 | 1,640 (-3%) | 8mo | $324,990 | $198 | 72 |
| 7750 Carnegie Dr | 0.14mi | 3/2.5 | 1,536 (-9%) | 10mo | $279,900 | $182 | 70 |
| 5317 Radford Loop | 0.30mi | 3/2.5 | 1,911 (+14%) | 6mo | $280,000 | $147 | 59 |
| 7673 Squire Ct | 0.26mi | 3/2.5 | 1,911 (+14%) | 8mo | $325,000 | $170 | 59 |
| 7676 Viking Rd | 0.23mi | 3/2.5 | 1,911 (+14%) | 13mo | $332,000 | $174 | 56 |
| 7771 Lance Rd | 0.36mi | 3/2.5 | 1,911 (+14%) | 16mo | $340,000 | $178 | 47 |
Match score weights: distance 35% · size 25% · config 20% · recency 20%. Top-matched comps best support the ARV.
Projected returns pro-forma
-3.0% appreciation · 2.53% rent growth · sell at horizon
- IRR
- -18.2%
- Equity multiple
- 0.36×
- Total profit
- $-48,982
- Equity at exit
- $40,929
- IRR
- -11.4%
- Equity multiple
- 0.33×
- Total profit
- $-51,402
- Equity at exit
- $23,734
Cash invested: $76,860 (down + closing). Projections, not guarantees.
Landlord ↔ Tenant lean methodology
- Overall (STATE)
- 90 Strongly Landlord-Friendly
- State Georgia
- 90 Strongly Landlord-Friendly · R+3
- County
- — inherits STATE
- City
- — inherits STATE
ZIP-level market 30213
- Home prices YoY
- -17.7%
- Rents YoY
- 2.5%
- Active inventory
- 546
- Price-to-rent
- 9.8×
Monthly cashflow live
- Estimated rent
- $2,323 high interval (Pro) →
- Mortgage (P&I)
- −$1,440
- Tax from tax record
- −$160 /mo · $1,921/yr
- Insurance
- −$114
- HOA
- −$175
- Vacancy / Maint / Mgmt
- −$488
- Net cashflow
- $-54
Break-even live
Sensitivity live
| Price | -10% $101 | -5% $24 | +0% $-54 | +5% $-132 | +10% $-209 |
|---|---|---|---|---|---|
| Rent | -10% $-237 | -5% $-146 | +0% $-54 | +5% $38 | +10% $130 |
| Rate | -1.0pp $84 | -0.5pp $16 | base $-54 | +0.5pp $-125 | +1.0pp $-197 |
UW: 25.0% down · 7.5% · 30yr · 1.5% tax · 5.0% vac · 8.0% maint · 8.0% mgmt
Financing live
Cash to close
- Down payment
- $68,625
- Closing costs
- $8,235
- Reserves months
- —
- Total cash needed
- —
Loan-product check · same deal, 3 products live
Conventional
25% down · 7.5% · 30yr
- Down + closing
- —
- Monthly P&I
- —
- Monthly cashflow
- —
- DSCR
- —
- Eligible?
- —
Personal DTI + credit; lowest rate.
DSCR
20% down · 8.5% · 30yr
- Down + closing
- —
- Monthly P&I
- —
- Monthly cashflow
- —
- DSCR
- —
- Eligible?
- —
No personal income docs; deal must DSCR.
Hard money
10% down · 12.0% · 12mo
- Down + closing
- —
- Monthly P&I
- —
- Monthly cashflow
- —
- DSCR
- —
- Eligible?
- —
Short-term bridge; refi at stabilization.
Rent comps 25 comps
| Address | Beds | Baths | Sqft | Rent | $/sqft | DOM | Units | Dist |
|---|---|---|---|---|---|---|---|---|
| 5472 Festival Ave Fairburn, GA | 3.0 | 2.5 | 1640 | $2,100 | $1.28 | 7d | 1 | 0.05mi |
| 5472 Festival Ave Fairburn, GA | 3.0 | 2.5 | 1640 | $2,100 | $1.28 | 14d | 1 | 0.05mi |
| 330 Avalon Sq Fairburn, GA | 3.0 | 2.5 | 2047 | $2,950 | $1.44 | 26d | 1 | 0.06mi |
| 7599 Avalon Blvd Fairburn, GA | 3.0 | 2.5 | 1648 | $2,039 | $1.24 | 4d | 1 | 0.08mi |
| 7744 Rutgers Cir Fairburn, GA | 3.0 | 2.5 | 1936 | $2,350 | $1.21 | 0d | 1 | 0.13mi |
| 7744 Rutgers Cir Fairburn, GA | 3.0 | 2.5 | 1936 | $2,350 | $1.21 | 4d | 1 | 0.13mi |
| 7740 Baron Rd Fairburn, GA | 3.0 | 2.5 | 1911 | $2,650 | $1.39 | 14d | 1 | 0.27mi |
| 7784 Baron Rd Fairburn, GA | 3.0 | 2.5 | 1911 | $2,460 | $1.29 | 45d | 1 | 0.27mi |
| 7823 Canterbury Ct Fairburn, GA | 3.0 | 2.5 | 2136 | $2,200 | $1.03 | 26d | 1 | 0.30mi |
| 5617 Oakley Industrial Blvd Fairburn, GA | 1.0–3.0 | 1.0–2.5 | 1558 | $4,431 | $2.84 | 0d | 50 | 0.37mi |
| 5500 Oakley Industrial Blvd Fairburn, GA | 1.0–3.0 | 1.0–2.0 | 1057 | $1,835 | $1.74 | 0d | 14 | 0.39mi |
| 111 Jaclyn Way Fairburn, GA | 4.0 | 2.5 | 1681 | $2,245 | $1.34 | 45d | 1 | 0.57mi |
| 5474 Oakley Industrial Blvd Fairburn, GA | 1.0–3.0 | 1.0–2.0 | 1001 | $1,893 | $1.89 | 0d | 14 | 0.59mi |
| 3076 Broadleaf Trl Fairburn, GA | 3.0 | 2.5 | 1373 | $1,855 | $1.35 | 3d | 1 | 0.62mi |
| 214 Ben Ln Fairburn, GA | 3.0 | 2.5 | 1860 | $2,035 | $1.09 | 3d | 1 | 0.63mi |
| 2155 Shortleaf Rd Fairburn, GA | 3.0 | 2.5 | 1784 | $2,130 | $1.19 | 7d | 1 | 0.65mi |
| 6010 Renaissance Pkwy Fairburn, GA | 1.0–2.0 | 1.0–2.0 | 930 | $2,254 | $2.42 | 0d | 11 | 0.71mi |
| 7000 Renaissance Pkwy Fairburn, GA | 1.0–3.0 | 1.0–2.0 | 1048 | $2,963 | $2.83 | 0d | 12 | 0.77mi |
| 7915 Senoia Rd Fairburn, GA | 1.0–3.0 | 1.0–2.0 | 1029 | $1,950 | $1.89 | 0d | 16 | 0.87mi |
| 154 Fairhaven Trl Fairburn, GA | 3.0 | 2.0 | 1576 | $2,190 | $1.39 | 3d | 1 | 0.91mi |
| 3020 Meadow Glen Pass Fairburn, GA | 3.0 | 2.0 | 1386 | $2,400 | $1.73 | 5d | 1 | 1.17mi |
| 700 Parkway Rd Union City, GA | 3.0 | 2.5 | 1770 | $1,795 | $1.01 | 21d | 1 | 1.34mi |
| 1065 Maple Valley Ct Union City, GA | 3.0 | 2.5 | 1456 | $1,600 | $1.10 | 45d | 1 | 1.36mi |
| 460 Parkway Rd Unit 460 Union City, GA | 3.0 | 2.5 | 1678 | $1,750 | $1.04 | 26d | 1 | 1.47mi |
| 100 Spring Ct Fairburn, GA | 2.0 | 1.0 | 1900 | $1,075 | $0.57 | 26d | 1 | 1.47mi |
HOA detail
- Monthly dues
- $175 · $2,100/yr
Listing history 6 events
-
2026-06-21days on market $274,500 Active 7 DOM
-
2026-06-18days on market $274,500 Active 4 DOM
-
2026-06-17days on market $274,500 Active 3 DOM
-
2026-06-16days on market $274,500 Active 2 DOM
-
2026-06-15remarks 699-char remark
-
2026-06-15$274,500 Active 1 DOM
ⓘ Source: listings_history table (triggers on properties + properties_extension) + one-shot
backfill from property_details.listing_events for pre-trigger history.
Tax reassessment forecast GA · Resets to sale price
- Current annual tax
- $1,921 · $160/mo
- Projected year-2 tax
- $2,525 · $210/mo
- Expected delta
- +$604/yr (+$50/mo · 31.4%)
ⓘ Screening estimate from a state-policy table — verify with the county assessor before closing.
Climate risk First Street
- Flood 1/10 Low FEMA zone X (unshaded) · 0% chance over 30 yrs
- Wildfire 1/10 Low
- Heat 6/10 Major 8 d/yr ≥104°F today · 22 d/yr by 30 yrs out
- Wind 6/10 Major 27% chance of damaging wind over 30 yrs
- Air quality 3/10 Moderate 4 unhealthy d/yr today · 4 by 30 yrs out
Nearby sold comps map
Loading sold comps map…
Walkable amenities ~0.75 mi
Loading nearby amenities…
Taxation est. · year 1
- Rental income
- $27,874
- − Mortgage interest
- −$15,376
- − Property taxes
- −$1,921
- − Insurance
- −$1,372
- − Repairs & maintenance
- −$2,230
- − Management
- −$2,230
- − HOA
- −$2,100
- − Depreciation
- −$7,985
- Taxable loss
- −$5,342
- Est. tax savings @ 24.0%
- +$1,282
- After-tax cash flow
- $634/yr
For passive investors: Depreciation is non-cash, so a rental often shows a tax loss while cash-flowing — sheltering income. Rental losses are passive: they offset passive income freely, and up to $25,000/yr can offset ordinary (W-2) income if you actively participate and your MAGI is under $100k (phasing out to $0 by $150k); unused losses carry forward. On sale, claimed depreciation is recaptured at up to 25%, and gains may owe capital-gains tax (a 1031 exchange can defer both). Figures are a year-1 estimate at your 24.0% rate — not tax advice; consult a CPA.
Schools (NCES district)
- District
- Fulton County
- NCES district ID
- 1302280
- Math proficiency
- 49% ▼ -2.00%
- Reading proficiency
- 53% ▬ 0.00%
- Median HH income
- $68,035
- Composite
- 45.33/100
- National rank
- #2640
- State rank
- #12 of 174 in GA
Livability — South Fulton
No livability data for this city. (Only ~50 U.S. cities are tracked.)
Census & demographics
- Census place
- South Fulton, GA
- County
- Fulton County · 1,094,430 people
- City population
- 127,674
- Metro
- Atlanta-Sandy Springs-Alpharetta, GA
- Population (ZIP)
- 50,621
- Household income
- $94,125
- Rent vs Own
- Severe rent burden
- 1025.0
Population outlook (Fulton County) Hauer SSP2
- Today (2025)
- 1,203,707 people
- By 2030
- 1,299,706 · +8.0%
- By 2040
- 1,488,256 · +23.6%
- By 2050
- 1,664,580 · +38.3%
- By 2075
- 2,036,072 · +69.2%
- By 2100
- 2,222,402 · +84.6%
Race, ethnicity, and origin ACS 2023
- Neighborhood character
- Predominantly Black (86%)
- Race & ethnicity
- Black 86% White 8% Hispanic / Latino 4% Two or more races 3%
- Common ancestry
- Hispanic 1% Arab 1% Lithuanian 0%
- Foreign-born
- 7% · Canada
- Languages at home
- 91% English-only · Spanish 4% French/Haitian/Cajun 2% Arabic 1%
Political lean MEDSL · Fulton
- 2024 margin
- Solid D (+44.9) · D 71.9% · R 27.0% · Other 1.1%
- 2008→2024 swing
- +9.8pp toward D · 2008: 35.0pp · 2024: 44.9pp
- All cycles
- 2024: D+44.9 2020: D+46.4 2016: D+42.1 2012: D+29.6 2008: D+35.0
Not yet ingested
- Civics
- —
Market trends
- HPI YoY
- ▼ -50.66%
- Current HPI
- 235.9372
- Rent YoY
- ▲ 2.53%
- Metro
- Atlanta-Sandy Springs-Alpharetta, GA
- State GDP YoY
- ▲ 2.66%
- F500 in state
- 28
Industry mix (Fortune 500 HQ in GA)
| Industry | F500 HQs | Revenue |
|---|---|---|
| Paper / Packaging | 2 | $29B |
|
||
| Retail | 1 | $160B |
|
||
| Transportation / Logistics | 1 | $91B |
|
||
| Airlines | 1 | $62B |
|
||
| Consumer Goods | 1 | $47B |
|
||
| Utilities | 1 | $25B |
|
||
Price history
+189.3% since first listed69 events — show timeline
- 2026-06-14 Listed $274,500 GAMLS
- 2026-06-14 Listed $274,500 FMLS
- 2023-07-07 Sold (Public Records) $280,000 Public Records
- 2023-07-05 Sold (MLS) $280,000 GAMLS
- 2023-07-05 Sold (MLS) $280,000 FMLS
- 2023-06-17 Pending — FMLS
- 2023-06-13 Contingent — FMLS
- 2023-06-13 Pending — GAMLS
- 2023-06-01 Relisted — FMLS
- 2023-06-01 Relisted — GAMLS
- 2023-05-06 Pending — FMLS
- 2023-05-03 Contingent — GAMLS
- 2023-05-03 Contingent — FMLS
- 2023-04-19 Relisted — GAMLS
- 2023-04-19 Relisted — FMLS
- 2023-04-18 Pending — FMLS
- 2023-04-11 Contingent — GAMLS
- 2023-04-11 Contingent — FMLS
- 2023-04-06 Price Changed $291,000 GAMLS
- 2023-04-06 Price Changed $291,000 FMLS
- 2023-03-09 Price Changed $295,000 GAMLS
- 2023-03-09 Price Changed $295,000 FMLS
- 2023-01-23 Listed $300,000 GAMLS
- 2023-01-23 Listed $300,000 FMLS
- 2023-01-16 Sold (Public Records) $245,100 Public Records
- 2019-12-17 Sold (Public Records) $157,000 Public Records
- 2019-12-13 Sold (MLS) $157,000 GAMLS
- 2019-12-13 Sold (MLS) $157,000 FMLS
- 2019-11-06 Pending — GAMLS
- 2019-11-06 Pending — FMLS
- 2019-11-01 Price Changed $160,000 GAMLS
- 2019-10-31 Price Changed $160,000 FMLS
- 2019-10-11 Price Changed $165,000 GAMLS
- 2019-10-10 Price Changed $165,000 FMLS
- 2019-10-01 Relisted — GAMLS
- 2019-10-01 Relisted — FMLS
- 2019-09-10 Pending — GAMLS
- 2019-09-10 Pending — FMLS
- 2019-08-30 Price Changed $170,000 GAMLS
- 2019-08-29 Price Changed $170,000 FMLS
- 2019-08-09 Price Changed $175,000 GAMLS
- 2019-08-08 Price Changed $175,000 FMLS
- 2019-07-20 Listed $177,000 GAMLS
- 2019-07-20 Listed $177,000 FMLS
- 2019-07-18 Sold (Public Records) $150,400 Public Records
- 2018-03-16 Listing Removed — FMLS
- 2018-03-07 Listing Removed — GAMLS
- 2018-03-02 Pending — FMLS
- 2018-03-01 Relisted — GAMLS
- 2018-02-21 Pending — GAMLS
- 2018-02-21 Contingent — FMLS
- 2018-01-29 Relisted — GAMLS
- 2018-01-29 Relisted — FMLS
- 2018-01-11 Pending — GAMLS
- 2018-01-11 Pending — FMLS
- 2017-12-05 Listed $149,500 GAMLS
- 2017-12-05 Listed $149,500 FMLS
- 2017-07-21 Sold (Public Records) $94,900 Public Records
- 2017-07-20 Sold (MLS) $94,900 GAMLS
- 2017-07-20 Sold (MLS) $94,900 FMLS
- 2017-07-18 Contingent — FMLS
- 2017-07-15 Pending — GAMLS
- 2017-07-14 Relisted — FMLS
- 2017-06-28 Price Changed $96,000 FMLS
- 2017-04-13 Pending — FMLS
- 2017-04-13 Listed $94,900 FMLS
- 2017-03-15 Pending — GAMLS
- 2017-03-13 Price Changed $96,000 GAMLS
- 2017-03-03 Listed $94,900 GAMLS
Property tax history
+0.3%/yrLatest (2025): $1,921 · +2.3% YoY. Source: county tax records.
Cash-flow waterfall
monthlySold comps — $/sqft
last 12 mo · ≤1 miLoading sold comps…