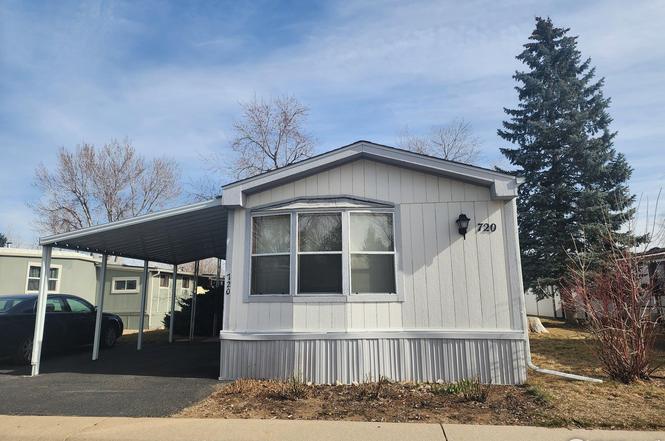
720 Flamingo Dr · Lafayette, CO
Flood risk 6/10 · Moderate
- FEMA flood zone
- X (unshaded)
- Chance of flooding over 30 yrs
- 0.7%
- Est. flood insurance / yr
- $507 – $1,088
Fire risk 5/10 · Moderate
- Est. fire insurance / yr
- $939 – $1,743
Heat risk 3/10 · Minor
- Hot days now (above 93°F)
- 7 days/yr
- Hot days in 30 yrs
- 18 days/yr
Wind risk 1/10 · Minimal
- Chance of severe wind over 30 yrs
- —
Air-quality risk 3/10 · Minor
- Unhealthy air days now
- 3 days/yr
- Unhealthy air days in 30 yrs
- 4 days/yr
Risk factors via First Street. Map © Google.
Why this score? — see what drove the B+ grade
The composite is a weighted blend of 9 inputs, each scored 0–100. Each bar is that input's sub-score; the figure is the points it added to the 100-point composite (weight × sub-score).
- Cash flow +30.0/30.0
- ARV discount +12.3/15.0
- 1% rule +10.0/10.0
- DSCR +10.0/10.0
- Schools +5.1/10.0
- Livability +4.2/5.0
- Rent growth +2.9/5.0
- Condition / age +2.5/5.0
- Appreciation +0.0/10.0
$75,000
🖨 Deal sheet 📄 Offer letter ✓ Due diligence
Listing remarks
Lot Rent is $1264/mo. Rare find! This spacious home offers generously sized rooms throughout, giving everyone plenty of space to relax and enjoy. The eat-in kitchen provides a welcoming spot for everyday meals and gatherings. Bedrooms are thoughtfully positioned at the front and rear of the home for added privacy. The primary suite features a luxurious five-piece bathroom complete with a double-sink vanity and a walk-in shower. Enjoy the convenience of off-street parking and a great location.
Key facts
- Double-sink vanity
- Great location
- Five-piece bathroom
Tags
Property features AI
Exterior
- Parking: Carport
- Utilities: City water (meter installed); Public sewer; Natural gas available
- Home design: Manufactured in park (mobile home); Model: Friendship
- Construction: Composition exterior; Fiberglass roof
- Exterior features: Patio; Land lease; Storage structure; House faces north; Paved street with street lights; Fire hydrant within 500 feet; Private road up to county standards
Interior
- Kitchen: Gas range; Dishwasher; Refrigerator
- Bedrooms: 3 bedrooms
- Bathrooms: 2 full bathrooms
- Interior features: Eat-in kitchen; Window coverings; Stall shower
- Laundry & utility: Washer; Dryer
Neighborhood map
What this means for you Summary
Snapshot
- This is a 3-bed/2.0-bath manufactured listed at $75k.
Deal economics
- At list price, monthly cash flow is $1k ($16k/yr) — positive.
- The deal already cash-flows at list — no discount required.
- Meets the 1% rule at list price ($2k rent vs $75k).
- Recommended offer: $68k (9.0% below list) — sets the bar for market timing.
- Cap rate 28.1% vs local median 2.6% in Lafayette — top-decile yield for the area; either an underpriced asset or a hidden risk that comps aren't pricing in. Stress-test before assuming the spread holds.
Location & tenants
- Location reads 85/100 on livability (#1 in CO, #566 nationally) — a professional / high-income tenant draw. Strengths: amenities A+, commute A+, employment A+; Watch: crime C-, cost of living F.
- Boulder Valley School District No. Re2 (urban): math 49% / reading 67% proficiency, ranked #6 of 86 in CO (top 7%) — acceptable for families but not a draw, mixed tenant base, ~2y average lease; only 16% free/reduced lunch — higher-income household profile.
- Market conditions: Rents rising (+1.6%/yr); 200 active listings in the ZIP; 12 comparable units currently listed for rent nearby; rentals leasing fast (median 14d on market — plan ~1-2 weeks tenant-placement turnaround); high-income renter base; 1,688 units permitted in Boulder County in 2024 (1,136 in 5+ unit buildings).
Forward outlook
- Local home prices are declining (-3.0%/yr); year-one equity from $519 of loan paydown is wiped out by about $2k of value loss. Plan a longer hold.
- Boulder County population projected at +40% by 2050 — long-run rental-demand tailwind backs the buy-and-hold thesis.
- At projected returns (-3.0% appreciation + 1.6% rent growth), your $21k cash investment doubles in ~2 years — after that, you're playing with house money.
Negotiation context
- It's been on market 111 days — a 9% lower offer ($68k) is reasonable based on typical stale-listing flexibility.
- 3 sale attempts; this cycle's ask has dropped $24k (24%) from the opening price — seller is motivated, your offer sets the floor, not the list.
Risks & watch-outs
- Climate carrying-cost: major flood risk; moderate wildfire risk — expect insurance premiums to compound above CPI over the hold.
Questions for the listing agent
- It's been on market 111 days. Have you received any prior offers? Is the seller open to a 9% concession, seller financing, or rate buy-down credit?
- Why hasn't it sold? Are there any deal-killer items the seller is aware of (foundation, flood, title, zoning, code violations)?
- Is there a deadline driving the sale (1031 exchange, divorce, estate, relocation)? That informs how much negotiation room exists.
- Schools are B-rated — typically a magnet for longer-tenancy family renters. What's the average tenant stay here, and is there a school-zone premium baked into asking?
- What's the average days-on-market for RENTAL listings here right now (not sales)? A rising rental-DOM trend means longer vacancies and softer asking-rent achievability than the comps imply.
- What's the recent tenant-quality profile in this submarket — average credit score on applications, eviction rate, late-payment / NSF rate, and stable-employment percentage? A property-management company in the area should have these aggregated.
- How much new for-sale + rental construction is in the pipeline within 1–3 miles? Heavy new supply typically softens prices + rents 12–24 months out; constrained supply supports both.
Investment metrics
- 1% rule
- 3.17% ✓
- Cap rate
- 28.07%
- Cash-on-cash
- 77.78%
- DSCR
- 4.46
- GRM
- 2.6
CMA / ARV
- ARV (on-the-fly)
- $83,904
- Comps found
- 12
Show comp detail 12 sales within ~0.75 mi
| Address | Dist | Beds/Ba | Sqft | Sold | Price | $/sf | Match |
|---|---|---|---|---|---|---|---|
| 719 Merlin Dr #719 | 0.14mi | 2/2.0 (-1) | 1,216 (0%) | 6mo | $50,000 | $41 | 84 |
| 702 Dove Dr | 0.09mi | 3/2.0 | 1,248 (+3%) | 13mo | $114,000 | $91 | 80 |
| 708 Dove Dr | 0.07mi | 3/2.0 | 1,152 (-5%) | 13mo | $72,000 | $63 | 77 |
| 713 Flamingo Dr | 0.04mi | 2/1.0 (-1) | 1,152 (-5%) | 5mo | $60,000 | $52 | 76 |
| 11700 E South Boulder Rd | 0.57mi | 3/2.0 | 1,216 (0%) | 1mo | $83,800 | $69 | 72 |
| 11700 E South Boulder Rd #332 | 0.57mi | 3/2.0 | 1,216 (0%) | 1mo | $83,800 | $69 | 72 |
| 710 E Cleveland St | 0.38mi | 3/2.0 | 1,280 (+5%) | 6mo | $192,000 | $150 | 69 |
| 724 Quail Dr | 0.12mi | 2/2.0 (-1) | 1,120 (-8%) | 13mo | $75,322 | $67 | 66 |
| 715 Bunting Dr | 0.15mi | 3/2.0 | 1,056 (-13%) | 7mo | $55,000 | $52 | 65 |
| 726 E Cleveland St | 0.41mi | 3/2.0 | 1,088 (-10%) | 1mo | $182,000 | $167 | 63 |
| 803 Oriole Cv | 0.10mi | 2/1.0 (-1) | 1,056 (-13%) | 14mo | $75,000 | $71 | 53 |
| 11990 E South Boulder Lot 221 Rd | 0.47mi | 3/2.0 | 1,036 (-15%) | 15mo | $75,000 | $72 | 41 |
Match score weights: distance 35% · size 25% · config 20% · recency 20%. Top-matched comps best support the ARV.
Projected returns pro-forma
-3.0% appreciation · 1.56% rent growth · sell at horizon
- IRR
- 76.2%
- Equity multiple
- 4.39×
- Total profit
- $71,174
- Equity at exit
- $11,183
- IRR
- 79.5%
- Equity multiple
- 8.63×
- Total profit
- $160,203
- Equity at exit
- $6,485
Cash invested: $21,000 (down + closing). Projections, not guarantees.
Landlord ↔ Tenant lean methodology
- Overall (STATE)
- 38 Tenant-Leaning
- State Colorado
- 38 Tenant-Leaning · D+4
- County
- — inherits STATE
- City
- — inherits STATE
ZIP-level market 80026
- Rents YoY
- 1.6%
- Active inventory
- 200
- Price-to-rent
- 2.6×
Monthly cashflow live
- Estimated rent
- $2,379 high interval (Pro) →
- Mortgage (P&I)
- −$393
- Tax est. 1.5%
- −$94 /mo · $1,125/yr
- Insurance
- −$31
- HOA
- −$0
- Vacancy / Maint / Mgmt
- −$500
- Net cashflow
- $1,361
Break-even live
UW: 25.0% down · 7.5% · 30yr · 1.5% tax · 5.0% vac · 8.0% maint · 8.0% mgmt
Financing live
Cash to close
- Down payment
- $18,750
- Closing costs
- $2,250
- Reserves months
- —
- Total cash needed
- —
Loan-product check · same deal, 3 products live
Conventional
25% down · 7.5% · 30yr
- Down + closing
- —
- Monthly P&I
- —
- Monthly cashflow
- —
- DSCR
- —
- Eligible?
- —
Personal DTI + credit; lowest rate.
DSCR
20% down · 8.5% · 30yr
- Down + closing
- —
- Monthly P&I
- —
- Monthly cashflow
- —
- DSCR
- —
- Eligible?
- —
No personal income docs; deal must DSCR.
Hard money
10% down · 12.0% · 12mo
- Down + closing
- —
- Monthly P&I
- —
- Monthly cashflow
- —
- DSCR
- —
- Eligible?
- —
Short-term bridge; refi at stabilization.
Rent comps 12 comps
| Address | Beds | Baths | Sqft | Rent | $/sqft | DOM | Units | Dist |
|---|---|---|---|---|---|---|---|---|
| 718 Dove Dr Lafayette, CO | 2.0 | 2.0 | 975 | $2,204 | $2.26 | 21d | 1 | 0.05mi |
| 404 S Foote Ave Unit A Lafayette, CO | 2.0 | 1.0 | 950 | $1,325 | $1.39 | 21d | 1 | 0.23mi |
| 204 E Emma St Lafayette, CO | 3.0 | 2.0 | 1400 | $2,625 | $1.88 | 13d | 1 | 0.27mi |
| 440 Strathmore Ln Lafayette, CO | 1.0–2.0 | 1.0–2.0 | 906 | $2,405 | $2.65 | 13d | 15 | 0.28mi |
| 601 Merlin Dr Lafayette, CO | 2.0–3.0 | 1.0–2.0 | 973 | $2,355 | $2.42 | 13d | 9 | 0.31mi |
| 235 S Boulder Rd Lafayette, CO | 3.0 | 1.0–3.5 | 1320 | $3,428 | $2.60 | 13d | 1 | 0.41mi |
| 772 W Cleveland Cir Lafayette, CO | 2.0 | 2.0 | 1290 | $2,100 | $1.63 | 21d | 1 | 0.89mi |
| 695 S Lafayette Dr Lafayette, CO | 1.0–2.0 | 1.0–2.0 | 900 | $2,473 | $2.75 | 13d | 27 | 1.24mi |
| 1425 Bacchus Dr Unit C13 Lafayette, CO | 2.0 | 1.0 | 900 | $1,750 | $1.94 | 13d | 1 | 1.25mi |
| 2500 S Public Rd Lafayette, CO | 2.0 | 1.0 | 775 | $1,939 | $2.50 | 13d | 3 | 1.30mi |
| 1110 # E Unit Centaur Cir unit Lafayette, CO | 3.0 | 2.0 | 1375 | $2,400 | $1.75 | 21d | 1 | 1.34mi |
| 1221 Warrior Way Unit 1 Lafayette, CO | 3.0 | 2.5 | 1260 | $2,795 | $2.22 | 21d | 1 | 1.39mi |
Listing history 16 events
-
2026-06-18days on market $75,000 Active 111 DOM
-
2026-06-17days on market $75,000 Active 110 DOM
-
2026-06-16days on market $75,000 Active 109 DOM
-
2026-06-15days on market $75,000 Active 108 DOM
-
2026-06-14days on market $75,000 Active 106 DOM
-
2026-06-13days on market $75,000 Active 105 DOM
-
2026-06-10days on market $75,000 Active 103 DOM
-
2026-06-09days on market $75,000 Active 102 DOM
-
2026-06-09days on market $75,000 Active 101 DOM
-
2026-06-07days on market $75,000 Active 100 DOM
-
2026-06-05days on market $75,000 Active 97 DOM
-
2026-06-03days on market $75,000 Active 96 DOM
-
2026-06-02days on market $75,000 Active 95 DOM
-
2026-06-01days on market $75,000 Active 94 DOM
-
2026-05-31days on market $75,000 Active 93 DOM
-
2026-05-30days on market $75,000 Active 92 DOM
ⓘ Source: listings_history table (triggers on properties + properties_extension) + one-shot
backfill from property_details.listing_events for pre-trigger history.
Climate risk First Street
- Flood 6/10 Major FEMA zone X (unshaded) · 70% chance over 30 yrs
- Wildfire 5/10 Major
- Heat 3/10 Moderate 7 d/yr ≥93°F today · 18 d/yr by 30 yrs out
- Wind 1/10 Low
- Air quality 3/10 Moderate 3 unhealthy d/yr today · 4 by 30 yrs out
Nearby sold comps map
Loading sold comps map…
Walkable amenities ~0.75 mi
Loading nearby amenities…
Taxation est. · year 1
- Rental income
- $28,548
- − Mortgage interest
- −$4,201
- − Property taxes
- −$1,125
- − Insurance
- −$375
- − Repairs & maintenance
- −$2,284
- − Management
- −$2,284
- − Depreciation
- −$2,182
- Taxable income
- $16,097
- Est. tax owed @ 24.0%
- −$3,863
- After-tax cash flow
- $12,470/yr
For passive investors: Depreciation is non-cash, so a rental often shows a tax loss while cash-flowing — sheltering income. Rental losses are passive: they offset passive income freely, and up to $25,000/yr can offset ordinary (W-2) income if you actively participate and your MAGI is under $100k (phasing out to $0 by $150k); unused losses carry forward. On sale, claimed depreciation is recaptured at up to 25%, and gains may owe capital-gains tax (a 1031 exchange can defer both). Figures are a year-1 estimate at your 24.0% rate — not tax advice; consult a CPA.
Schools (NCES district)
- District
- Boulder Valley School District No. Re2
- NCES district ID
- 0802490
- Math proficiency
- 49% ▼ -3.00%
- Reading proficiency
- 67% ▲ 4.00%
- Median HH income
- $70,395
- Composite
- 51.3/100
- National rank
- #1747
- State rank
- #6 of 86 in CO
Livability — Lafayette
- Score
- 85/100
- State rank
- #1
- US rank
- #566
Category grades
Schools grade is shown separately in the Schools card above.
Census & demographics
- Census place
- Lafayette, CO
- County
- Boulder County · 271,666 people
- City population
- 32,701
- Metro
- Boulder, CO
- Population (ZIP)
- 32,701
- Household income
- $120,187
- Rent vs Own
- Severe rent burden
- 1019.0
Population outlook (Boulder County) Hauer SSP2
- Today (2025)
- 380,833 people
- By 2030
- 412,028 · +8.2%
- By 2040
- 472,764 · +24.1%
- By 2050
- 532,029 · +39.7%
- By 2075
- 679,723 · +78.5%
- By 2100
- 766,278 · +101.2%
Race, ethnicity, and origin ACS 2023
- Neighborhood character
- Predominantly White (74%)
- Race & ethnicity
- White 74% Hispanic / Latino 15% Two or more races 11% Asian 4%
- Hispanic origin (detail)
- Mexican 8% Puerto Rican 1%
- Common ancestry
- Slovak 3% Romanian 3% Lithuanian 3%
- Foreign-born
- 10% · Canada, China, South Korea
- Languages at home
- 86% English-only · Spanish 9% Russian/Polish/Slavic 1% Other Indo-European 1%
Political lean MEDSL · Boulder
- 2024 margin
- Solid D (+55.8) · D 76.5% · R 20.8% · Other 2.7%
- 2008→2024 swing
- +9.6pp toward D · 2008: 46.1pp · 2024: 55.8pp
- All cycles
- 2024: D+55.8 2020: D+56.6 2016: D+48.6 2012: D+41.5 2008: D+46.1
Not yet ingested
- Civics
- —
Market trends
- HPI YoY
- ▼ -489.04%
- Current HPI
- 280.2819
- Rent YoY
- ▲ 1.56%
- Metro
- Boulder, CO
- State GDP YoY
- ▲ 1.95%
- F500 in state
- 14
Industry mix (Fortune 500 HQ in CO)
| Industry | F500 HQs | Revenue |
|---|---|---|
| Technology Distribution | 1 | $31B |
|
||
| Food / Agriculture | 1 | $18B |
|
||
| Packaging | 1 | $14B |
|
||
| Healthcare | 1 | $13B |
|
||
| Energy | 1 | $10B |
|
||
| Technology | 1 | $4B |
|
||
Price history
-24.2% since first listed10 events — show timeline
- 2026-05-28 Relisted — IRES
- 2026-05-28 Price Changed $75,000 IRES
- 2026-05-17 Listing Removed — IRES
- 2026-05-12 Listing Removed — REColorado as Distributed by MLS Grid
- 2026-04-22 Price Changed $80,000 REColorado as Distributed by MLS Grid
- 2026-04-09 Price Changed $80,000 IRES
- 2026-03-23 Price Changed $93,000 REColorado as Distributed by MLS Grid
- 2026-03-13 Price Changed $93,000 IRES
- 2026-02-17 Listed $99,000 REColorado as Distributed by MLS Grid
- 2026-02-17 Listed $99,000 IRES
Property tax history
-0.4%/yrLatest (2025): $107 · +142.0% YoY. Source: county tax records.
Cash-flow waterfall
monthlySold comps — $/sqft
last 12 mo · ≤1 miLoading sold comps…