13033 Pennington Pl #101 · Fort Myers, FL
Flood risk 1/10 · Minimal
- FEMA flood zone
- X (unshaded)
- Chance of flooding over 30 yrs
- 0.0%
- Est. flood insurance / yr
- $507 – $1,088
Fire risk 4/10 · Minor
- Est. fire insurance / yr
- $947 – $1,759
Heat risk 10/10 · Severe
- Hot days now (above 107°F)
- 7 days/yr
- Hot days in 30 yrs
- 28 days/yr
Wind risk 10/10 · Severe
- Chance of severe wind over 30 yrs
- 99.0%
Air-quality risk 2/10 · Minimal
- Unhealthy air days now
- 1 days/yr
- Unhealthy air days in 30 yrs
- 1 days/yr
Risk factors via First Street. Map © Google.
Why this score? — see what drove the D grade
The composite is a weighted blend of 9 inputs, each scored 0–100. Each bar is that input's sub-score; the figure is the points it added to the 100-point composite (weight × sub-score).
- Cash flow +11.0/30.0
- ARV discount +7.5/15.0
- 1% rule +6.7/10.0
- Livability +4.3/5.0
- Schools +4.1/10.0
- DSCR +3.2/10.0
- Rent growth +2.6/5.0
- Condition / age +2.5/5.0
- Appreciation +0.0/10.0
$350,000
🖨 Deal sheet (PDF) 📄 Offer letter ✓ Due diligence
Listing remarks
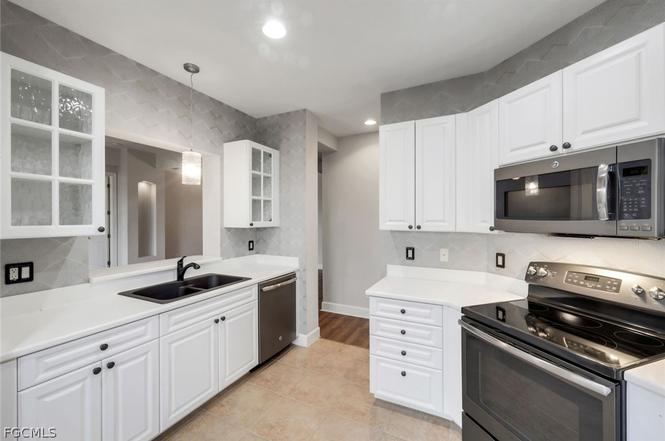
Are you looking at the sq feet on this first floor condo? It is a true 3/3 and you will not question this purchase at this price. Welcome to one of the best floor plans in The Plantation. This first-floor, 3-bedroom, 3-bath condo offers the largest layout built by Centex. You get space, comfort, and easy living all on one level. What You’ll Love Largest first-floor plan in The Plantation. 3 full bedrooms and 3 baths Plantation shutters throughout Light-filled living areas Peaceful spot to watch the sunrise Low condo fees — the lowest of all condo streets in the community Start your day with coffee on the lanai as the sun rises. Then head out and en
Key facts
- Plantation shutters
- Low condo fees
- $985 HOA
Tags
Property features AI
Finance
- Financial info: Pets allowed
- HOA & community: Homeowners association with quarterly fees; Association covers cable TV, insurance, internet, irrigation water, grounds maintenance, pest control, recreation facilities, road maintenance, street lights, and water; Community amenities include clubhouse, fitness center, pool, spa/hot tub, sauna, restaurant, private membership, golf course, putting greens, tennis courts, pickleball, bocce court, library; Gated community with street lights; 954 units in the community
Exterior
- Parking: Attached 2-car garage; Assigned parking; Driveway; Guest parking; Paved parking; Garage door opener; Two covered parking spaces
- Security: Gated community with guard; Fire sprinkler system; Smoke detectors
- Utilities: Public water; Public sewer; Cable available; High speed internet available; Irrigation water from lake
- Home design: 2-story building; Entry level: 1; Resale property; Faces west
- Construction: Tile roof; Block, concrete, and stucco construction
- Exterior features: Lanai; Porch; Screened porch; Shutters (manual); Zero lot line; Paved road access; East exposure; Has a view
Interior
- Kitchen: Electric cooktop; Microwave; Dishwasher; Disposal; Refrigerator; Pantry; Breakfast bar
- Bedrooms: Bedroom on main level
- Flooring: Carpet; Tile
- Bathrooms: 3 full bathrooms; Dual sinks; Separate shower; Bathtub
- Heating & cooling: Central heating (electric); Central air conditioning (electric)
- Interior features: Breakfast bar; Bedroom on main level; Bathtub; Dual sinks; High ceilings; Living/dining room; Pantry; Separate shower; Cable TV available; High speed internet available; Split bedrooms; Double hung windows; Unfurnished
- Laundry & utility: Washer and dryer included; Inside laundry; Laundry tub
Neighborhood map
What this means for you Summary
Snapshot
- This is a 3-bed/3.0-bath condo listed at $350k.
Deal economics
- At list price, monthly cash flow is $-147 ($-2k/yr) — negative.
- To cash-flow at today's rent, offer at most $324k (7.4% below list).
- Meets the 1% rule at list price ($4k rent vs $350k).
- Recommended offer: $318k (9.0% below list) — sets the bar for market timing.
- Cap rate 5.8% vs local median 3.3% in Fort Myers — top-decile yield for the area; either an underpriced asset or a hidden risk that comps aren't pricing in. Stress-test before assuming the spread holds.
Location & tenants
- Location reads 86/100 on livability (#14 in FL, #383 nationally) — a professional / high-income tenant draw. Strengths: amenities A+, commute A+, housing A+.
- Lee (suburban): math 47% / reading 50% proficiency, ranked #42 of 73 in FL (top 58%) — families likely to look elsewhere, expect single-tenant / working-renter base with shorter leases.
- Zoned schools: Veterans Park Academy For The Arts (math 41% / reading 45%, grade F, #1,366 of 2,144 statewide, top 64%, 2,133 students, 36% FRL); Oak Hammock Middle School (math 43% / reading 41%, grade D-, #340 of 571 statewide, top 61%, 1,563 students, 56% FRL); Lehigh Senior High School (math 23% / reading 45%, grade F, #394 of 667 statewide, top 60%, 2,476 students, 57% FRL).
- Market conditions: Rents flat; 821 active listings in the ZIP; 23 comparable units currently listed for rent nearby; rentals at typical pace (median 26d on market — plan ~3-4 weeks tenant-placement turnaround); high-income renter base; 15,411 units permitted in Lee County in 2024 (4,686 in 5+ unit buildings).
- This rent runs 44% of the median local income ($110k/yr) — at the standard rent-burdened threshold; future hikes will face affordability resistance.
Forward outlook
- Local home prices are declining (-3.0%/yr); year-one equity from $2k of loan paydown is wiped out by about $10k of value loss. Plan a longer hold.
- Lee County population projected at +44% by 2050 — long-run rental-demand tailwind backs the buy-and-hold thesis.
Negotiation context
- It's been on market 92 days — a 9% lower offer ($318k) is reasonable based on typical stale-listing flexibility.
- Current owner paid $225k; list at $350k implies a 56% gain — meaningful room to come down on a strong offer.
Risks & watch-outs
- Watch-outs: HOA is 24% of rent.
- Climate carrying-cost: severe wind risk, 99% chance of damaging wind over 30y; extreme-heat days projected 7→28/yr by 2055 (HVAC capex compounding) — expect insurance premiums to compound above CPI over the hold.
Questions for the listing agent
- What do current leases actually rent for vs. the listed asking? Can we see a recent rent roll and the last 12 months of T-12 income?
- It's been on market 92 days. Have you received any prior offers? Is the seller open to a 9% concession, seller financing, or rate buy-down credit?
- What does the HOA fee cover, when was the last increase, and are there any pending special assessments or reserve-fund shortfalls?
- Any open or pending special assessments — roof, HVAC, plumbing, elevator, façade? What's the per-unit balance and payoff schedule, and is the seller paying it off at close or rolling it to the buyer?
- Why hasn't it sold? Are there any deal-killer items the seller is aware of (foundation, flood, title, zoning, code violations)?
- Is there a deadline driving the sale (1031 exchange, divorce, estate, relocation)? That informs how much negotiation room exists.
- The area grade is low — what's the realistic commute time and amenity access for the typical tenant pool here? Any planned neighborhood developments (good or bad) we should know about?
- What's the average days-on-market for RENTAL listings here right now (not sales)? A rising rental-DOM trend means longer vacancies and softer asking-rent achievability than the comps imply.
- What's the recent tenant-quality profile in this submarket — average credit score on applications, eviction rate, late-payment / NSF rate, and stable-employment percentage? A property-management company in the area should have these aggregated.
- How much new apartment / multifamily construction is in the pipeline within 1–3 miles? Heavy new supply (>2% of stock underway) typically softens rents 12–24 months out; light construction supports rent growth.
Investment metrics
- 1% rule
- 1.17% ✓
- Cap rate
- 5.79%
- Cash-on-cash
- -1.80%
- DSCR
- 0.92
- GRM
- 7.1
CMA / ARV
No comps found within radius.
Projected returns pro-forma
-3.0% appreciation · 0.37% rent growth · sell at horizon
- IRR
- -23.3%
- Equity multiple
- 0.22×
- Total profit
- $-75,978
- Equity at exit
- $52,186
- IRR
- -32.8%
- Equity multiple
- -0.19×
- Total profit
- $-116,620
- Equity at exit
- $30,262
Cash invested: $98,000 (down + closing). Projections, not guarantees.
Landlord ↔ Tenant lean methodology
- Overall (STATE)
- 87 Strongly Landlord-Friendly
- State Florida
- 87 Strongly Landlord-Friendly · R+3
- County
- — inherits STATE
- City
- — inherits STATE
ZIP-level market 33913
- Home prices YoY
- -10.3%
- Rents YoY
- 0.4%
- Active inventory
- 821
- Price-to-rent
- 7.1×
Monthly cashflow live
- Estimated rent
- $4,087 high interval (Pro) →
- Mortgage (P&I)
- −$1,835
- Tax from tax record
- −$410 /mo · $4,919/yr
- Insurance
- −$146
- HOA
- −$985
- Vacancy / Maint / Mgmt
- −$858
- Net cashflow
- $-147
Break-even live
Sensitivity live
| Price | -10% $51 | -5% $-48 | +0% $-147 | +5% $-246 | +10% $-345 |
|---|---|---|---|---|---|
| Rent | -10% $-470 | -5% $-309 | +0% $-147 | +5% $14 | +10% $176 |
| Rate | -1.0pp $29 | -0.5pp $-58 | base $-147 | +0.5pp $-238 | +1.0pp $-330 |
UW: 25.0% down · 7.5% · 30yr · 1.5% tax · 5.0% vac · 8.0% maint · 8.0% mgmt
Financing live
Cash to close
- Down payment
- $87,500
- Closing costs
- $10,500
- Reserves months
- —
- Total cash needed
- —
Loan-product check · same deal, 3 products live
Conventional
25% down · 7.5% · 30yr
- Down + closing
- —
- Monthly P&I
- —
- Monthly cashflow
- —
- DSCR
- —
- Eligible?
- —
Personal DTI + credit; lowest rate.
DSCR
20% down · 8.5% · 30yr
- Down + closing
- —
- Monthly P&I
- —
- Monthly cashflow
- —
- DSCR
- —
- Eligible?
- —
No personal income docs; deal must DSCR.
Hard money
10% down · 12.0% · 12mo
- Down + closing
- —
- Monthly P&I
- —
- Monthly cashflow
- —
- DSCR
- —
- Eligible?
- —
Short-term bridge; refi at stabilization.
Rent comps 23 comps
| Address | Beds | Baths | Sqft | Rent | $/sqft | DOM | Units | Dist |
|---|---|---|---|---|---|---|---|---|
| 13068 Georges Cay Pl Fort Myers, FL | 3.0 | 2.5 | 1590 | $2,900 | $1.82 | 16d | 1 | 0.38mi |
| 13104 Georges Cay Pl Fort Myers, FL | 3.0 | 2.5 | 1590 | $3,100 | $1.95 | 25d | 1 | 0.40mi |
| 13071 Georges Cay Pl Fort Myers, FL | 3.0 | 3.0 | 1600 | $3,800 | $2.38 | 25d | 1 | 0.41mi |
| 12908 New Market St #201 Fort Myers, FL | 3.0 | 2.5 | 2198 | $3,000 | $1.36 | 25d | 1 | 0.44mi |
| 10900 Legacy Gateway Cir Fort Myers, FL | 1.0–3.0 | 1.0–2.5 | 1115 | $2,350 | $2.11 | 3d | 36 | 0.57mi |
| 10271 Glastonbury Cir #102 Fort Myers, FL | 2.0 | 2.0 | 1550 | $4,500 | $2.90 | 25d | 1 | 0.82mi |
| 12171 Treeline Ave Fort Myers, FL | 1.0–3.0 | 1.0–2.0 | 1321 | $3,402 | $2.58 | 5d | 23 | 0.88mi |
| 11869 Lakewood Preserve Pl Fort Myers, FL | 2.0 | 2.0 | 1646 | $5,000 | $3.04 | 25d | 1 | 1.08mi |
| 9340 Triana Ter #4 Fort Myers, FL | 3.0 | 3.0 | 2563 | $7,500 | $2.93 | 25d | 1 | 1.08mi |
| 9221 Triana Ter #4 Fort Myers, FL | 3.0 | 3.0 | 2520 | $11,500 | $4.56 | 25d | 1 | 1.13mi |
| 10900 Glenhurst St Fort Myers, FL | 2.0 | 2.0 | 1355 | $2,200 | $1.62 | 4d | 1 | 1.16mi |
| 10908 Clarendon St Fort Myers, FL | 3.0 | 2.0 | 1433 | $8,000 | $5.58 | 25d | 1 | 1.17mi |
| 10908 Clarendon St Fort Myers, FL | 3.0 | 2.0 | 1433 | $8,000 | $5.58 | 16d | 1 | 1.17mi |
| 9281 Triana Ter #1 Fort Myers, FL | 3.0 | 2.0 | 1826 | $8,500 | $4.65 | 25d | 1 | 1.17mi |
| 12016 Five Waters Cir Fort Myers, FL | 3.0 | 2.0 | 1646 | $4,500 | $2.73 | 25d | 1 | 1.17mi |
| 12531 Villagio Way Fort Myers, FL | 3.0 | 2.0 | 1913 | $8,500 | $4.44 | 25d | 1 | 1.22mi |
| 10952 Clarendon St Fort Myers, FL | 2.0 | 2.0 | 1582 | $4,000 | $2.53 | 25d | 1 | 1.24mi |
| 11617 Lakewood Preserve Pl Fort Myers, FL | 3.0 | 2.5 | 2242 | $3,100 | $1.38 | 17d | 1 | 1.28mi |
| 11593 Lakewood Preserve Pl Fort Myers, FL | 2.0 | 2.0 | 1985 | $2,800 | $1.41 | 25d | 1 | 1.31mi |
| 11012 Castlereagh St Fort Myers, FL | 3.0 | 3.0 | 2517 | $12,000 | $4.77 | 25d | 1 | 1.39mi |
| 11619 Meadowrun Cir Fort Myers, FL | 3.0 | 2.5 | 2242 | $2,495 | $1.11 | 25d | 1 | 1.42mi |
| 10879 Rutherford Rd Fort Myers, FL | 2.0 | 2.0 | 1566 | $3,500 | $2.23 | 25d | 1 | 1.49mi |
| 11541 Stonecreek Cir Fort Myers, FL | 3.0 | 3.0 | 2147 | $3,300 | $1.54 | 25d | 1 | 1.50mi |
HOA detail condo
- Monthly dues
- $985 · $11,820/yr
- Assessments
- None detected in remarks — confirm with the listing agent.
Listing history 4 events
-
2026-05-15status Pending
-
2026-04-25price $350,000
-
2026-02-12$365,000 Active
-
2015-04-28soldstatus $225,000
ⓘ Source: listings_history table (triggers on properties + properties_extension) + one-shot
backfill from property_details.listing_events for pre-trigger history.
Tax reassessment forecast FL · Resets to sale price
- Current annual tax
- $4,919 · $410/mo
- Projected year-2 tax
- $4,919 · $410/mo
- Expected delta
- $0/yr ($0/mo · 0.0%)
ⓘ Screening estimate from a state-policy table — verify with the county assessor before closing.
Climate risk First Street
- Flood 1/10 Low FEMA zone X (unshaded) · 0% chance over 30 yrs
- Wildfire 4/10 Moderate
- Heat 10/10 Extreme 7 d/yr ≥107°F today · 28 d/yr by 30 yrs out
- Wind 10/10 Extreme 99% chance of damaging wind over 30 yrs
- Air quality 2/10 Low 1 unhealthy d/yr today · 1 by 30 yrs out
Nearby sold comps map
Loading sold comps map…
Walkable amenities ~0.75 mi
Loading nearby amenities…
Taxation est. · year 1
- Rental income
- $49,048
- − Mortgage interest
- −$19,605
- − Property taxes
- −$4,919
- − Insurance
- −$1,750
- − Repairs & maintenance
- −$3,924
- − Management
- −$3,924
- − HOA
- −$11,820
- − Depreciation
- −$10,182
- Taxable loss
- −$7,076
- Est. tax savings @ 24.0%
- +$1,698
- After-tax cash flow
- $-68/yr
For passive investors: Depreciation is non-cash, so a rental often shows a tax loss while cash-flowing — sheltering income. Rental losses are passive: they offset passive income freely, and up to $25,000/yr can offset ordinary (W-2) income if you actively participate and your MAGI is under $100k (phasing out to $0 by $150k); unused losses carry forward. On sale, claimed depreciation is recaptured at up to 25%, and gains may owe capital-gains tax (a 1031 exchange can defer both). Figures are a year-1 estimate at your 24.0% rate — not tax advice; consult a CPA.
Schools (NCES district)
- District
- Lee
- NCES district ID
- 1201080
- Math proficiency
- 47% ▼ -11.00%
- Reading proficiency
- 50% ▼ -4.00%
- Median HH income
- $49,518
- Composite
- 41.49/100
- National rank
- #3458
- State rank
- #42 of 73 in FL
Livability — Fort Myers
- Score
- 86/100
- State rank
- #14
- US rank
- #383
Category grades
Schools grade is shown separately in the Schools card above.
Census & demographics
- Census place
- Fort Myers, FL
- County
- Lee County · 788,662 people
- City population
- 278,598
- Metro
- Cape Coral-Fort Myers, FL
- Population (ZIP)
- 31,538
- Household income
- $110,373
- Rent vs Own
- Severe rent burden
- 276.0
Population outlook (Lee County) Hauer SSP2
- Today (2025)
- 871,946 people
- By 2030
- 955,468 · +9.6%
- By 2040
- 1,113,587 · +27.7%
- By 2050
- 1,256,891 · +44.1%
- By 2075
- 1,560,270 · +78.9%
- By 2100
- 1,726,848 · +98.0%
Race, ethnicity, and origin ACS 2023
- Neighborhood character
- Predominantly White (74%)
- Race & ethnicity
- White 74% Hispanic / Latino 13% Two or more races 11% Black 5% Asian 2%
- Hispanic origin (detail)
- Mexican 3% Puerto Rican 3% Cuban 2%
- Common ancestry
- Romanian 5% Lithuanian 3% Slovak 2%
- Foreign-born
- 14% · Canada, Vietnam, China
- Languages at home
- 84% English-only · Spanish 10% Other Indo-European 2% French/Haitian/Cajun 2%
Political lean MEDSL · Lee
- 2024 margin
- Strong R (+28.4) · D 35.5% · R 63.9%
- 2008→2024 swing
- -18.0pp toward R · 2008: -10.4pp · 2024: -28.4pp
- All cycles
- 2024: R+28.4 2020: R+19.2 2016: R+20.4 2012: R+16.6 2008: R+10.4
Not yet ingested
- Civics
- —
Market trends
- HPI YoY
- ▼ -25.45%
- Current HPI
- 221.7115
- Rent YoY
- ▲ 0.37%
- Metro
- Cape Coral-Fort Myers, FL
- State GDP YoY
- ▲ 3.28%
- F500 in state
- 36
Industry mix (Fortune 500 HQ in FL)
| Industry | F500 HQs | Revenue |
|---|---|---|
| Industrial Technology | 2 | $29B |
|
||
| Insurance | 2 | $17B |
|
||
| Retail | 1 | $60B |
|
||
| Technology Distribution | 1 | $58B |
|
||
| Homebuilding | 1 | $35B |
|
||
| Technology Manufacturing | 1 | $35B |
|
||
Price history
+55.6% since first listed4 events — show timeline
- 2026-05-15 Pending — FORTMLS
- 2026-04-25 Price Changed $350,000 FORTMLS
- 2026-02-12 Listed $365,000 FORTMLS
- 2015-04-28 Sold (Public Records) $225,000 Public Records
Property tax history
-2.6%/yrLatest (2025): $4,919 · +2.1% YoY. Source: county tax records.
Cash-flow waterfall
monthlySold comps — $/sqft
last 12 mo · ≤1 miLoading sold comps…