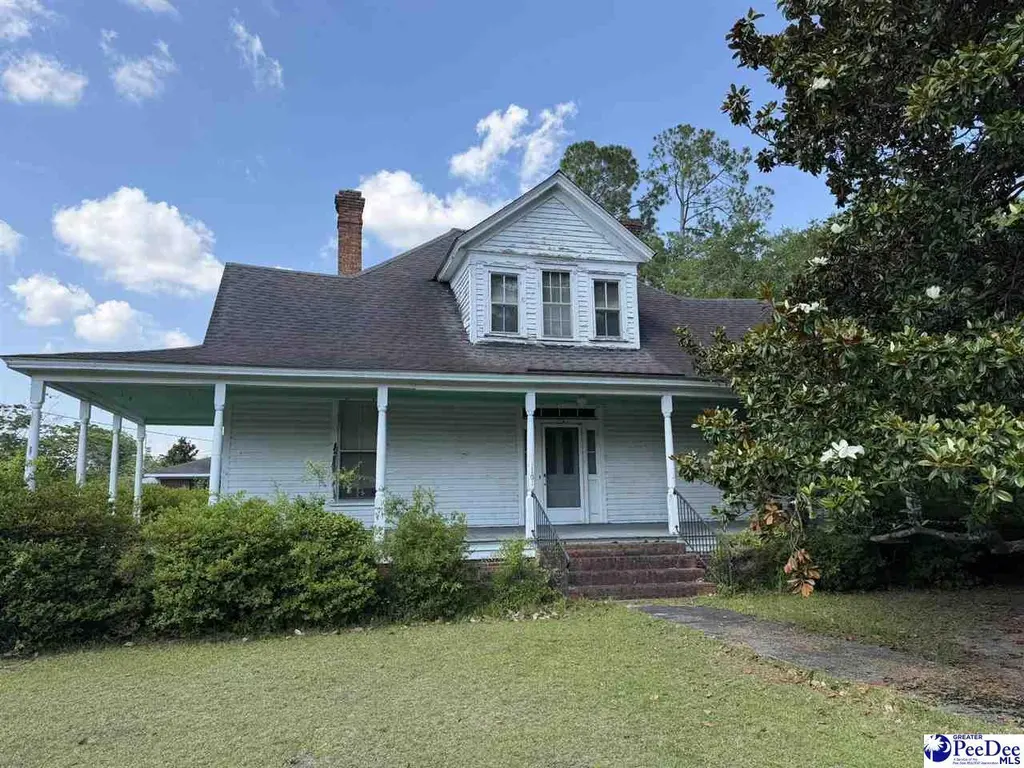
1101 E Main St · Dillon, SC
Flood risk 1/10 · Minimal
- FEMA flood zone
- X (unshaded)
- Chance of flooding over 30 yrs
- 0.0%
- Est. flood insurance / yr
- $507 – $1,088
Fire risk 4/10 · Minor
- Est. fire insurance / yr
- $783 – $1,453
Heat risk 7/10 · Major
- Hot days now (above 107°F)
- 7 days/yr
- Hot days in 30 yrs
- 16 days/yr
Wind risk 8/10 · Major
- Chance of severe wind over 30 yrs
- 80.0%
Air-quality risk 1/10 · Minimal
- Unhealthy air days now
- 0 days/yr
- Unhealthy air days in 30 yrs
- 0 days/yr
Risk factors via First Street. Map © Google.
Why this score? — see what drove the C grade
The composite is a weighted blend of 9 inputs, each scored 0–100. Each bar is that input's sub-score; the figure is the points it added to the 100-point composite (weight × sub-score).
- Cash flow +24.5/30.0
- DSCR +7.9/10.0
- ARV discount +7.5/15.0
- 1% rule +6.3/10.0
- Livability +3.2/5.0
- Rent growth +2.5/5.0
- Condition / age +2.5/5.0
- Schools +1.6/10.0
- Appreciation +0.0/10.0
$99,000
🖨 Deal sheet 📄 Offer letter ✓ Due diligence
Listing remarks
Located on a corner lot in the historic district, this Main Street home is full of character and waiting for the right owner to bring it back to life. Situated on approximately 0.39 acres and shaded by a beautiful mature magnolia tree that adds to the property's timeless Southern appeal, the home offers approximately 2,095 square feet with 3-4 bedrooms, hardwood floors, high ceilings, fireplaces, and the charm that only an older Southern home can provide. While repairs and updates are needed, the potential is evident throughout. Whether you're looking for a restoration project, investment opportunity, or a chance to own a piece of local history, this property is ready for its next chapter.
Key facts
- Fireplaces
- Mature magnolia tree
- High ceilings
Tags
Property features AI
Exterior
- Home design: Single family residence; Residential property
- Construction: Wood siding construction
- Exterior features: Porch with screened area; Shingle roof; Lot approximately 0.38 acres
Interior
- Flooring: Carpet; Wood; Hardwood
- Bathrooms: 1 full bathroom; 1 half bathroom
- Heating & cooling: Has heating; Has cooling; Ceiling fan(s); Exhaust fan; Fireplace insert; 2 fireplaces (one in the living room)
- Interior features: Walk-in closet(s); Crawl space basement
Neighborhood map
What this means for you Summary
Snapshot
- This is a 3-bed/1.5-bath single-family listed at $99k.
Deal economics
- At list price, monthly cash flow is $203 ($2k/yr) — positive.
- The deal already cash-flows at list — no discount required.
- Meets the 1% rule at list price ($1k rent vs $99k).
Location & tenants
- Location reads 63/100 on livability (#163 in SC) — a middle-class / working-renter tenant base. Strengths: cost of living A+, housing A+, health & safety A+; Watch: commute D+, crime F, amenities F.
- Dillon 04 (town): math 14% / reading 27% proficiency, ranked #72 of 80 in SC (top 90%) — low school quality limits family demand, transient renter base, plan for 1-2y turnover; 83% free/reduced lunch — lower-income household profile, screen leases tightly.
- Zoned schools: Dillon Middle (math 10% / reading 22%, grade F, #196 of 229 statewide, top 87%, 666 students, 100% FRL); Dillon High (math 12% / reading 67%, grade F, #180 of 196 statewide, top 93%, 869 students, 100% FRL) — zoned schools average 100% FRL vs 83% district-wide (17 pts higher); higher-poverty schools than district average — tighter screening recommended.
- Market conditions: 78 active listings in the ZIP; 41 units permitted in Dillon County in 2024 (0 in 5+ unit buildings).
Forward outlook
- Local home prices are declining (-3.0%/yr); year-one equity from $684 of loan paydown is wiped out by about $3k of value loss. Plan a longer hold.
- Dillon County population projected at -25% by 2050 — secular population decline; favor cash flow + early exit over multi-decade hold.
Negotiation context
- Only 6 days on market — expect competitive offers; lowballing is unlikely to land.
Risks & watch-outs
- Watch-outs: built in 1926 — expect roof / HVAC / electrical / plumbing capex.
- Climate carrying-cost: severe wind risk, 80% chance of damaging wind over 30y; extreme-heat days projected 7→16/yr by 2055 (HVAC capex compounding) — expect insurance premiums to compound above CPI over the hold.
Questions for the listing agent
- Built in 1926 — when were the roof, HVAC, electrical panel, plumbing, and water heater last replaced?
- Is there a deadline driving the sale (1031 exchange, divorce, estate, relocation)? That informs how much negotiation room exists.
- Schools are F-rated, which usually means shorter tenancies and higher turnover. Who's the typical renter profile here, and what's been the actual vacancy rate?
- Crime grade is F in this area — have there been break-ins, vandalism, or insurance claims at this property in the last 3 years? What carrier currently insures it and at what premium?
- What's the average days-on-market for RENTAL listings here right now (not sales)? A rising rental-DOM trend means longer vacancies and softer asking-rent achievability than the comps imply.
- What's the recent tenant-quality profile in this submarket — average credit score on applications, eviction rate, late-payment / NSF rate, and stable-employment percentage? A property-management company in the area should have these aggregated.
- How much new for-sale + rental construction is in the pipeline within 1–3 miles? Heavy new supply typically softens prices + rents 12–24 months out; constrained supply supports both.
Investment metrics
- 1% rule
- 1.13% ✓
- Cap rate
- 8.76%
- Cash-on-cash
- 8.80%
- DSCR
- 1.39
- GRM
- 7.3
CMA / ARV
No comps found within radius.
Projected returns pro-forma
-3.0% appreciation · 3.0% rent growth · sell at horizon
- IRR
- -2.9%
- Equity multiple
- 0.89×
- Total profit
- $-3,072
- Equity at exit
- $14,761
- IRR
- 6.8%
- Equity multiple
- 1.51×
- Total profit
- $14,073
- Equity at exit
- $8,560
Cash invested: $27,720 (down + closing). Projections, not guarantees.
Landlord ↔ Tenant lean methodology
- Overall (STATE)
- 90 Strongly Landlord-Friendly
- State South Carolina
- 90 Strongly Landlord-Friendly · R+6
- County
- — inherits STATE
- City
- — inherits STATE
ZIP-level market 29536
- Home prices YoY
- -33.9%
- Active inventory
- 78
- Price-to-rent
- 7.3×
Monthly cashflow live
- Estimated rent
- $1,123 medium interval (Pro) →
- Mortgage (P&I)
- −$519
- Tax est. 1.5%
- −$124 /mo · $1,485/yr
- Insurance
- −$41
- HOA
- −$0
- Vacancy / Maint / Mgmt
- −$236
- Net cashflow
- $203
Break-even live
UW: 25.0% down · 7.5% · 30yr · 1.5% tax · 5.0% vac · 8.0% maint · 8.0% mgmt
Financing live
Cash to close
- Down payment
- $24,750
- Closing costs
- $2,970
- Reserves months
- —
- Total cash needed
- —
Loan-product check · same deal, 3 products live
Conventional
25% down · 7.5% · 30yr
- Down + closing
- —
- Monthly P&I
- —
- Monthly cashflow
- —
- DSCR
- —
- Eligible?
- —
Personal DTI + credit; lowest rate.
DSCR
20% down · 8.5% · 30yr
- Down + closing
- —
- Monthly P&I
- —
- Monthly cashflow
- —
- DSCR
- —
- Eligible?
- —
No personal income docs; deal must DSCR.
Hard money
10% down · 12.0% · 12mo
- Down + closing
- —
- Monthly P&I
- —
- Monthly cashflow
- —
- DSCR
- —
- Eligible?
- —
Short-term bridge; refi at stabilization.
Listing history 6 events
-
2026-06-18days on market $99,000 Active 6 DOM
-
2026-06-17days on market $99,000 Active 5 DOM
-
2026-06-16days on market $99,000 Active 4 DOM
-
2026-06-15days on market $99,000 Active 3 DOM
-
2026-06-12remarks 699-char remark
-
2026-06-12$99,000 Active 1 DOM
ⓘ Source: listings_history table (triggers on properties + properties_extension) + one-shot
backfill from property_details.listing_events for pre-trigger history.
Climate risk First Street
- Flood 1/10 Low FEMA zone X (unshaded) · 0% chance over 30 yrs
- Wildfire 4/10 Moderate
- Heat 7/10 Severe 7 d/yr ≥107°F today · 16 d/yr by 30 yrs out
- Wind 8/10 Severe 80% chance of damaging wind over 30 yrs
- Air quality 1/10 Low 0 unhealthy d/yr today · 0 by 30 yrs out
Nearby sold comps map
Loading sold comps map…
Walkable amenities ~0.75 mi
Loading nearby amenities…
Taxation est. · year 1
- Rental income
- $13,482
- − Mortgage interest
- −$5,546
- − Property taxes
- −$1,485
- − Insurance
- −$495
- − Repairs & maintenance
- −$1,079
- − Management
- −$1,079
- − Depreciation
- −$2,880
- Taxable income
- $919
- Est. tax owed @ 24.0%
- −$221
- After-tax cash flow
- $2,220/yr
For passive investors: Depreciation is non-cash, so a rental often shows a tax loss while cash-flowing — sheltering income. Rental losses are passive: they offset passive income freely, and up to $25,000/yr can offset ordinary (W-2) income if you actively participate and your MAGI is under $100k (phasing out to $0 by $150k); unused losses carry forward. On sale, claimed depreciation is recaptured at up to 25%, and gains may owe capital-gains tax (a 1031 exchange can defer both). Figures are a year-1 estimate at your 24.0% rate — not tax advice; consult a CPA.
Schools (NCES district)
- District
- Dillon 04
- NCES district ID
- 4501920
- Math proficiency
- 14% ▼ -15.00%
- Reading proficiency
- 27% ▼ -9.00%
- Median HH income
- $27,820
- Composite
- 16.16/100
- National rank
- #9230
- State rank
- #72 of 80 in SC
Livability — Dillon
- Score
- 63/100
- State rank
- #163
- US rank
- #14995
Category grades
Schools grade is shown separately in the Schools card above.
Census & demographics
- Census place
- Dillon, SC
- City population
- 15,825
- Population (ZIP)
- 15,825
Population outlook (Dillon County) Hauer SSP2
- Today (2025)
- 29,087 people
- By 2030
- 27,713 · -4.7%
- By 2040
- 24,772 · -14.8%
- By 2050
- 21,836 · -24.9%
- By 2075
- 15,165 · -47.9%
- By 2100
- 9,849 · -66.1%
Race, ethnicity, and origin ACS 2023
- Neighborhood character
- Diverse neighborhood (Simpson 0.58)
- Race & ethnicity
- Black 54% White 36% Two or more races 5% Hispanic / Latino 4% Native American 1%
- Common ancestry
- Serbian 1% Slovak 1%
- Foreign-born
- 2% · Canada
- Languages at home
- 97% English-only · Spanish 3%
Political lean MEDSL · Dillon
- 2024 margin
- R (+10.8) · D 44.2% · R 55.0%
- 2008→2024 swing
- -22.3pp toward R · 2008: 11.4pp · 2024: -10.8pp
- All cycles
- 2024: R+10.8 2020: R+1.1 2016: D+1.7 2012: D+16.3 2008: D+11.4
Not yet ingested
- Civics
- —
Market trends
- HPI YoY
- ▼ -46.08%
- Current HPI
- 89.7124
- Rent YoY
- —
- Metro
- —
- State GDP YoY
- ▲ 4.51%
- F500 in state
- 2
Industry mix (Fortune 500 HQ in SC)
| Industry | F500 HQs | Revenue |
|---|---|---|
| Packaging | 1 | $7B |
|
||
Price history
1 event — show timeline
- 2026-06-10 Listed $99,000 RAGPD
Property tax history
+3.5%/yrLatest (2025): $130 · +14.1% YoY. Source: county tax records.
Cash-flow waterfall
monthlySold comps — $/sqft
last 12 mo · ≤1 miLoading sold comps…