2 Bed 2 Bath Single Section Plan · Sunrise Manor, NV
Flood risk No data
- FEMA flood zone
- —
- Chance of flooding over 30 yrs
- —
- Est. flood insurance / yr
- —
Fire risk No data
- Est. fire insurance / yr
- —
Heat risk 8/10 · Major
- Hot days now (above threshold)
- 5 days/yr
- Hot days in 30 yrs
- 12 days/yr
Wind risk No data
- Chance of severe wind over 30 yrs
- —
Air-quality risk 4/10 · Minor
- Unhealthy air days now
- 4 days/yr
- Unhealthy air days in 30 yrs
- 5 days/yr
Risk factors via First Street. Map © Google.
Why this score? — see what drove the B- grade
The composite is a weighted blend of 9 inputs, each scored 0–100. Each bar is that input's sub-score; the figure is the points it added to the 100-point composite (weight × sub-score).
- Cash flow +30.0/30.0
- 1% rule +10.0/10.0
- DSCR +10.0/10.0
- ARV discount +7.5/15.0
- Livability +2.9/5.0
- Rent growth +2.8/5.0
- Schools +2.6/10.0
- Condition / age +1.0/5.0
- Appreciation +0.0/10.0
$75,900
🖨 Deal sheet 📄 Offer letter ✓ Due diligence
Listing remarks
Experience comfort, convenience, and connection at Maycliff Estates, a premier 55+ community nestled in the vibrant city of Las Vegas, Nevada. Designed with your lifestyle in mind, Maycliff Estates offers everything you need to enjoy a relaxing and fulfilling retirement. Unwind in our beautifully maintained neighborhood featuring a heated pool, soothing spa, and a newly remodeled clubhouse - the perfect place to gather with friends, attend community events, or simply enjoy the day. Whether you're a year-round resident or a seasonal snowbird, Maycliff Estates makes it easy to feel right at home. Our ideal location puts you close to all the excitement of Las Vegas while offering the peaceful
Key facts
- Ideal location
- Private community
- Soothing spa
Tags
Property features AI
Finance
- Financial info: Listing price $75,900; Inventory type: Plan
Exterior
- Home design: Single-section property; Plan name: 2 Bed 2 Bath Single Section
- Exterior features: Located at 3601 E Wyoming Ave, Las Vegas, NV
Interior
- Bedrooms: 2 bedrooms
- Bathrooms: 2 bathrooms
- Interior features: Single-section floorplan
Neighborhood map
What this means for you Summary
Snapshot
- This is a 2-bed/2.0-bath single-family listed at $76k. Condition is rated poor.
Deal economics
- At list price, monthly cash flow is $707 ($8k/yr) — positive.
- The deal already cash-flows at list — no discount required.
- Meets the 1% rule at list price ($2k rent vs $76k).
- Recommended offer: $75k (1.5% below list) — sets the bar for market timing.
Location & tenants
- Location reads 58/100 on livability (#83 in NV) — a working-class tenant base; expect higher turnover. Strengths: cost of living A+, housing A+; Watch: employment D, schools F, crime F.
- Clark County School District (urban): math 21% / reading 39% proficiency, ranked #11 of 17 in NV (top 65%) — families likely to look elsewhere, expect single-tenant / working-renter base with shorter leases.
- Market conditions: Rents rising (+1.2%/yr); 145 active listings in the ZIP; 40 comparable units currently listed for rent nearby; rentals at typical pace (median 24d on market — plan ~3-4 weeks tenant-placement turnaround); 14,754 units permitted in Clark County in 2024 (2,301 in 5+ unit buildings).
- This rent runs 36% of the median local income ($52k/yr) — at the standard rent-burdened threshold; future hikes will face affordability resistance.
Forward outlook
- Local home prices are declining (-3.0%/yr); year-one equity from $525 of loan paydown is wiped out by about $2k of value loss. Plan a longer hold.
- Clark County population projected at +36% by 2050 — long-run rental-demand tailwind backs the buy-and-hold thesis.
- At projected returns (-3.0% appreciation + 1.2% rent growth), your $21k cash investment doubles in ~4 years — after that, you're playing with house money.
Negotiation context
- It's been on market 22 days — a 2% lower offer ($75k) is reasonable based on typical stale-listing flexibility.
Risks & watch-outs
- Climate carrying-cost: extreme-heat days projected 5→12/yr by 2055 (HVAC capex compounding) — expect insurance premiums to compound above CPI over the hold.
Questions for the listing agent
- Have any recent inspections been done? Can we get a copy of the seller's disclosures and any deferred-maintenance estimates?
- Is there a deadline driving the sale (1031 exchange, divorce, estate, relocation)? That informs how much negotiation room exists.
- Schools are F-rated, which usually means shorter tenancies and higher turnover. Who's the typical renter profile here, and what's been the actual vacancy rate?
- Crime grade is F in this area — have there been break-ins, vandalism, or insurance claims at this property in the last 3 years? What carrier currently insures it and at what premium?
- What's the average days-on-market for RENTAL listings here right now (not sales)? A rising rental-DOM trend means longer vacancies and softer asking-rent achievability than the comps imply.
- What's the recent tenant-quality profile in this submarket — average credit score on applications, eviction rate, late-payment / NSF rate, and stable-employment percentage? A property-management company in the area should have these aggregated.
- How much new for-sale + rental construction is in the pipeline within 1–3 miles? Heavy new supply typically softens prices + rents 12–24 months out; constrained supply supports both.
Investment metrics
- 1% rule
- 2.05% ✓
- Cap rate
- 17.47%
- Cash-on-cash
- 39.93%
- DSCR
- 2.78
- GRM
- 4.1
CMA / ARV
No comps found within radius.
Projected returns pro-forma
-3.0% appreciation · 1.18% rent growth · sell at horizon
- IRR
- 34.2%
- Equity multiple
- 2.41×
- Total profit
- $29,958
- Equity at exit
- $11,317
- IRR
- 40.1%
- Equity multiple
- 4.44×
- Total profit
- $73,082
- Equity at exit
- $6,562
Cash invested: $21,252 (down + closing). Projections, not guarantees.
Landlord ↔ Tenant lean methodology
- Overall (STATE)
- 71 Landlord-Friendly
- State Nevada
- 71 Landlord-Friendly · R+1
- County
- — inherits STATE
- City
- — inherits STATE
ZIP-level market 89104
- Rents YoY
- 1.2%
- Active inventory
- 145
- Price-to-rent
- 4.1×
Monthly cashflow live
- Estimated rent
- $1,559 high interval (Pro) →
- Mortgage (P&I)
- −$398
- Tax est. 1.5%
- −$95 /mo · $1,138/yr
- Insurance
- −$32
- HOA
- −$0
- Vacancy / Maint / Mgmt
- −$327
- Net cashflow
- $707
Break-even live
UW: 25.0% down · 7.5% · 30yr · 1.5% tax · 5.0% vac · 8.0% maint · 8.0% mgmt
Financing live
Cash to close
- Down payment
- $18,975
- Closing costs
- $2,277
- Reserves months
- —
- Total cash needed
- —
Loan-product check · same deal, 3 products live
Conventional
25% down · 7.5% · 30yr
- Down + closing
- —
- Monthly P&I
- —
- Monthly cashflow
- —
- DSCR
- —
- Eligible?
- —
Personal DTI + credit; lowest rate.
DSCR
20% down · 8.5% · 30yr
- Down + closing
- —
- Monthly P&I
- —
- Monthly cashflow
- —
- DSCR
- —
- Eligible?
- —
No personal income docs; deal must DSCR.
Hard money
10% down · 12.0% · 12mo
- Down + closing
- —
- Monthly P&I
- —
- Monthly cashflow
- —
- DSCR
- —
- Eligible?
- —
Short-term bridge; refi at stabilization.
Rent comps 40 comps
| Address | Beds | Baths | Sqft | Rent | $/sqft | DOM | Units | Dist |
|---|---|---|---|---|---|---|---|---|
| 3601 E Wyoming Ave Spc 526 Las Vegas, NV | 3.0 | 2.0 | 1344 | $1,999 | $1.49 | 43d | 1 | 0.02mi |
| 3601 E Wyoming Ave Unit 236 Las Vegas, NV | 2.0 | 2.0 | 924 | $1,399 | $1.51 | 11d | 1 | 0.02mi |
| 3601 E Wyoming Ave Unit 46 Las Vegas, NV | 2.0 | 2.0 | 960 | $1,749 | $1.82 | 43d | 1 | 0.02mi |
| 3601 E Wyoming Ave Unit 411 Las Vegas, NV | 2.0 | 2.0 | 896 | $1,729 | $1.93 | 43d | 1 | 0.02mi |
| 3655 E Sahara Ave Las Vegas, NV | 1.0–2.0 | 1.0 | 775 | $1,260 | $1.63 | 23d | 10 | 0.39mi |
| 3669 Waikiki Ave Las Vegas, NV | 3.0 | 2.0 | 1300 | $1,568 | $1.21 | 23d | 1 | 0.40mi |
| 1150 June Ave Las Vegas, NV | 3.0 | 2.0 | 1096 | $2,800 | $2.55 | 43d | 1 | 0.40mi |
| 1755 Palm St Las Vegas, NV | 1.0–2.0 | 1.0 | 775 | $1,356 | $1.75 | 2d | 10 | 0.41mi |
| 1118 Laurel Ave Unit 1 Las Vegas, NV | 1.0 | 1.0 | 1820 | $850 | $0.47 | 23d | 1 | 0.50mi |
| 2398 Swifton Ct Las Vegas, NV | 3.0 | 2.0 | 1564 | $1,945 | $1.24 | 7d | 1 | 0.52mi |
| 2398 Swifton Ct Unit N/A Las Vegas, NV | 3.0 | 2.5 | 1564 | $1,945 | $1.24 | 7d | 1 | 0.52mi |
| 3411 Center Dr Las Vegas, NV | 2.0 | 2.0 | 1037 | $1,225 | $1.18 | 23d | 1 | 0.52mi |
| 3411 Center Dr Unit A Las Vegas, NV | 2.0 | 2.0 | 1034 | $1,225 | $1.18 | 20d | 1 | 0.52mi |
| 2627 S Lamb Blvd #81 Las Vegas, NV | 2.0 | 2.0 | 1056 | $1,939 | $1.84 | 43d | 1 | 0.68mi |
| 2627 S Lamb Blvd #233 Las Vegas, NV | 2.0 | 1.0 | 896 | $1,669 | $1.86 | 43d | 1 | 0.68mi |
| 2639 Jacyra Ave Las Vegas, NV | 3.0 | 2.5 | 1550 | $1,840 | $1.19 | 10d | 1 | 0.71mi |
| 53 Maya St Las Vegas, NV | 3.0 | 1.0 | 1018 | $1,695 | $1.67 | 43d | 1 | 0.72mi |
| 2627 S Lamb Blvd #141 Las Vegas, NV | 3.0 | 2.0 | 1344 | $1,899 | $1.41 | 43d | 1 | 0.78mi |
| 2800 Fremont St Las Vegas, NV | 2.0 | 1.0–2.0 | 771 | $1,660 | $2.15 | 3d | 11 | 1.01mi |
| 426 Greenbriar Townhouse Way Las Vegas, NV | 2.0 | 1.5 | 1320 | $1,595 | $1.21 | 43d | 1 | 1.04mi |
| 2938 E Karen Ave Unit 3 Las Vegas, NV | 2.0 | 1.5 | 1200 | $1,325 | $1.10 | 7d | 1 | 1.11mi |
| 2938 Karen Ave Unit 1 Las Vegas, NV | 3.0 | 2.0 | 1450 | $1,275 | $0.88 | 7d | 1 | 1.11mi |
| 656 Greenbriar Townhouse Way Las Vegas, NV | 2.0 | 2.5 | 1320 | $1,600 | $1.21 | 43d | 1 | 1.11mi |
| 343 Greenbriar Townhouse Way Las Vegas, NV | 1.0 | 1.5 | 1320 | $1,560 | $1.18 | 43d | 1 | 1.12mi |
| 641 E Pecos Way Unit 1 Las Vegas, NV | 2.0 | 2.5 | 1320 | $1,550 | $1.17 | 7d | 1 | 1.13mi |
| 277 N Lamb Blvd Unit C Las Vegas, NV | 2.0 | 2.0 | 978 | $1,100 | $1.12 | 1d | 1 | 1.14mi |
| 277 N Lamb Blvd Las Vegas, NV | 2.0 | 2.0 | 978 | $1,195 | $1.22 | 12d | 1 | 1.14mi |
| 210 Greenbriar Townhouse Way Las Vegas, NV | 2.0 | 2.5 | 1320 | $1,550 | $1.17 | 43d | 1 | 1.18mi |
| 4450 Karen Ave Las Vegas, NV | 2.0 | 2.0 | 975 | $1,432 | $1.47 | 7d | 11 | 1.20mi |
| 157 Pecos Way Las Vegas, NV | 2.0 | 1.5 | 1320 | $1,400 | $1.06 | 23d | 1 | 1.22mi |
| 259 N Lamb Blvd Unit A Las Vegas, NV | 2.0 | 2.0 | 984 | $1,285 | $1.31 | 7d | 1 | 1.22mi |
| 2137 E Saint Louis Ave Las Vegas, NV | 3.0 | 1.0 | 1028 | $1,700 | $1.65 | 43d | 1 | 1.22mi |
| 2898 Pacific Ave Unit N/A Las Vegas, NV | 3.0 | 2.0 | 1464 | $2,000 | $1.37 | 20d | 1 | 1.24mi |
| 4555 E Sahara Ave Las Vegas, NV | 2.0 | 2.0 | 1073 | $1,175 | $1.10 | 43d | 4 | 1.24mi |
| 4555 E Sahara Ave Las Vegas, NV | 2.0 | 2.0 | 1073 | $1,188 | $1.11 | 23d | 3 | 1.24mi |
| 76 N 27th St Unit B Las Vegas, NV | 2.0 | 2.0 | 1088 | $1,150 | $1.06 | 11d | 1 | 1.25mi |
| 4555 E Sahara Ave #284 Las Vegas, NV | 2.0 | 2.0 | 1073 | $1,250 | $1.16 | 7d | 1 | 1.25mi |
| 4417 Berkley Ave Las Vegas, NV | 3.0 | 2.0 | 1296 | $1,650 | $1.27 | 23d | 1 | 1.28mi |
| 2937 Stewart Ave Unit 1 Las Vegas, NV | 2.0 | 2.0 | 970 | $950 | $0.98 | 43d | 1 | 1.28mi |
| 4550 Karen Ave Las Vegas, NV | 2.0–3.0 | 1.0–2.0 | 988 | $1,215 | $1.23 | 14d | 11 | 1.29mi |
Listing history 12 events
-
2026-06-18days on market $75,900 Active 22 DOM
-
2026-06-17days on market $75,900 Active 21 DOM
-
2026-06-16days on market $75,900 Active 20 DOM
-
2026-06-15days on market $75,900 Active 19 DOM
-
2026-06-13days on market $75,900 Active 17 DOM
-
2026-06-09days on market $75,900 Active 13 DOM
-
2026-06-08days on market $75,900 Active 12 DOM
-
2026-06-08days on market $75,900 Active 11 DOM
-
2026-06-03days on market $75,900 Active 7 DOM
-
2026-06-02days on market $75,900 Active 6 DOM
-
2026-06-01days on market $75,900 Active 5 DOM
-
2026-05-31days on market $75,900 Active 4 DOM
ⓘ Source: listings_history table (triggers on properties + properties_extension) + one-shot
backfill from property_details.listing_events for pre-trigger history.
Climate risk First Street
- Heat 8/10 Severe
- Air quality 4/10 Moderate 4 unhealthy d/yr today · 5 by 30 yrs out
Nearby sold comps map
Loading sold comps map…
Walkable amenities ~0.75 mi
Loading nearby amenities…
Taxation est. · year 1
- Rental income
- $18,709
- − Mortgage interest
- −$4,252
- − Property taxes
- −$1,138
- − Insurance
- −$380
- − Repairs & maintenance
- −$1,497
- − Management
- −$1,497
- − Depreciation
- −$2,208
- Taxable income
- $7,738
- Est. tax owed @ 24.0%
- −$1,857
- After-tax cash flow
- $6,629/yr
For passive investors: Depreciation is non-cash, so a rental often shows a tax loss while cash-flowing — sheltering income. Rental losses are passive: they offset passive income freely, and up to $25,000/yr can offset ordinary (W-2) income if you actively participate and your MAGI is under $100k (phasing out to $0 by $150k); unused losses carry forward. On sale, claimed depreciation is recaptured at up to 25%, and gains may owe capital-gains tax (a 1031 exchange can defer both). Figures are a year-1 estimate at your 24.0% rate — not tax advice; consult a CPA.
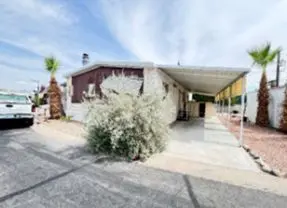
Condition & rehab AI · 3 photos
This single-section mobile home requires extensive repairs and maintenance, including major work on the siding and roof. Immediate action is needed to stabilize the property and improve its value.
Repairs flagged
- Major siding — Significant damage
- Major roof — Damaged shingles
- Major exterior walls — Weathered and damaged
Value-add opportunities
- Both repair and replace siding — Improves curb appeal and structural integrity
- Both repair and replace roof — Essential for structural integrity and water resistance
- Both paint exterior walls — Enhances curb appeal and protects against weather
Renovation cost estimate screening
| Repair item | Severity | Est. cost |
|---|---|---|
| siding · Significant damage | Major | $15,000–50,000 |
| roof · Damaged shingles | Major | $15,000–50,000 |
| exterior walls · Weathered and damaged | Major | $15,000–50,000 |
| Total estimated repair cost · 3 items | $45,000–150,000 |
Value-add ROI direction
- Both repair and replace siding — Improves curb appeal and structural integrity ↑
- Both repair and replace roof — Essential for structural integrity and water resistance ↑
- Both paint exterior walls — Enhances curb appeal and protects against weather ↑
ⓘ Cost ranges are severity-bucket heuristics (US national rule-of-thumb). Get contractor quotes + a written scope before underwriting a rehab budget.
Schools (NCES district)
- District
- Clark County School District
- NCES district ID
- 3200060
- Math proficiency
- 21% ▼ -13.00%
- Reading proficiency
- 39% ▼ -8.00%
- Median HH income
- $53,611
- Composite
- 26.48/100
- National rank
- #7211
- State rank
- #11 of 17 in NV
Livability — Sunrise Manor
- Score
- 58/100
- State rank
- #83
- US rank
- #20692
Category grades
Schools grade is shown separately in the Schools card above.
Census & demographics
- Census place
- Sunrise Manor, NV
- County
- Clark County · 2,306,105 people
- City population
- 102,557
- Metro
- Las Vegas-Henderson-Paradise, NV
- Population (ZIP)
- 39,937
- Household income
- $52,228
- Rent vs Own
- Severe rent burden
- 2715.0
Population outlook (Clark County) Hauer SSP2
- Today (2025)
- 2,504,101 people
- By 2030
- 2,693,770 · +7.6%
- By 2040
- 3,061,208 · +22.2%
- By 2050
- 3,400,072 · +35.8%
- By 2075
- 4,139,522 · +65.3%
- By 2100
- 4,596,916 · +83.6%
Race, ethnicity, and origin ACS 2023
- Neighborhood character
- Diverse neighborhood (Simpson 0.60)
- Race & ethnicity
- Hispanic / Latino 59% White 21% Two or more races 19% Black 9% Asian 5% Native American 4%
- Hispanic origin (detail)
- Mexican 45% Cuban 5%
- Common ancestry
- Lithuanian 1% Romanian 1% Slovak 1%
- Foreign-born
- 32% · Canada, South Korea, Jamaica
- Languages at home
- 45% English-only · Spanish 48% Tagalog/Filipino 3% Other Asian/Pacific 1%
Political lean MEDSL · Clark
- 2024 margin
- Toss-up / Even · D 50.4% · R 47.8% · Other 1.7%
- 2008→2024 swing
- -16.5pp toward R · 2008: 19.1pp · 2024: 2.6pp
- All cycles
- 2024: D+2.6 2020: D+9.3 2016: D+10.7 2012: D+14.5 2008: D+19.1
Not yet ingested
- Civics
- —
Market trends
- HPI YoY
- ▼ -262.16%
- Current HPI
- 305.4172
- Rent YoY
- ▲ 1.18%
- Metro
- Las Vegas-Henderson-Paradise, NV
- State GDP YoY
- ▲ 3.08%
- F500 in state
- 6
Industry mix (Fortune 500 HQ in NV)
| Industry | F500 HQs | Revenue |
|---|---|---|
| Hotels / Casinos | 3 | $36B |
|
||
Cash-flow waterfall
monthlySold comps — $/sqft
last 12 mo · ≤1 miLoading sold comps…