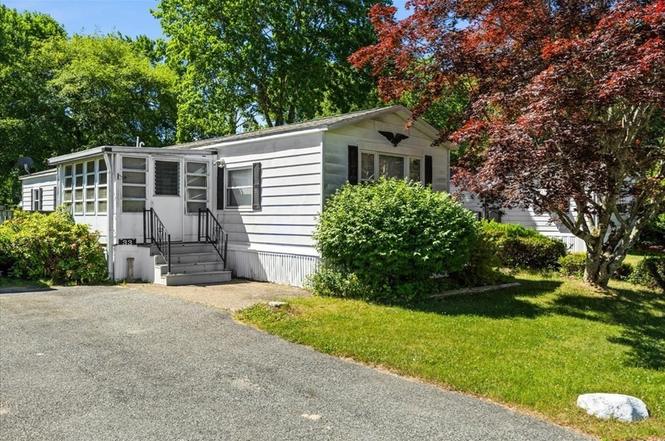
33 Thayer · Taunton, MA
Flood risk 1/10 · Minimal
- FEMA flood zone
- A
- Chance of flooding over 30 yrs
- 0.0%
- Est. flood insurance / yr
- $946 – $6,584
Fire risk 3/10 · Minor
- Est. fire insurance / yr
- $915 – $1,699
Heat risk 5/10 · Moderate
- Hot days now (above 99°F)
- 7 days/yr
- Hot days in 30 yrs
- 15 days/yr
Wind risk 6/10 · Moderate
- Chance of severe wind over 30 yrs
- 71.0%
Air-quality risk 2/10 · Minimal
- Unhealthy air days now
- 1 days/yr
- Unhealthy air days in 30 yrs
- 2 days/yr
Risk factors via First Street. Map © Google.
Why this score? — see what drove the B+ grade
The composite is a weighted blend of 9 inputs, each scored 0–100. Each bar is that input's sub-score; the figure is the points it added to the 100-point composite (weight × sub-score).
- Cash flow +30.0/30.0
- ARV discount +15.0/15.0
- 1% rule +10.0/10.0
- DSCR +10.0/10.0
- Livability +3.8/5.0
- Rent growth +3.0/5.0
- Condition / age +2.8/5.0
- Schools +2.4/10.0
- Appreciation +0.0/10.0
$119,900
🖨 Deal sheet (PDF) 📄 Offer letter ✓ Due diligence
Listing remarks
Welcome to Radante Estates, one of Taunton's premier 55+ communities! This well-maintained home offers a spacious kitchen that flows seamlessly into the living area, complete with a convenient breakfast bar/counter perfect for everyday living and entertaining. The home features two generously sized bedrooms and a full bathroom. Enjoy your morning coffee or evening relaxation in the screened porch overlooking the backyard. Additional highlights include a nice deck, storage shed, and access to community amenities including a pickleball court and active social atmosphere. Conveniently located near shopping, dining, and major routes. HOA is $688 / Month.
Key facts
- Pickleball court
- Community amenities
- Spacious kitchen
Tags
Property features AI
Finance
- Other:
- Financial info:
- HOA & community: Not a senior community
Exterior
- Parking: 2 open parking spaces (2 total parking spaces)
- Security:
- Utilities: Public water; Public sewer
- Home design: Mobile home; 875 total living area; Above-grade finished living area only
- Construction: Year built: Unknown/Mixed (year source: owner)
- Exterior features: Located in Radante Estates (use GPS for directions)
Interior
- Kitchen:
- Bedrooms:
- Flooring:
- Bathrooms: 1 full bathroom
- Heating & cooling: Forced air heating; Central air conditioning
- Interior features: Total of 6 rooms
- Laundry & utility:
Neighborhood map
What this means for you Summary
Snapshot
- This is a 2-bed/1.0-bath manufactured listed at $120k. Condition is rated average.
Deal economics
- At list price, monthly cash flow is $544 ($7k/yr) — positive.
- The deal already cash-flows at list — no discount required.
- Meets the 1% rule at list price ($2k rent vs $120k).
- Cap rate 14.9% vs local median 3.0% in Taunton — top-decile yield for the area; either an underpriced asset or a hidden risk that comps aren't pricing in. Stress-test before assuming the spread holds.
Location & tenants
- Location reads 75/100 on livability (#78 in MA, #4,184 nationally) — a middle-class / working-renter tenant base. Strengths: commute A+, housing A+, health & safety A+; Watch: schools C-, crime C-, amenities F.
- Taunton (suburban): math 19% / reading 36% proficiency, ranked #263 of 302 in MA (top 87%) — low school quality limits family demand, transient renter base, plan for 1-2y turnover.
- Market conditions: Rents rising (+2.0%/yr); 75 active listings in the ZIP; 4 comparable units currently listed for rent nearby; rentals at typical pace (median 26d on market — plan ~3-4 weeks tenant-placement turnaround); 760 units permitted in Bristol County in 2024 (142 in 5+ unit buildings).
- This rent runs 34% of the median local income ($74k/yr) — at the standard rent-burdened threshold; future hikes will face affordability resistance.
Forward outlook
- Local home prices are declining (-3.0%/yr); year-one equity from $829 of loan paydown is wiped out by about $4k of value loss. Plan a longer hold.
- Bristol County population projected to shrink 3% by 2050 — rents likely to lag national; underwrite the cash flow, not the appreciation.
- At projected returns (-3.0% appreciation + 2.0% rent growth), your $34k cash investment doubles in ~7 years — after that, you're playing with house money.
Negotiation context
- Only 7 days on market — expect competitive offers; lowballing is unlikely to land.
Risks & watch-outs
- Watch-outs: flood insurance adds $314/mo.
- Climate carrying-cost: in FEMA flood zone A (mandatory federal flood insurance); major wind risk, 71% chance of damaging wind over 30y; extreme-heat days projected 7→15/yr by 2055 (HVAC capex compounding) — expect insurance premiums to compound above CPI over the hold.
Questions for the listing agent
- Built in 1975 — when were the roof, HVAC, electrical panel, plumbing, and water heater last replaced?
- What's the actual annual flood-insurance premium (NFIP or private), and is the property in a SFHA with mandatory coverage?
- Is there a deadline driving the sale (1031 exchange, divorce, estate, relocation)? That informs how much negotiation room exists.
- What's the average days-on-market for RENTAL listings here right now (not sales)? A rising rental-DOM trend means longer vacancies and softer asking-rent achievability than the comps imply.
- What's the recent tenant-quality profile in this submarket — average credit score on applications, eviction rate, late-payment / NSF rate, and stable-employment percentage? A property-management company in the area should have these aggregated.
- How much new for-sale + rental construction is in the pipeline within 1–3 miles? Heavy new supply typically softens prices + rents 12–24 months out; constrained supply supports both.
Investment metrics
- 1% rule
- 1.78% ✓
- Cap rate
- 14.88%
- Cash-on-cash
- 30.65%
- DSCR
- 2.36
- GRM
- 4.7
CMA / ARV
- ARV (on-the-fly)
- $160,125
- Comps found
- 12
Show comp detail 12 sales within ~0.75 mi
| Address | Dist | Beds/Ba | Sqft | Sold | Price | $/sf | Match |
|---|---|---|---|---|---|---|---|
| 11 Thayer Dr | 0.11mi | 2/1.5 | 900 (+3%) | 16mo | $144,000 | $160 | 75 |
| 13 Northway | 0.11mi | 2/1.0 | 980 (+12%) | 7mo | $140,000 | $143 | 69 |
| 26 Thayer Dr | 0.06mi | 2/1.0 | 980 (+12%) | 10mo | $185,000 | $189 | 69 |
| 25 Thayer Dr | 0.04mi | 2/2.0 | 980 (+12%) | 12mo | $224,000 | $229 | 64 |
| 1 Upland Rd | 0.17mi | 2/1.0 | 980 (+12%) | 12mo | $139,900 | $143 | 62 |
| 15 Northway | 0.10mi | 2/1.5 | 980 (+12%) | 15mo | $129,000 | $132 | 61 |
| 1 Thayer | 0.22mi | 2/1.0 | 980 (+12%) | 12mo | $140,000 | $143 | 59 |
| 51 Eastbridge Rd | 0.14mi | 2/1.0 | 980 (+12%) | 17mo | $195,000 | $199 | 59 |
| 193 Tremont St #115 | 0.55mi | 2/2.0 | 950 (+9%) | 6mo | $240,000 | $253 | 51 |
| 193 Tremont St (85 Amherst Ave) #85 | 0.55mi | 2/1.0 | 1,000 (+14%) | 0mo | $140,000 | $140 | 50 |
| 14 Ipswich Dr #14 | 0.58mi | 2/1.0 | 980 (+12%) | 12mo | $179,000 | $183 | 43 |
| 193 Tremont St #88 | 0.55mi | 2/2.0 | 982 (+12%) | 16mo | $179,900 | $183 | 37 |
Match score weights: distance 35% · size 25% · config 20% · recency 20%. Top-matched comps best support the ARV.
Projected returns pro-forma
-3.0% appreciation · 2.0% rent growth · sell at horizon
- IRR
- 10.2%
- Equity multiple
- 1.40×
- Total profit
- $13,302
- Equity at exit
- $17,877
- IRR
- 18.3%
- Equity multiple
- 2.45×
- Total profit
- $48,541
- Equity at exit
- $10,367
Cash invested: $33,572 (down + closing). Projections, not guarantees.
Landlord ↔ Tenant lean methodology
- Overall (STATE)
- 20 Strongly Tenant-Friendly
- State Massachusetts
- 20 Strongly Tenant-Friendly · D+15
- County
- — inherits STATE
- City
- — inherits STATE
ZIP-level market 02780
- Home prices YoY
- -28.1%
- Rents YoY
- 2.0%
- Active inventory
- 75
- Price-to-rent
- 4.7×
Monthly cashflow live
- Estimated rent
- $2,134 medium interval (Pro) →
- Mortgage (P&I)
- −$629
- Tax est. 1.5%
- −$150 /mo · $1,798/yr
- Insurance
- −$50
- Flood insurance flood zone
- −$314 /mo · $3,765/yr
- HOA
- −$0
- Vacancy / Maint / Mgmt
- −$448
- Net cashflow
- $544
Break-even live
Sensitivity live
| Price | -10% $627 | -5% $585 | +0% $544 | +5% $502 | +10% $461 |
|---|---|---|---|---|---|
| Rent | -10% $375 | -5% $459 | +0% $544 | +5% $628 | +10% $712 |
| Rate | -1.0pp $604 | -0.5pp $574 | base $544 | +0.5pp $513 | +1.0pp $481 |
UW: 25.0% down · 7.5% · 30yr · 1.5% tax · 5.0% vac · 8.0% maint · 8.0% mgmt
Financing live
Cash to close
- Down payment
- $29,975
- Closing costs
- $3,597
- Reserves months
- —
- Total cash needed
- —
Loan-product check · same deal, 3 products live
Conventional
25% down · 7.5% · 30yr
- Down + closing
- —
- Monthly P&I
- —
- Monthly cashflow
- —
- DSCR
- —
- Eligible?
- —
Personal DTI + credit; lowest rate.
DSCR
20% down · 8.5% · 30yr
- Down + closing
- —
- Monthly P&I
- —
- Monthly cashflow
- —
- DSCR
- —
- Eligible?
- —
No personal income docs; deal must DSCR.
Hard money
10% down · 12.0% · 12mo
- Down + closing
- —
- Monthly P&I
- —
- Monthly cashflow
- —
- DSCR
- —
- Eligible?
- —
Short-term bridge; refi at stabilization.
Rent comps 4 comps
| Address | Beds | Baths | Sqft | Rent | $/sqft | DOM | Units | Dist |
|---|---|---|---|---|---|---|---|---|
| 81 Crane Ave S Unit 1 Taunton, MA | 3.0 | 1.0 | 1000 | $2,100 | $2.10 | 12d | 1 | 0.84mi |
| 750 Whittenton St #124 Taunton, MA | 1.0 | 1.0 | 820 | $2,300 | $2.80 | 3d | 1 | 1.42mi |
| 3 Barton St Taunton, MA | 2.0 | 1.0 | 800 | $2,300 | $2.88 | 25d | 1 | 1.42mi |
| 26 Kilton St Unit 2 Taunton, MA | 3.0 | 1.0 | 900 | $2,200 | $2.44 | 45d | 1 | 1.46mi |
Listing history 6 events
-
2026-06-21days on market $119,900 Active 7 DOM
-
2026-06-18statusdays on market $119,900 Active 4 DOM
-
2026-06-17days on market $119,900 New 3 DOM
-
2026-06-16days on market $119,900 New 2 DOM
-
2026-06-15remarks 658-char remark
-
2026-06-15$119,900 New 1 DOM
ⓘ Source: listings_history table (triggers on properties + properties_extension) + one-shot
backfill from property_details.listing_events for pre-trigger history.
Climate risk First Street
- Flood 1/10 Low FEMA zone A · 0% chance over 30 yrs
- Wildfire 3/10 Moderate
- Heat 5/10 Major 7 d/yr ≥99°F today · 15 d/yr by 30 yrs out
- Wind 6/10 Major 71% chance of damaging wind over 30 yrs
- Air quality 2/10 Low 1 unhealthy d/yr today · 2 by 30 yrs out
Nearby sold comps map
Loading sold comps map…
Walkable amenities ~0.75 mi
Loading nearby amenities…
Taxation est. · year 1
- Rental income
- $25,612
- − Mortgage interest
- −$6,716
- − Property taxes
- −$1,798
- − Insurance
- −$4,364
- − Repairs & maintenance
- −$2,049
- − Management
- −$2,049
- − Depreciation
- −$3,488
- Taxable income
- $5,147
- Est. tax owed @ 24.0%
- −$1,235
- After-tax cash flow
- $5,290/yr
For passive investors: Depreciation is non-cash, so a rental often shows a tax loss while cash-flowing — sheltering income. Rental losses are passive: they offset passive income freely, and up to $25,000/yr can offset ordinary (W-2) income if you actively participate and your MAGI is under $100k (phasing out to $0 by $150k); unused losses carry forward. On sale, claimed depreciation is recaptured at up to 25%, and gains may owe capital-gains tax (a 1031 exchange can defer both). Figures are a year-1 estimate at your 24.0% rate — not tax advice; consult a CPA.
Condition & rehab AI · 12 photos
This manufactured home in Radante Estates is in average condition with cosmetic updates needed to enhance its resale and rental value.
Repairs flagged
- Minor Kitchen cabinets — Dated and could be updated
- Minor Flooring — Tiled kitchen floor could be replaced
Value-add opportunities
- Both Paint interior walls — Enhances curb appeal and interior aesthetics
- Both Replace carpeting — Improves comfort and reduces maintenance
- Both Update kitchen cabinets — Modernizes the space and increases appeal
Renovation cost estimate screening
| Repair item | Severity | Est. cost |
|---|---|---|
| Kitchen cabinets · Dated and could be updated | Minor | $500–3,000 |
| Flooring · Tiled kitchen floor could be replaced | Minor | $500–3,000 |
| Total estimated repair cost · 2 items | $1,000–6,000 |
Value-add ROI direction
- Both Paint interior walls — Enhances curb appeal and interior aesthetics ↑
- Both Replace carpeting — Improves comfort and reduces maintenance ↑
- Both Update kitchen cabinets — Modernizes the space and increases appeal ↑
ⓘ Cost ranges are severity-bucket heuristics (US national rule-of-thumb). Get contractor quotes + a written scope before underwriting a rehab budget.
Schools (NCES district)
- District
- Taunton
- NCES district ID
- 2511520
- Math proficiency
- 19% ▼ -16.00%
- Reading proficiency
- 36% ▼ -2.00%
- Median HH income
- $54,102
- Composite
- 24.46/100
- National rank
- #7665
- State rank
- #263 of 302 in MA
Livability — Taunton
- Score
- 75/100
- State rank
- #78
- US rank
- #4184
Category grades
Schools grade is shown separately in the Schools card above.
Census & demographics
- Census place
- Taunton, MA
- County
- Bristol County · 342,083 people
- City population
- 53,461
- Metro
- Providence-Warwick, RI-MA
- Population (ZIP)
- 53,461
- Household income
- $74,471
- Rent vs Own
- Severe rent burden
- 2508.0
Population outlook (Bristol County) Hauer SSP2
- Today (2025)
- 570,212 people
- By 2030
- 571,181 · +0.2%
- By 2040
- 565,389 · -0.8%
- By 2050
- 552,141 · -3.2%
- By 2075
- 520,923 · -8.6%
- By 2100
- 474,363 · -16.8%
Race, ethnicity, and origin ACS 2023
- Neighborhood character
- Predominantly White (70%)
- Race & ethnicity
- White 70% Two or more races 15% Hispanic / Latino 10% Black 7% Asian 2%
- Hispanic origin (detail)
- Puerto Rican 7% Dominican 1%
- Common ancestry
- Russian 19% Lithuanian 6% Romanian 3%
- Foreign-born
- 14% · Canada, Vietnam
- Languages at home
- 78% English-only · Other Indo-European 11% Spanish 6% French/Haitian/Cajun 3%
Political lean MEDSL · Bristol
- 2024 margin
- Toss-up / Even · D 49.8% · R 48.5% · Other 1.8%
- 2008→2024 swing
- -21.9pp toward R · 2008: 23.2pp · 2024: 1.3pp
- All cycles
- 2024: D+1.3 2020: D+12.0 2016: D+9.3 2012: D+20.5 2008: D+23.2
Not yet ingested
- Civics
- —
Market trends
- HPI YoY
- ▼ -124.79%
- Current HPI
- 319.3662
- Rent YoY
- ▲ 2.00%
- Metro
- Providence-Warwick, RI-MA
- State GDP YoY
- ▲ 2.28%
- F500 in state
- 38
Industry mix (Fortune 500 HQ in MA)
| Industry | F500 HQs | Revenue |
|---|---|---|
| Technology | 3 | $17B |
|
||
| Insurance | 2 | $84B |
|
||
| Retail | 2 | $76B |
|
||
| Life Sciences | 1 | $43B |
|
||
| Energy Technology | 1 | $31B |
|
||
| Aerospace / Defense | 1 | $18B |
|
||
Price history
1 event — show timeline
- 2026-06-14 Listed $119,900 MLS PIN
Cash-flow waterfall
monthlySold comps — $/sqft
last 12 mo · ≤1 miLoading sold comps…