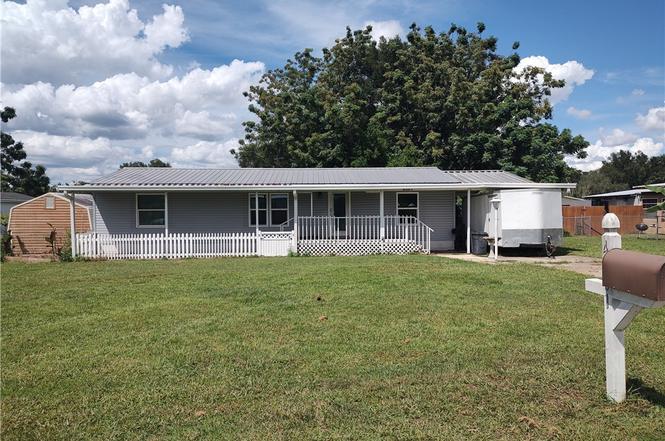
4301 E Tennessee Ln · Hernando, FL
Flood risk 1/10 · Minimal
- FEMA flood zone
- X (unshaded)
- Chance of flooding over 30 yrs
- 0.0%
- Est. flood insurance / yr
- $507 – $1,088
Fire risk 4/10 · Minor
- Est. fire insurance / yr
- $947 – $1,759
Heat risk 9/10 · Severe
- Hot days now (above 108°F)
- 7 days/yr
- Hot days in 30 yrs
- 24 days/yr
Wind risk 9/10 · Severe
- Chance of severe wind over 30 yrs
- 99.0%
Air-quality risk 1/10 · Minimal
- Unhealthy air days now
- 0 days/yr
- Unhealthy air days in 30 yrs
- 0 days/yr
Risk factors via First Street. Map © Google.
Why this score? — see what drove the B+ grade
The composite is a weighted blend of 9 inputs, each scored 0–100. Each bar is that input's sub-score; the figure is the points it added to the 100-point composite (weight × sub-score).
- Cash flow +30.0/30.0
- ARV discount +15.0/15.0
- 1% rule +10.0/10.0
- DSCR +10.0/10.0
- Schools +4.1/10.0
- Livability +3.6/5.0
- Rent growth +2.5/5.0
- Condition / age +2.5/5.0
- Appreciation +0.0/10.0
$125,000
🖨 Deal sheet (PDF) 📄 Offer letter ✓ Due diligence
Listing remarks
This is not a handyman special. This is a project looking for someone to complete it and make it their own. Lots of materials to complete the home are already on site. You can see from the photos the floor is luxury vinyl plank and there is more for installation. The major components of the home are already done and updated; windows and doors, electrical panel, a/c, hot water heater, water treatment system, new toilets, the shower is already tiled and there is new drywall ready for paint. Trees have been removed, the fence, gutters and fascia have all been repaired. Come and do some remodeling, this is an easy project to take on if you have the skills. If you don't you're at a point where h
Key facts
- Luxury vinyl plank
- Updated a/c
- 0.29 acre lot
Tags
Property features AI
Exterior
- Parking: Paved driveway; Attached carport; 1 total parking space
- Utilities: Private well water; Septic tank
- Home design: Manufactured home (double wide); Faces south; Entry level not specified
- Construction: Vinyl siding; Metal roof; Pillar/post/pier foundation; Mobile home 24' x 48'
- Exterior features: Chain link fencing; Shed(s); Cleared, level, rectangular lot; Paved road frontage on a county road
Interior
- Kitchen: Dishwasher; Electric oven; Electric range; Range hood; Refrigerator
- Flooring: Carpet
- Bathrooms: 2 full bathrooms
- Heating & cooling: Heat pump heating; Central air conditioning
- Interior features: Cathedral ceilings; Laminate countertops; Pantry; Walk-in closet(s); High-speed Internet
- Laundry & utility: Water softener (owned); Water heater
Neighborhood map
What this means for you Summary
Snapshot
- This is a 3-bed/2.0-bath manufactured listed at $125k.
Deal economics
- At list price, monthly cash flow is $834 ($10k/yr) — positive.
- The deal already cash-flows at list — no discount required.
- Meets the 1% rule at list price ($2k rent vs $125k).
- Recommended offer: $110k (12.0% below list) — sets the bar for market timing.
- Cap rate 14.3% vs local median 5.6% in Hernando — top-decile yield for the area; either an underpriced asset or a hidden risk that comps aren't pricing in. Stress-test before assuming the spread holds.
Location & tenants
- Location reads 71/100 on livability (#402 in FL) — a middle-class / working-renter tenant base. Strengths: cost of living A+, housing A+, health & safety A+; Watch: amenities F, commute F, employment D-.
- Citrus (rural): math 49% / reading 50% proficiency, ranked #44 of 73 in FL (top 60%) — families likely to look elsewhere, expect single-tenant / working-renter base with shorter leases.
- Zoned schools: Hernando Elementary School (math 47% / reading 51%, grade D, #1,134 of 2,144 statewide, top 54%, 813 students, 71% FRL); Inverness Middle School (math 52% / reading 48%, grade C, #254 of 571 statewide, top 45%, 1,017 students, 60% FRL); Citrus High School (math 34% / reading 51%, grade F, #264 of 667 statewide, top 41%, 1,503 students, 54% FRL) — zoned schools at 62% FRL track the district average.
- Market conditions: 447 active listings in the ZIP; 2 comparable units currently listed for rent nearby; 2,443 units permitted in Citrus County in 2024 (0 in 5+ unit buildings).
- This rent runs 44% of the median local income ($57k/yr) — at the standard rent-burdened threshold; future hikes will face affordability resistance.
Forward outlook
- Local home prices are declining (-3.0%/yr); year-one equity from $864 of loan paydown is wiped out by about $4k of value loss. Plan a longer hold.
- Citrus County population projected to shrink 10% by 2050 — rents likely to lag national; underwrite the cash flow, not the appreciation.
- At projected returns (-3.0% appreciation + 3.0% rent growth), your $35k cash investment doubles in ~5 years — after that, you're playing with house money.
Negotiation context
- It's been on market 278 days — a 12% lower offer ($110k) is reasonable based on typical stale-listing flexibility.
- 2 sale attempts with the ask held roughly flat each time — persistent listings suggest the price (not the market) is what's stuck; bring a comps-based counter.
- Current owner paid $90k; 39% above their basis — modest negotiation headroom, anchor on the comps not their cost.
Risks & watch-outs
- Climate carrying-cost: severe wind risk, 99% chance of damaging wind over 30y; extreme-heat days projected 7→24/yr by 2055 (HVAC capex compounding) — expect insurance premiums to compound above CPI over the hold.
Questions for the listing agent
- It's been on market 278 days. Have you received any prior offers? Is the seller open to a 12% concession, seller financing, or rate buy-down credit?
- Why hasn't it sold? Are there any deal-killer items the seller is aware of (foundation, flood, title, zoning, code violations)?
- Is there a deadline driving the sale (1031 exchange, divorce, estate, relocation)? That informs how much negotiation room exists.
- What's the average days-on-market for RENTAL listings here right now (not sales)? A rising rental-DOM trend means longer vacancies and softer asking-rent achievability than the comps imply.
- What's the recent tenant-quality profile in this submarket — average credit score on applications, eviction rate, late-payment / NSF rate, and stable-employment percentage? A property-management company in the area should have these aggregated.
- How much new for-sale + rental construction is in the pipeline within 1–3 miles? Heavy new supply typically softens prices + rents 12–24 months out; constrained supply supports both.
Investment metrics
- 1% rule
- 1.67% ✓
- Cap rate
- 14.30%
- Cash-on-cash
- 28.58%
- DSCR
- 2.27
- GRM
- 5.0
CMA / ARV
- ARV (on-the-fly)
- $160,128
- Comps found
- 6
Show comp detail 6 sales within ~0.75 mi
| Address | Dist | Beds/Ba | Sqft | Sold | Price | $/sf | Match |
|---|---|---|---|---|---|---|---|
| 4250 E Nebraska Ln | 0.10mi | 3/2.0 | 1,188 (+3%) | 8mo | $165,000 | $139 | 84 |
| 4332 E Wyoming Ln | 0.20mi | 2/2.0 (-1) | 1,136 (-1%) | 12mo | $135,000 | $119 | 73 |
| 1422 N Reed Ter | 0.32mi | 2/2.0 (-1) | 1,196 (+4%) | 1mo | $175,000 | $146 | 73 |
| 4296 E Texas St | 0.32mi | 3/2.0 | 1,296 (+12%) | 18mo | $170,000 | $131 | 50 |
| 4380 E Louisiana Ln | 0.40mi | 2/2.0 (-1) | 1,056 (-8%) | 20mo | $164,000 | $155 | 46 |
| 1571 N Little Carmen Ter | 0.29mi | 2/2.0 (-1) | 1,296 (+12%) | 22mo | $165,000 | $127 | 42 |
Match score weights: distance 35% · size 25% · config 20% · recency 20%. Top-matched comps best support the ARV.
Projected returns pro-forma
-3.0% appreciation · 3.0% rent growth · sell at horizon
- IRR
- 22.9%
- Equity multiple
- 1.94×
- Total profit
- $32,836
- Equity at exit
- $18,638
- IRR
- 30.8%
- Equity multiple
- 3.77×
- Total profit
- $96,960
- Equity at exit
- $10,808
Cash invested: $35,000 (down + closing). Projections, not guarantees.
Landlord ↔ Tenant lean methodology
- Overall (STATE)
- 87 Strongly Landlord-Friendly
- State Florida
- 87 Strongly Landlord-Friendly · R+3
- County
- — inherits STATE
- City
- — inherits STATE
ZIP-level market 34442
- Home prices YoY
- -21.9%
- Active inventory
- 447
- Price-to-rent
- 5.0×
Monthly cashflow live
- Estimated rent
- $2,085 medium interval (Pro) →
- Mortgage (P&I)
- −$656
- Tax from tax record
- −$106 /mo · $1,275/yr
- Insurance
- −$52
- HOA
- −$0
- Vacancy / Maint / Mgmt
- −$438
- Net cashflow
- $834
Break-even live
Sensitivity live
| Price | -10% $904 | -5% $869 | +0% $834 | +5% $798 | +10% $763 |
|---|---|---|---|---|---|
| Rent | -10% $669 | -5% $751 | +0% $834 | +5% $916 | +10% $998 |
| Rate | -1.0pp $897 | -0.5pp $865 | base $834 | +0.5pp $801 | +1.0pp $768 |
UW: 25.0% down · 7.5% · 30yr · 1.5% tax · 5.0% vac · 8.0% maint · 8.0% mgmt
Financing live
Cash to close
- Down payment
- $31,250
- Closing costs
- $3,750
- Reserves months
- —
- Total cash needed
- —
Loan-product check · same deal, 3 products live
Conventional
25% down · 7.5% · 30yr
- Down + closing
- —
- Monthly P&I
- —
- Monthly cashflow
- —
- DSCR
- —
- Eligible?
- —
Personal DTI + credit; lowest rate.
DSCR
20% down · 8.5% · 30yr
- Down + closing
- —
- Monthly P&I
- —
- Monthly cashflow
- —
- DSCR
- —
- Eligible?
- —
No personal income docs; deal must DSCR.
Hard money
10% down · 12.0% · 12mo
- Down + closing
- —
- Monthly P&I
- —
- Monthly cashflow
- —
- DSCR
- —
- Eligible?
- —
Short-term bridge; refi at stabilization.
Rent comps 2 comps
| Address | Beds | Baths | Sqft | Rent | $/sqft | DOM | Units | Dist |
|---|---|---|---|---|---|---|---|---|
| 815 E Rembrandt Way Unit 424 Inverness, FL | 3.0 | 2.0 | 1262 | $1,850 | $1.47 | 22d | 1 | 0.78mi |
| 543 N Rooks Ave Inverness, FL | 3.0 | 2.0 | 1296 | $1,900 | $1.47 | 22d | 1 | 1.50mi |
Listing history 22 events
-
2026-06-21days on market $125,000 Active 278 DOM
-
2026-06-19days on market $125,000 Active 276 DOM
-
2026-06-18days on market $125,000 Active 275 DOM
-
2026-06-17days on market $125,000 Active 274 DOM
-
2026-06-16days on market $125,000 Active 273 DOM
-
2026-06-15days on market $125,000 Active 272 DOM
-
2026-06-14days on market $125,000 Active 270 DOM
-
2026-06-13days on market $125,000 Active 269 DOM
-
2026-06-09days on market $125,000 Active 266 DOM
-
2026-06-08days on market $125,000 Active 265 DOM
-
2026-06-03days on market $125,000 Active 260 DOM
-
2026-06-02days on market $125,000 Active 259 DOM
-
2026-06-01days on market $125,000 Active 258 DOM
-
2026-05-31days on market $125,000 Active 257 DOM
-
2026-05-30days on market $125,000 Active 256 DOM
-
2026-05-04status Active
-
2026-05-01historical
-
2025-09-11$125,000 Active
-
2022-08-29soldstatus $90,000
-
1994-11-01soldstatus $35,000
-
1992-07-01soldstatus $7,700
-
1981-09-01soldstatus $49,000
ⓘ Source: listings_history table (triggers on properties + properties_extension) + one-shot
backfill from property_details.listing_events for pre-trigger history.
Tax reassessment forecast FL · Resets to sale price
- Current annual tax
- $1,275 · $106/mo
- Projected year-2 tax
- $1,275 · $106/mo
- Expected delta
- $0/yr ($0/mo · 0.0%)
ⓘ Screening estimate from a state-policy table — verify with the county assessor before closing.
Climate risk First Street
- Flood 1/10 Low FEMA zone X (unshaded) · 0% chance over 30 yrs
- Wildfire 4/10 Moderate
- Heat 9/10 Extreme 7 d/yr ≥108°F today · 24 d/yr by 30 yrs out
- Wind 9/10 Extreme 99% chance of damaging wind over 30 yrs
- Air quality 1/10 Low 0 unhealthy d/yr today · 0 by 30 yrs out
Nearby sold comps map
Loading sold comps map…
Walkable amenities ~0.75 mi
Loading nearby amenities…
Taxation est. · year 1
- Rental income
- $25,025
- − Mortgage interest
- −$7,002
- − Property taxes
- −$1,275
- − Insurance
- −$625
- − Repairs & maintenance
- −$2,002
- − Management
- −$2,002
- − Depreciation
- −$3,636
- Taxable income
- $8,482
- Est. tax owed @ 24.0%
- −$2,036
- After-tax cash flow
- $7,967/yr
For passive investors: Depreciation is non-cash, so a rental often shows a tax loss while cash-flowing — sheltering income. Rental losses are passive: they offset passive income freely, and up to $25,000/yr can offset ordinary (W-2) income if you actively participate and your MAGI is under $100k (phasing out to $0 by $150k); unused losses carry forward. On sale, claimed depreciation is recaptured at up to 25%, and gains may owe capital-gains tax (a 1031 exchange can defer both). Figures are a year-1 estimate at your 24.0% rate — not tax advice; consult a CPA.
Schools (NCES district)
- District
- Citrus
- NCES district ID
- 1200270
- Math proficiency
- 49% ▼ -10.00%
- Reading proficiency
- 50% ▼ -6.00%
- Median HH income
- $38,618
- Composite
- 41.28/100
- National rank
- #3519
- State rank
- #44 of 73 in FL
Livability — Hernando
- Score
- 71/100
- State rank
- #402
- US rank
- #7137
Category grades
Schools grade is shown separately in the Schools card above.
Census & demographics
- Census place
- Hernando, FL
- County
- Citrus County · 111,314 people
- City population
- 17,281
- Metro
- Homosassa Springs, FL
- Population (ZIP)
- 17,281
- Household income
- $57,259
- Rent vs Own
- Severe rent burden
- 314.0
Population outlook (Citrus County) Hauer SSP2
- Today (2025)
- 138,622 people
- By 2030
- 136,886 · -1.3%
- By 2040
- 132,009 · -4.8%
- By 2050
- 125,196 · -9.7%
- By 2075
- 108,570 · -21.7%
- By 2100
- 84,454 · -39.1%
Race, ethnicity, and origin ACS 2023
- Neighborhood character
- Predominantly White (90%)
- Race & ethnicity
- White 90% Hispanic / Latino 4% Two or more races 3% Asian 2% Black 2%
- Common ancestry
- Romanian 4% Slovak 4% Lithuanian 3%
- Foreign-born
- 8% · Canada, China, South Korea
- Languages at home
- 93% English-only · Spanish 3% German/W. Germanic 2% Tagalog/Filipino 1%
Political lean MEDSL · Citrus
- 2024 margin
- Solid R (+45.9) · D 26.8% · R 72.6%
- 2008→2024 swing
- -29.8pp toward R · 2008: -16.1pp · 2024: -45.9pp
- All cycles
- 2024: R+45.9 2020: R+41.0 2016: R+39.7 2012: R+21.9 2008: R+16.1
Not yet ingested
- Civics
- —
Market trends
- HPI YoY
- ▼ -76.70%
- Current HPI
- 273.3262
- Rent YoY
- —
- Metro
- Homosassa Springs, FL
- State GDP YoY
- ▲ 3.28%
- F500 in state
- 36
Industry mix (Fortune 500 HQ in FL)
| Industry | F500 HQs | Revenue |
|---|---|---|
| Industrial Technology | 2 | $29B |
|
||
| Insurance | 2 | $17B |
|
||
| Retail | 1 | $60B |
|
||
| Technology Distribution | 1 | $58B |
|
||
| Homebuilding | 1 | $35B |
|
||
| Technology Manufacturing | 1 | $35B |
|
||
Price history
+155.1% since first listed7 events — show timeline
- 2026-05-04 Relisted — RACC
- 2026-05-01 Delisted — RACC
- 2025-09-11 Listed $125,000 RACC
- 2022-08-29 Sold (Public Records) $90,000 Public Records
- 1994-11-01 Sold (Public Records) $35,000 Public Records
- 1992-07-01 Sold (Public Records) $7,700 Public Records
- 1981-09-01 Sold (Public Records) $49,000 Public Records
Property tax history
+6.5%/yrLatest (2025): $1,275 · -26.7% YoY. Source: county tax records.
Cash-flow waterfall
monthlySold comps — $/sqft
last 12 mo · ≤1 miLoading sold comps…