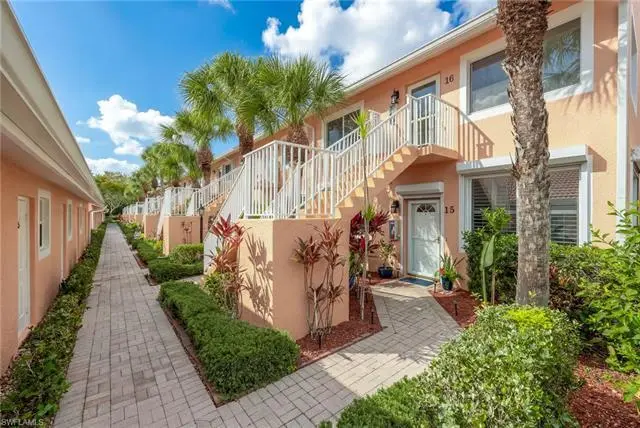
6840 Beach Resort Dr #16 · Lely Resort, FL
Flood risk 8/10 · Major
- FEMA flood zone
- AE
- Chance of flooding over 30 yrs
- 0.96%
- Est. flood insurance / yr
- $1,737 – $8,500
Fire risk 4/10 · Minor
- Est. fire insurance / yr
- $947 – $1,759
Heat risk 10/10 · Severe
- Hot days now (above 108°F)
- 7 days/yr
- Hot days in 30 yrs
- 28 days/yr
Wind risk 10/10 · Severe
- Chance of severe wind over 30 yrs
- 99.0%
Air-quality risk 2/10 · Minimal
- Unhealthy air days now
- 2 days/yr
- Unhealthy air days in 30 yrs
- 2 days/yr
Risk factors via First Street. Map © Google.
Why this score? — see what drove the C grade
The composite is a weighted blend of 9 inputs, each scored 0–100. Each bar is that input's sub-score; the figure is the points it added to the 100-point composite (weight × sub-score).
- Cash flow +18.8/30.0
- ARV discount +7.5/15.0
- 1% rule +6.5/10.0
- DSCR +5.9/10.0
- Schools +5.0/10.0
- Appreciation +4.3/10.0
- Rent growth +3.3/5.0
- Livability +3.1/5.0
- Condition / age +2.5/5.0
$399,000
🖨 Deal sheet 📄 Offer letter ✓ Due diligence
Listing remarks
This light-filled 2-bedroom, 2-bath second-floor END UNIT in sought-after Falling Waters Beach Resort offers the perfect combination of comfort, style, and easy living. Abundant natural light pours in through the additional end-unit window, enhancing the bright, open feel. The tastefully updated interior which has been recently painted is offered furnished with select designer pieces and has been meticulously maintained. The kitchen features crisp white cabinetry accented by upper and lower cabinet lighting, creating a clean and inviting space. One of the standout features is the expansive enclosed lanai offering over 300 square feet of additional living space—ideal for year-round enj
Key facts
- Water views
- Telescoping sliders
- Lap pool
Tags
Property features AI
Finance
- Financial info: Total annual recurring HOA fees approximately $7,900; One-time fees approximately $150
- HOA & community: Quarterly condo fee; Condo fee covers cable, insurance, internet/Wi-Fi, irrigation water, lawn/land maintenance, pest control (interior and exterior), recreation facilities, reserves, sewer, street lights, street maintenance, trash removal and water; Professional management; Gated community amenities include clubhouse, community pool, bike and jog path, bocce court, pickleball, and shuffleboard
Exterior
- Parking: Detached 1-car garage
- Security: Gated community; Security system
- Utilities: Central water; Central sewer; Cable available
- Home design: Residential property; Low-rise (1-3) building; 2-story end unit; Rear exposure faces north; Built in 2002; Located in Falling Waters Beach Resort
- Construction: Concrete block construction; Tile roof; Single-hung windows; Foundation information not provided
- Exterior features: Lake view; Lakefront; Central irrigation; Zero lot line; Shutters (electric); Stucco exterior
Interior
- Kitchen: Self-cleaning oven; Microwave; Garbage disposal; Refrigerator/freezer with icemaker; Eat-in kitchen
- Bedrooms: 2 bedrooms
- Flooring: Carpet; Tile
- Bathrooms: 2 full bathrooms; Master bath with dual sinks and a shower-only stall
- Heating & cooling: Central electric heat; Central electric air conditioning; Ceiling fans
- Interior features: Cable prewire; Laundry tub; Smoke detectors; Vaulted ceiling; Walk-in closet; Window coverings; Split bedroom floor plan; Furnished
- Laundry & utility: Washer and dryer included; Washer/dryer hookup; Auto garage door opener
Neighborhood map
What this means for you Summary
Snapshot
- This is a 2-bed/2.0-bath condo listed at $399k.
Deal economics
- At list price, monthly cash flow is $-22 ($-261/yr) — negative.
- To cash-flow at today's rent, offer at most $395k (1.0% below list).
- Meets the 1% rule at list price ($5k rent vs $399k).
- Recommended offer: $363k (9.0% below list) — sets the bar for market timing.
Location & tenants
- Location reads 61/100 on livability (#786 in FL) — a middle-class / working-renter tenant base. Strengths: crime A+, employment A-; Watch: health & safety D, schools F, amenities F.
- Collier (suburban): math 60% / reading 56% proficiency, ranked #16 of 73 in FL (top 22%) — acceptable for families but not a draw, mixed tenant base, ~2y average lease.
- Market conditions: Rents rising (+3.2%/yr); 900 active listings in the ZIP; 40 comparable units currently listed for rent nearby; rentals at typical pace (median 24d on market — plan ~3-4 weeks tenant-placement turnaround); solid renter incomes; 3,520 units permitted in Collier County in 2024 (959 in 5+ unit buildings).
- At $4,571/mo this rent would consume 61% of the median local household income ($89k/yr) (locally 550% of renters already pay >50% of income on rent) — very limited rent-growth headroom before tenants either downsize or default.
Forward outlook
- Local home prices are declining (-1.5%/yr); year-one equity from $3k of loan paydown is wiped out by about $6k of value loss. Plan a longer hold.
- Collier County population projected at +30% by 2050 — long-run rental-demand tailwind backs the buy-and-hold thesis.
Negotiation context
- It's been on market 91 days — a 9% lower offer ($363k) is reasonable based on typical stale-listing flexibility.
Risks & watch-outs
- Watch-outs: flood insurance adds $427/mo.
- Climate carrying-cost: in FEMA flood zone AE (mandatory federal flood insurance); severe wind risk, 99% chance of damaging wind over 30y; extreme-heat days projected 7→28/yr by 2055 (HVAC capex compounding) — expect insurance premiums to compound above CPI over the hold.
Questions for the listing agent
- What do current leases actually rent for vs. the listed asking? Can we see a recent rent roll and the last 12 months of T-12 income?
- It's been on market 91 days. Have you received any prior offers? Is the seller open to a 9% concession, seller financing, or rate buy-down credit?
- What's the actual annual flood-insurance premium (NFIP or private), and is the property in a SFHA with mandatory coverage?
- What does the HOA fee cover, when was the last increase, and are there any pending special assessments or reserve-fund shortfalls?
- Any open or pending special assessments — roof, HVAC, plumbing, elevator, façade? What's the per-unit balance and payoff schedule, and is the seller paying it off at close or rolling it to the buyer?
- Why hasn't it sold? Are there any deal-killer items the seller is aware of (foundation, flood, title, zoning, code violations)?
- Is there a deadline driving the sale (1031 exchange, divorce, estate, relocation)? That informs how much negotiation room exists.
- Schools are F-rated, which usually means shorter tenancies and higher turnover. Who's the typical renter profile here, and what's been the actual vacancy rate?
- What's the average days-on-market for RENTAL listings here right now (not sales)? A rising rental-DOM trend means longer vacancies and softer asking-rent achievability than the comps imply.
- What's the recent tenant-quality profile in this submarket — average credit score on applications, eviction rate, late-payment / NSF rate, and stable-employment percentage? A property-management company in the area should have these aggregated.
- How much new apartment / multifamily construction is in the pipeline within 1–3 miles? Heavy new supply (>2% of stock underway) typically softens rents 12–24 months out; light construction supports rent growth.
Investment metrics
- 1% rule
- 1.15% ✓
- Cap rate
- 7.51%
- Cash-on-cash
- 4.35%
- DSCR
- 1.19
- GRM
- 7.3
CMA / ARV
No comps found within radius.
Projected returns pro-forma
-1.48% appreciation · 3.21% rent growth · sell at horizon
- IRR
- -8.2%
- Equity multiple
- 0.66×
- Total profit
- $-38,432
- Equity at exit
- $87,187
- IRR
- -0.5%
- Equity multiple
- 0.96×
- Total profit
- $-4,946
- Equity at exit
- $83,985
Cash invested: $111,720 (down + closing). Projections, not guarantees.
Landlord ↔ Tenant lean methodology
- Overall (STATE)
- 87 Strongly Landlord-Friendly
- State Florida
- 87 Strongly Landlord-Friendly · R+3
- County
- — inherits STATE
- City
- — inherits STATE
ZIP-level market 34114
- Home prices YoY
- -0.6%
- Rents YoY
- 3.2%
- Active inventory
- 900
- Price-to-rent
- 7.3×
Monthly cashflow live
- Estimated rent
- $4,571 high interval (Pro) →
- Mortgage (P&I)
- −$2,092
- Tax from tax record
- −$290 /mo · $3,475/yr
- Insurance
- −$166
- Flood insurance flood zone
- −$427 /mo · $5,118/yr
- HOA
- −$658
- Vacancy / Maint / Mgmt
- −$960
- Net cashflow
- $-22
Break-even live
UW: 25.0% down · 7.5% · 30yr · 1.5% tax · 5.0% vac · 8.0% maint · 8.0% mgmt
Financing live
Cash to close
- Down payment
- $99,750
- Closing costs
- $11,970
- Reserves months
- —
- Total cash needed
- —
Loan-product check · same deal, 3 products live
Conventional
25% down · 7.5% · 30yr
- Down + closing
- —
- Monthly P&I
- —
- Monthly cashflow
- —
- DSCR
- —
- Eligible?
- —
Personal DTI + credit; lowest rate.
DSCR
20% down · 8.5% · 30yr
- Down + closing
- —
- Monthly P&I
- —
- Monthly cashflow
- —
- DSCR
- —
- Eligible?
- —
No personal income docs; deal must DSCR.
Hard money
10% down · 12.0% · 12mo
- Down + closing
- —
- Monthly P&I
- —
- Monthly cashflow
- —
- DSCR
- —
- Eligible?
- —
Short-term bridge; refi at stabilization.
Rent comps 40 comps
| Address | Beds | Baths | Sqft | Rent | $/sqft | DOM | Units | Dist |
|---|---|---|---|---|---|---|---|---|
| 6590 Beach Resort Dr Unit 305 Naples, FL | 2.0 | 2.0 | 1351 | $4,500 | $3.33 | 14d | 1 | 0.13mi |
| 6650 Beach Resort Dr Unit 908 Naples, FL | 2.0 | 2.0 | 1351 | $4,600 | $3.40 | 14d | 1 | 0.33mi |
| 6750 Beach Resort Dr #7 Naples, FL | 2.0 | 2.0 | 1351 | $3,900 | $2.89 | 23d | 1 | 0.38mi |
| 6750 Beach Resort Dr Naples, FL | 2.0 | 2.0 | 1351 | $3,200 | $2.37 | 14d | 2 | 0.38mi |
| 9175 Celeste Dr Unit 105 Naples, FL | 2.0 | 2.0 | 1000 | $2,000 | $2.00 | 23d | 1 | 0.38mi |
| 9187 Celeste Dr Unit 1073494P Naples, FL | 2.0 | 2.0 | 1399 | $2,979 | $2.13 | 14d | 1 | 0.39mi |
| 9165 Celeste Dr Unit 3-303 Naples, FL | 2.0 | 2.0 | 1000 | $6,500 | $6.50 | 23d | 1 | 0.44mi |
| 9159 Delano St #9905 Naples, FL | 3.0 | 2.0 | 1770 | $4,995 | $2.82 | 23d | 1 | 0.48mi |
| 6680 Beach Resort Dr Unit 1214 Naples, FL | 2.0 | 2.0 | 1351 | $4,500 | $3.33 | 14d | 1 | 0.48mi |
| 9155 Delano St Unit 1545913P Naples, FL | 3.0 | 2.0 | 1797 | $3,871 | $2.15 | 14d | 1 | 0.49mi |
| 9151 Delano St #9702 Naples, FL | 3.0 | 2.5 | 1733 | $2,650 | $1.53 | 14d | 1 | 0.51mi |
| 22 Cypress View Dr Unit B22 Naples, FL | 2.0 | 2.0 | 1534 | $7,000 | $4.56 | 23d | 1 | 0.54mi |
| 9118 Chula Vista St #12002 Naples, FL | 2.0 | 2.5 | 1531 | $4,200 | $2.74 | 23d | 1 | 0.61mi |
| 9111 Capistrano St S #8303 Naples, FL | 2.0 | 2.5 | 1432 | $7,500 | $5.24 | 23d | 1 | 0.65mi |
| 9115 Capistrano St S #8207 Naples, FL | 2.0 | 2.5 | 1494 | $6,000 | $4.02 | 23d | 1 | 0.65mi |
| 9102 Chula Vista St #11302 Naples, FL | 2.0 | 2.5 | 1531 | $2,695 | $1.76 | 21d | 1 | 0.68mi |
| 9109 Yuba Ln Unit 80 Naples, FL | 3.0 | 2.5 | 1729 | $3,900 | $2.26 | 23d | 1 | 0.69mi |
| 7052 Live Oak Dr Naples, FL | 2.0 | 2.0 | 1685 | $9,000 | $5.34 | 23d | 1 | 0.69mi |
| 9092 Chula Vista St #11003 Naples, FL | 2.0 | 2.0 | 1404 | $6,850 | $4.88 | 23d | 1 | 0.71mi |
| 9088 Chula Vista St Unit 108-3 Naples, FL | 2.0 | 2.0 | 1404 | $5,700 | $4.06 | 23d | 1 | 0.73mi |
| 9102 Capistrano St S Unit 72-3 Naples, FL | 2.0 | 2.5 | 1520 | $6,500 | $4.28 | 23d | 1 | 0.73mi |
| 8540 Mystic Greens Way #305 Naples, FL | 2.0 | 2.0 | 1710 | $4,995 | $2.92 | 14d | 1 | 0.74mi |
| 9081 Albion Ln S #6505 Naples, FL | 2.0 | 2.0 | 1225 | $7,500 | $6.12 | 23d | 1 | 0.78mi |
| 9072 Rialto St #6302 Naples, FL | 3.0 | 2.0 | 1771 | $8,250 | $4.66 | 21d | 1 | 0.80mi |
| 9076 Rialto St Unit 62 Naples, FL | 3.0 | 2.5 | 1624 | $7,500 | $4.62 | 23d | 1 | 0.81mi |
| 9175 Michael Cir #4 Naples, FL | 3.0 | 2.0 | 1639 | $3,195 | $1.95 | 14d | 1 | 0.81mi |
| 9073 Rialto St #6002 Naples, FL | 3.0 | 2.0 | 1771 | $7,500 | $4.23 | 23d | 1 | 0.84mi |
| 9022 Michael Cir Unit 2-205 Naples, FL | 2.0 | 2.0 | 1450 | $3,500 | $2.41 | 23d | 1 | 0.84mi |
| 9071 Albion Ln N #5706 Naples, FL | 2.0 | 2.5 | 1441 | $2,200 | $1.53 | 23d | 1 | 0.84mi |
| 9066 Albion Ln N #5106 Naples, FL | 3.0 | 2.5 | 1715 | $6,500 | $3.79 | 21d | 1 | 0.85mi |
| 9082 Capistrano St N Unit 48-5 Naples, FL | 2.0 | 2.0 | 1227 | $6,500 | $5.30 | 23d | 1 | 0.88mi |
| 8965 Malibu Ln #802 Naples, FL | 3.0 | 2.0 | 1771 | $6,595 | $3.72 | 23d | 1 | 0.88mi |
| 8519 Chase Preserve Dr Naples, FL | 2.0 | 2.0 | 1827 | $9,000 | $4.93 | 23d | 1 | 0.97mi |
| 9054 Capistrano St N #4003 Naples, FL | 2.0 | 2.0 | 1385 | $2,495 | $1.80 | 23d | 1 | 0.97mi |
| 9054 Capistrano St N #4002 Naples, FL | 3.0 | 2.0 | 1674 | $6,000 | $3.58 | 23d | 1 | 0.97mi |
| 1747 Beverly Dr Naples, FL | 2.0 | 2.0 | 1080 | $2,300 | $2.13 | 23d | 1 | 0.99mi |
| 274 Riverwood Rd Unit 1546056P Naples, FL | 2.0 | 2.0 | 1496 | $4,451 | $2.98 | 14d | 1 | 1.00mi |
| 8175 Celeste Dr Naples, FL | 2.0 | 2.0 | 1460 | $2,395 | $1.64 | 23d | 1 | 1.05mi |
| 8175 Celeste Dr #1230 Naples, FL | 2.0 | 2.0 | 1476 | $2,775 | $1.88 | 23d | 1 | 1.05mi |
| 8175 Celeste Dr #1229 Naples, FL | 3.0 | 2.0 | 1640 | $2,975 | $1.81 | 23d | 1 | 1.05mi |
HOA detail condo
- Monthly dues
- $658 · $7,896/yr
- Likely covers
- water
- Assessments
- None detected in remarks — confirm with the listing agent.
Listing history 12 events
-
2026-06-18days on market $399,000 Active 91 DOM
-
2026-06-17days on market $399,000 Active 90 DOM
-
2026-06-16days on market $399,000 Active 89 DOM
-
2026-06-15days on market $399,000 Active 88 DOM
-
2026-06-14days on market $399,000 Active 86 DOM
-
2026-06-10days on market $399,000 Active 83 DOM
-
2026-06-09days on market $399,000 Active 82 DOM
-
2026-06-08days on market $399,000 Active 81 DOM
-
2026-06-07days on market $399,000 Active 80 DOM
-
2026-06-03days on market $399,000 Active 76 DOM
-
2026-06-03remarks 693-char remark
-
2026-06-03$399,000 Active 75 DOM
ⓘ Source: listings_history table (triggers on properties + properties_extension) + one-shot
backfill from property_details.listing_events for pre-trigger history.
Tax reassessment forecast FL · Resets to sale price
- Current annual tax
- $3,475 · $290/mo
- Projected year-2 tax
- $3,475 · $290/mo
- Expected delta
- $0/yr ($0/mo · 0.0%)
ⓘ Screening estimate from a state-policy table — verify with the county assessor before closing.
Climate risk First Street
- Flood 8/10 Severe FEMA zone AE · 96% chance over 30 yrs
- Wildfire 4/10 Moderate
- Heat 10/10 Extreme 7 d/yr ≥108°F today · 28 d/yr by 30 yrs out
- Wind 10/10 Extreme 99% chance of damaging wind over 30 yrs
- Air quality 2/10 Low 2 unhealthy d/yr today · 2 by 30 yrs out
Nearby sold comps map
Loading sold comps map…
Walkable amenities ~0.75 mi
Loading nearby amenities…
Taxation est. · year 1
- Rental income
- $54,851
- − Mortgage interest
- −$22,350
- − Property taxes
- −$3,475
- − Insurance
- −$7,114
- − Repairs & maintenance
- −$4,388
- − Management
- −$4,388
- − HOA
- −$7,896
- − Depreciation
- −$11,607
- Taxable loss
- −$6,367
- Est. tax savings @ 24.0%
- +$1,528
- After-tax cash flow
- $1,267/yr
For passive investors: Depreciation is non-cash, so a rental often shows a tax loss while cash-flowing — sheltering income. Rental losses are passive: they offset passive income freely, and up to $25,000/yr can offset ordinary (W-2) income if you actively participate and your MAGI is under $100k (phasing out to $0 by $150k); unused losses carry forward. On sale, claimed depreciation is recaptured at up to 25%, and gains may owe capital-gains tax (a 1031 exchange can defer both). Figures are a year-1 estimate at your 24.0% rate — not tax advice; consult a CPA.
Schools (NCES district)
- District
- Collier
- NCES district ID
- 1200330
- Math proficiency
- 60% ▼ -4.00%
- Reading proficiency
- 56% ▼ -2.00%
- Median HH income
- $58,275
- Composite
- 50.23/100
- National rank
- #1892
- State rank
- #16 of 73 in FL
Livability — Lely Resort
- Score
- 61/100
- State rank
- #786
- US rank
- #17981
Category grades
Schools grade is shown separately in the Schools card above.
Census & demographics
- County
- Collier County · 396,295 people
- Metro
- Naples-Marco Island, FL
- Population (ZIP)
- 23,559
- Household income
- $89,334
- Rent vs Own
- Severe rent burden
- 550.0
Population outlook (Collier County) Hauer SSP2
- Today (2025)
- 420,858 people
- By 2030
- 450,054 · +6.9%
- By 2040
- 502,232 · +19.3%
- By 2050
- 544,932 · +29.5%
- By 2075
- 627,203 · +49.0%
- By 2100
- 659,015 · +56.6%
Race, ethnicity, and origin ACS 2023
- Neighborhood character
- Predominantly White (72%)
- Race & ethnicity
- White 72% Hispanic / Latino 17% Two or more races 13% Black 7%
- Hispanic origin (detail)
- Mexican 7% Puerto Rican 1% Cuban 3%
- Common ancestry
- Hispanic 5% Romanian 4% Lithuanian 1%
- Foreign-born
- 21% · Canada, Jamaica
- Languages at home
- 75% English-only · Spanish 15% French/Haitian/Cajun 5% Other Indo-European 4%
Political lean MEDSL · Collier
- 2024 margin
- Solid R (+33.1) · D 33.1% · R 66.2%
- 2008→2024 swing
- -10.6pp toward R · 2008: -22.5pp · 2024: -33.1pp
- All cycles
- 2024: R+33.1 2020: R+24.7 2016: R+26.0 2012: R+30.1 2008: R+22.5
Not yet ingested
- Civics
- —
Market trends
- HPI YoY
- ▼ -1.48%
- Current HPI
- 266.5545
- Rent YoY
- ▲ 3.21%
- Metro
- Naples-Marco Island, FL
- State GDP YoY
- ▲ 3.28%
- F500 in state
- 36
Industry mix (Fortune 500 HQ in FL)
| Industry | F500 HQs | Revenue |
|---|---|---|
| Industrial Technology | 2 | $29B |
|
||
| Insurance | 2 | $17B |
|
||
| Retail | 1 | $60B |
|
||
| Technology Distribution | 1 | $58B |
|
||
| Homebuilding | 1 | $35B |
|
||
| Technology Manufacturing | 1 | $35B |
|
||
Price history
+6.4% since first listed2 events — show timeline
- 2026-03-19 Listed $399,000 NAPLESMLS
- 2021-12-28 Sold (Public Records) $375,000 Public Records
Property tax history
+11.2%/yrLatest (2025): $3,475 · -1.2% YoY. Source: county tax records.
Cash-flow waterfall
monthlySold comps — $/sqft
last 12 mo · ≤1 miLoading sold comps…