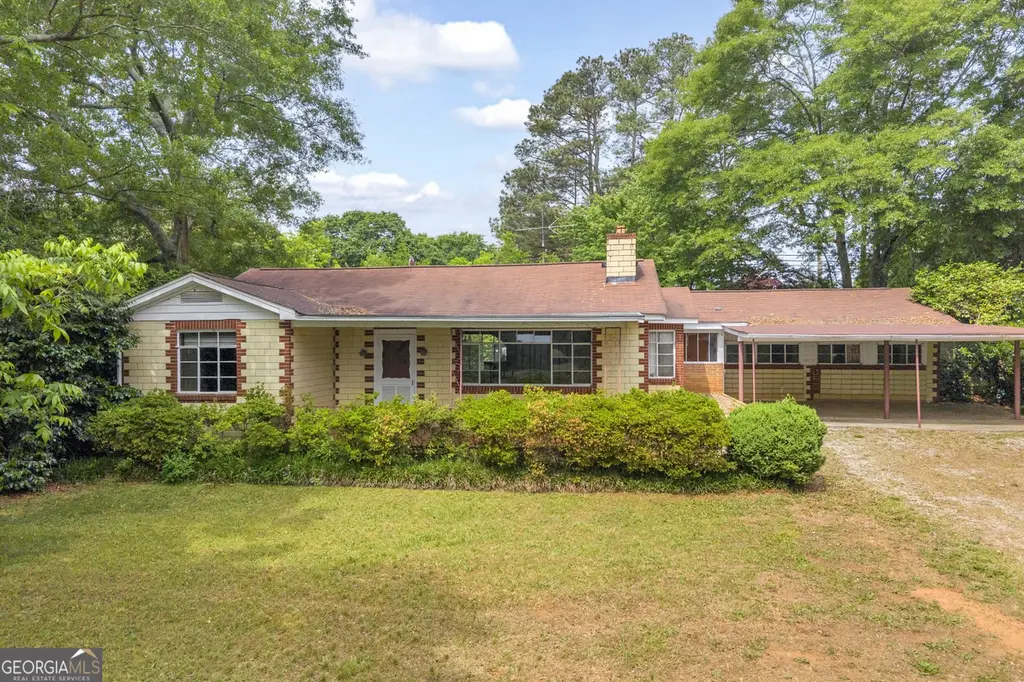
1751 Bowersville St · Royston, GA
Flood risk 1/10 · Minimal
- FEMA flood zone
- X (unshaded)
- Chance of flooding over 30 yrs
- 0.0%
- Est. flood insurance / yr
- $507 – $1,088
Fire risk 4/10 · Minor
- Est. fire insurance / yr
- $963 – $1,789
Heat risk 5/10 · Moderate
- Hot days now (above 105°F)
- 7 days/yr
- Hot days in 30 yrs
- 17 days/yr
Wind risk 4/10 · Minor
- Chance of severe wind over 30 yrs
- 12.0%
Air-quality risk 3/10 · Minor
- Unhealthy air days now
- 2 days/yr
- Unhealthy air days in 30 yrs
- 4 days/yr
Risk factors via First Street. Map © Google.
Why this score? — see what drove the A- grade
The composite is a weighted blend of 9 inputs, each scored 0–100. Each bar is that input's sub-score; the figure is the points it added to the 100-point composite (weight × sub-score).
- Cash flow +28.5/30.0
- ARV discount +15.0/15.0
- DSCR +10.0/10.0
- Appreciation +10.0/10.0
- 1% rule +7.2/10.0
- Schools +3.0/10.0
- Livability +2.9/5.0
- Rent growth +2.5/5.0
- Condition / age +2.5/5.0
$110,000
🖨 Deal sheet 📄 Offer letter ✓ Due diligence
Listing remarks
Charming 3-bedroom, 2.5-bath home located within the city limits of Royston and full of potential! SOLD AS IS. With a little TLC this home could be your primary residence or a great investment opportunity. This property offers a welcoming front porch that's perfect for rocking chairs and relaxing evenings. Surrounded by mature shade trees, the yard provides a peaceful setting with plenty of character. Inside, you'll find a spacious layout ready for your personal touch and updates. Out back, the detached shop offers excellent space for storage, hobbies, or a workshop. Whether you're looking for a primary residence, investment opportunity, or a home to make your own, this property has endless
Key facts
- Front porch
- In-town location
- Detached shop
Tags
Property features AI
Finance
- Other: Property located at 1751 Bowersville St, Royston, GA 30662
- Financial info: Listing terms: Cash
- HOA & community: No homeowners association
Exterior
- Parking: Attached carport
- Utilities: Public water; Public sewer; Electricity available; Natural gas available; Sewer connected; Water available
- Home design: Single-family residence; House structure type; Resale property; Built in 1949; One story
- Construction: Brick construction; Block foundation; Composition roof
- Exterior features: City lot; Level lot
Interior
- Kitchen: No specific kitchen appliance list provided
- Bedrooms: 3 bedrooms (all on the main level)
- Flooring: Carpet; Hardwood; Other
- Bathrooms: 2 full bathrooms and 1 half bathroom
- Heating & cooling: Central heating; Central air conditioning; Ceiling fans
- Interior features: One level layout; Family room; Dining room is a separate room; Laundry area in a laundry closet; One fireplace
- Laundry & utility: Laundry located in a closet
Neighborhood map
What this means for you Summary
Snapshot
- This is a 3-bed/2.0-bath single-family listed at $110k.
Deal economics
- At list price, monthly cash flow is $361 ($4k/yr) — positive.
- The deal already cash-flows at list — no discount required.
- Meets the 1% rule at list price ($1k rent vs $110k).
- Recommended offer: $107k (3.0% below list) — sets the bar for market timing.
- Cap rate 10.2% vs local median 4.0% in Royston — top-decile yield for the area; either an underpriced asset or a hidden risk that comps aren't pricing in. Stress-test before assuming the spread holds.
Location & tenants
- Location reads 58/100 on livability (#421 in GA) — a working-class tenant base; expect higher turnover. Strengths: cost of living A+, housing A, crime B+; Watch: amenities F, commute F, employment F.
- Franklin County (rural): math 38% / reading 35% proficiency, ranked #61 of 174 in GA (top 35%) — families likely to look elsewhere, expect single-tenant / working-renter base with shorter leases.
- Zoned schools: Franklin County Middle School (math 32% / reading 35%, grade F, #206 of 470 statewide, top 45%, 826 students, 60% FRL).
- Market conditions: 95 active listings in the ZIP; 3 comparable units currently listed for rent nearby; rentals leasing fast (median 13d on market — plan ~1-2 weeks tenant-placement turnaround); 163 units permitted in Franklin County in 2024 (0 in 5+ unit buildings).
- This rent runs 30% of the median local income ($53k/yr) — at the standard rent-burdened threshold; future hikes will face affordability resistance.
Forward outlook
- In year one you build about $12k of equity ($761 loan paydown + $11k appreciation (10.0% local appreciation)).
- At projected returns (10.0% appreciation + 3.0% rent growth), your $31k cash investment doubles in ~2 years — after that, you're playing with house money.
- By year 4, paydown + projected appreciation supports a ~$42k cash-out refi (75% LTV) — recoverable capital for the next deal without selling this one.
Negotiation context
- It's been on market 41 days — a 3% lower offer ($107k) is reasonable based on typical stale-listing flexibility.
Risks & watch-outs
- Watch-outs: built in 1949 — expect roof / HVAC / electrical / plumbing capex.
- Climate carrying-cost: extreme-heat days projected 7→17/yr by 2055 (HVAC capex compounding) — expect insurance premiums to compound above CPI over the hold.
Questions for the listing agent
- It's been on market 41 days. Have you received any prior offers? Is the seller open to a 3% concession, seller financing, or rate buy-down credit?
- Built in 1949 — when were the roof, HVAC, electrical panel, plumbing, and water heater last replaced?
- Is there a deadline driving the sale (1031 exchange, divorce, estate, relocation)? That informs how much negotiation room exists.
- Schools are F-rated, which usually means shorter tenancies and higher turnover. Who's the typical renter profile here, and what's been the actual vacancy rate?
- What's the average days-on-market for RENTAL listings here right now (not sales)? A rising rental-DOM trend means longer vacancies and softer asking-rent achievability than the comps imply.
- What's the recent tenant-quality profile in this submarket — average credit score on applications, eviction rate, late-payment / NSF rate, and stable-employment percentage? A property-management company in the area should have these aggregated.
- How much new for-sale + rental construction is in the pipeline within 1–3 miles? Heavy new supply typically softens prices + rents 12–24 months out; constrained supply supports both.
Investment metrics
- 1% rule
- 1.22% ✓
- Cap rate
- 10.23%
- Cash-on-cash
- 14.06%
- DSCR
- 1.63
- GRM
- 6.8
CMA / ARV
- ARV (median comp)
- $155,718
- List price
- $110,000
- Delta
- -29.36%
- Verdict
- UNDERPRICED
- Comps
- 20 within 1.0 mi
Show comp detail 3 sales within ~0.75 mi
| Address | Dist | Beds/Ba | Sqft | Sold | Price | $/sf | Match |
|---|---|---|---|---|---|---|---|
| 160 Jordan St | 0.61mi | 3/1.0 | 1,000 (+1%) | 12mo | $189,000 | $189 | 56 |
| 190 Jordan St | 0.61mi | 3/1.0 | 960 (-3%) | 8mo | $180,000 | $188 | 55 |
| 49 Carroll St | 0.58mi | 2/1.0 (-1) | 905 (-9%) | 18mo | $128,000 | $141 | 34 |
Match score weights: distance 35% · size 25% · config 20% · recency 20%. Top-matched comps best support the ARV.
Projected returns pro-forma
10.0% appreciation · 3.0% rent growth · sell at horizon
- IRR
- 34.6%
- Equity multiple
- 3.69×
- Total profit
- $82,884
- Equity at exit
- $99,097
- IRR
- 29.8%
- Equity multiple
- 8.34×
- Total profit
- $225,965
- Equity at exit
- $213,706
Cash invested: $30,800 (down + closing). Projections, not guarantees.
Landlord ↔ Tenant lean methodology
- Overall (STATE)
- 90 Strongly Landlord-Friendly
- State Georgia
- 90 Strongly Landlord-Friendly · R+3
- County
- — inherits STATE
- City
- — inherits STATE
ZIP-level market 30662
- Home prices YoY
- 17.9%
- Active inventory
- 95
- Price-to-rent
- 6.8×
Monthly cashflow live
- Estimated rent
- $1,342 medium interval (Pro) →
- Mortgage (P&I)
- −$577
- Tax from tax record
- −$77 /mo · $922/yr
- Insurance
- −$46
- HOA
- −$0
- Vacancy / Maint / Mgmt
- −$282
- Net cashflow
- $361
Break-even live
UW: 25.0% down · 7.5% · 30yr · 1.5% tax · 5.0% vac · 8.0% maint · 8.0% mgmt
Financing live
Cash to close
- Down payment
- $27,500
- Closing costs
- $3,300
- Reserves months
- —
- Total cash needed
- —
Loan-product check · same deal, 3 products live
Conventional
25% down · 7.5% · 30yr
- Down + closing
- —
- Monthly P&I
- —
- Monthly cashflow
- —
- DSCR
- —
- Eligible?
- —
Personal DTI + credit; lowest rate.
DSCR
20% down · 8.5% · 30yr
- Down + closing
- —
- Monthly P&I
- —
- Monthly cashflow
- —
- DSCR
- —
- Eligible?
- —
No personal income docs; deal must DSCR.
Hard money
10% down · 12.0% · 12mo
- Down + closing
- —
- Monthly P&I
- —
- Monthly cashflow
- —
- DSCR
- —
- Eligible?
- —
Short-term bridge; refi at stabilization.
Rent comps 3 comps
| Address | Beds | Baths | Sqft | Rent | $/sqft | DOM | Units | Dist |
|---|---|---|---|---|---|---|---|---|
| 137 Carlton St Unit 145 Royston, GA | 2.0 | 1.5 | 1000 | $1,200 | $1.20 | 13d | 1 | 0.49mi |
| 189 Mason St Unit 3 Royston, GA | 2.0 | 2.0 | 726 | $1,175 | $1.62 | 43d | 1 | 0.53mi |
| 57 Shady Cir Royston, GA | 2.0 | 2.0 | 820 | $1,195 | $1.46 | 13d | 1 | 1.11mi |
Listing history 17 events
-
2026-06-19days on market $110,000 Active 41 DOM
-
2026-06-18days on market $110,000 Active 40 DOM
-
2026-06-17days on market $110,000 Active 39 DOM
-
2026-06-16days on market $110,000 Active 38 DOM
-
2026-06-15days on market $110,000 Active 37 DOM
-
2026-06-14days on market $110,000 Active 35 DOM
-
2026-06-12days on market $110,000 Active 34 DOM
-
2026-06-09days on market $110,000 Active 31 DOM
-
2026-06-08days on market $110,000 Active 30 DOM
-
2026-06-07days on market $110,000 Active 29 DOM
-
2026-06-07days on market $110,000 Active 28 DOM
-
2026-06-03days on market $110,000 Active 25 DOM
-
2026-06-02days on market $110,000 Active 24 DOM
-
2026-06-01days on market $110,000 Active 23 DOM
-
2026-05-31days on market $110,000 Active 22 DOM
-
2026-05-31days on market $110,000 Active 21 DOM
-
2026-04-15$110,000 New 874-char remark
ⓘ Source: listings_history table (triggers on properties + properties_extension) + one-shot
backfill from property_details.listing_events for pre-trigger history.
Tax reassessment forecast GA · Resets to sale price
- Current annual tax
- $922 · $77/mo
- Projected year-2 tax
- $1,012 · $84/mo
- Expected delta
- +$90/yr (+$8/mo · 9.8%)
ⓘ Screening estimate from a state-policy table — verify with the county assessor before closing.
Climate risk First Street
- Flood 1/10 Low FEMA zone X (unshaded) · 0% chance over 30 yrs
- Wildfire 4/10 Moderate
- Heat 5/10 Major 7 d/yr ≥105°F today · 17 d/yr by 30 yrs out
- Wind 4/10 Moderate 12% chance of damaging wind over 30 yrs
- Air quality 3/10 Moderate 2 unhealthy d/yr today · 4 by 30 yrs out
Nearby sold comps map
Loading sold comps map…
Walkable amenities ~0.75 mi
Loading nearby amenities…
Taxation est. · year 1
- Rental income
- $16,109
- − Mortgage interest
- −$6,162
- − Property taxes
- −$922
- − Insurance
- −$550
- − Repairs & maintenance
- −$1,289
- − Management
- −$1,289
- − Depreciation
- −$3,200
- Taxable income
- $2,698
- Est. tax owed @ 24.0%
- −$647
- After-tax cash flow
- $3,684/yr
For passive investors: Depreciation is non-cash, so a rental often shows a tax loss while cash-flowing — sheltering income. Rental losses are passive: they offset passive income freely, and up to $25,000/yr can offset ordinary (W-2) income if you actively participate and your MAGI is under $100k (phasing out to $0 by $150k); unused losses carry forward. On sale, claimed depreciation is recaptured at up to 25%, and gains may owe capital-gains tax (a 1031 exchange can defer both). Figures are a year-1 estimate at your 24.0% rate — not tax advice; consult a CPA.
Schools (NCES district)
- District
- Franklin County
- NCES district ID
- 1302250
- Math proficiency
- 38% ▼ -1.00%
- Reading proficiency
- 35% ▼ -3.00%
- Median HH income
- $35,985
- Composite
- 30.28/100
- National rank
- #6281
- State rank
- #61 of 174 in GA
Livability — Royston
- Score
- 58/100
- State rank
- #421
- US rank
- #20753
Category grades
Schools grade is shown separately in the Schools card above.
Census & demographics
- Census place
- Royston, GA
- County
- Franklin County · 7,950 people
- City population
- 7,950
- Metro
- Athens-Clarke County, GA
- Population (ZIP)
- 7,950
- Household income
- $53,487
- Rent vs Own
- Severe rent burden
- 72.0
Population outlook (Franklin County) Hauer SSP2
- Today (2025)
- 22,625 people
- By 2030
- 22,725 · +0.4%
- By 2040
- 22,806 · +0.8%
- By 2050
- 22,713 · +0.4%
- By 2075
- 22,514 · -0.5%
- By 2100
- 20,768 · -8.2%
Race, ethnicity, and origin ACS 2023
- Neighborhood character
- Predominantly White (77%)
- Race & ethnicity
- White 77% Black 11% Two or more races 5% Hispanic / Latino 4% Asian 4%
- Common ancestry
- Slovak 2% Romanian 1% Lithuanian 1%
- Foreign-born
- 6% · Vietnam, Canada
- Languages at home
- 91% English-only · Vietnamese 4% Spanish 3% German/W. Germanic 1%
Political lean MEDSL · Franklin
- 2024 margin
- Solid R (+72.6) · D 13.6% · R 86.2%
- 2008→2024 swing
- -21.1pp toward R · 2008: -51.5pp · 2024: -72.6pp
- All cycles
- 2024: R+72.6 2020: R+69.5 2016: R+68.6 2012: R+59.5 2008: R+51.5
Not yet ingested
- Civics
- —
Market trends
- HPI YoY
- ▲ 62.43%
- Current HPI
- 410.693
- Rent YoY
- —
- Metro
- Athens-Clarke County, GA
- State GDP YoY
- ▲ 2.66%
- F500 in state
- 28
Industry mix (Fortune 500 HQ in GA)
| Industry | F500 HQs | Revenue |
|---|---|---|
| Paper / Packaging | 2 | $29B |
|
||
| Retail | 1 | $160B |
|
||
| Transportation / Logistics | 1 | $91B |
|
||
| Airlines | 1 | $62B |
|
||
| Consumer Goods | 1 | $47B |
|
||
| Utilities | 1 | $25B |
|
||
Price history
1 event — show timeline
- 2026-04-15 Listed $110,000 GAMLS
Property tax history
+10.8%/yrLatest (2025): $922 · +12.3% YoY. Source: county tax records.
Cash-flow waterfall
monthlySold comps — $/sqft
last 12 mo · ≤1 miLoading sold comps…