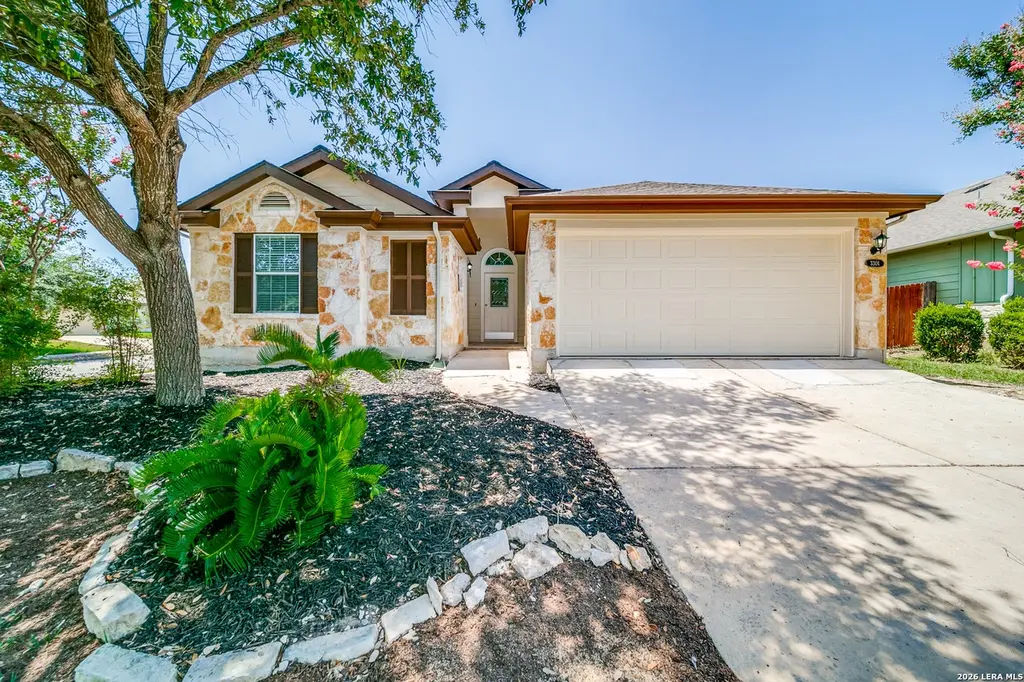
3301 Orth · Schertz, TX
Flood risk 1/10 · Minimal
- FEMA flood zone
- X (unshaded)
- Chance of flooding over 30 yrs
- 0.0%
- Est. flood insurance / yr
- $507 – $1,088
Fire risk 5/10 · Moderate
- Est. fire insurance / yr
- $1,222 – $2,270
Heat risk 8/10 · Major
- Hot days now (above 107°F)
- 7 days/yr
- Hot days in 30 yrs
- 23 days/yr
Wind risk 8/10 · Major
- Chance of severe wind over 30 yrs
- 80.0%
Air-quality risk 1/10 · Minimal
- Unhealthy air days now
- 0 days/yr
- Unhealthy air days in 30 yrs
- 0 days/yr
Risk factors via First Street. Map © Google.
Why this score? — see what drove the D grade
The composite is a weighted blend of 9 inputs, each scored 0–100. Each bar is that input's sub-score; the figure is the points it added to the 100-point composite (weight × sub-score).
- Cash flow +9.4/30.0
- ARV discount +8.9/15.0
- Appreciation +5.2/10.0
- Schools +4.4/10.0
- Livability +3.7/5.0
- 1% rule +3.2/10.0
- Rent growth +3.1/5.0
- DSCR +2.6/10.0
- Condition / age +2.5/5.0
$255,000
🖨 Deal sheet 📄 Offer letter ✓ Due diligence
Listing remarks
Beautiful one story former model home on corner lot in Whisper Meadows! Well maintained and freshly painted! Several upgrades including new luxury vinyl flooring throughout, appliances including washer/dryer/refrigerator/water softener/filter drinking system. New roof, new gutter system. The master suite provides a separate shower, garden tub, and double vanities. Work from home in the connecting study room/office space! Open floor plan and covered patio allows for entertaining! Great location for easy access to IH 35 or FM 78. Growing community close to new shops and upcoming projects.
Key facts
- Separate shower
- New gutter system
- Corner lot
Tags
Property features AI
Finance
- Other: Possession at closing/funding
- Financial info: Down payment assistance resources available; Lease currently in place through March 31, 2026 (if applicable)
- HOA & community: Voluntary HOA
Exterior
- Parking: 2-car garage
- Security: Pre-wired for security; Smoke alarm
- Utilities: Water system; Electric service; Electric water heater
- Home design: Pre-owned single-family home; Approximate age: 18 years; Open floor plan
- Construction: Slab foundation; Composition roof
- Exterior features: Stone/rock and siding exterior; Ground-level/no steps; Subdivision: WHISPERING MEADOWS
Interior
- Kitchen: Eat-in kitchen (23 x 9); Cooktop; Self-cleaning oven; Microwave oven; Range/stove; Refrigerator; Dishwasher; Garbage disposal; Breakfast bar
- Bedrooms: Master bedroom on lower level (16 x 13); Bedroom 2 (11 x 10); Bedroom 3 (12 x 10); All bedrooms located downstairs
- Flooring: Ceramic tile flooring; Vinyl flooring
- Bathrooms: 2 full bathrooms; Master bath with separate tub and shower, double vanity and garden tub (11 x 9)
- Heating & cooling: Central heating (electric); Central air conditioning
- Interior features: Ceiling fans; Washer and dryer included; Washer and dryer connections; Cooktop, Self-cleaning oven, Microwave, Stove/Range; Refrigerator, Dishwasher, Disposal; Owned water softener; Smoke alarm; Pre-wired for security; Electric water heater; Garage door opener; Living/Dining room combination; Eat-in kitchen with breakfast bar and breakfast area; Open floor plan; Utility room inside; Laundry room on main/lower level; Ground level / no steps; Cable TV available; High-speed internet available; Walk-in closets; Attic with pull-down stairs and storage
- Laundry & utility: Washer and dryer included; Washer and dryer connections; Laundry room on main/lower level; Utility room inside
Neighborhood map
What this means for you Summary
Snapshot
- This is a 3-bed/2.0-bath single-family listed at $255k.
Deal economics
- At list price, monthly cash flow is $-181 ($-2k/yr) — negative.
- To cash-flow at today's rent, offer at most $223k (12.6% below list).
- To meet the 1% rule (rent ≥ 1% of price), the offer needs to be $209k (18.0% below list).
- Recommended offer: $209k (18.0% below list) — sets the bar for 1% rule.
- Cap rate 5.4% vs local median 2.8% in Schertz — top-decile yield for the area; either an underpriced asset or a hidden risk that comps aren't pricing in. Stress-test before assuming the spread holds.
Location & tenants
- Location reads 73/100 on livability (#198 in TX) — a middle-class / working-renter tenant base. Strengths: employment A+, housing A+, crime A; Watch: health & safety D+, amenities F, commute F.
- Schertz-Cibolo-U City ISD (suburban): math 49% / reading 48% proficiency, ranked #152 of 826 in TX (top 18%) — families likely to look elsewhere, expect single-tenant / working-renter base with shorter leases.
- Zoned schools: John A Sippel El (math 40% / reading 41%, grade F, #1,490 of 4,322 statewide, top 35%, 743 students, 35% FRL); Byron P Steele Ii H S (math 68% / reading 66%, grade B, #163 of 1,632 statewide, top 11%, 2,716 students, 25% FRL) — zoned schools at 30% FRL track the district average.
- Market conditions: Rents rising (+2.4%/yr); 739 active listings in the ZIP; 13 comparable units currently listed for rent nearby; rentals at typical pace (median 24d on market — plan ~3-4 weeks tenant-placement turnaround); high-income renter base; 2,064 units permitted in Guadalupe County in 2024 (133 in 5+ unit buildings).
Forward outlook
- In year one you build about $3k of equity ($2k loan paydown + $1k appreciation (0.5% local appreciation)).
- Guadalupe County population projected at +61% by 2050 — long-run rental-demand tailwind backs the buy-and-hold thesis.
- By year 9, paydown + projected appreciation supports a ~$30k cash-out refi (75% LTV) — recoverable capital for the next deal without selling this one.
Negotiation context
- It's been on market 89 days — a 6% lower offer ($240k) is reasonable based on typical stale-listing flexibility.
- 3 sale attempts since 3y ago with the ask held roughly flat each time — persistent listings suggest the price (not the market) is what's stuck; bring a comps-based counter.
Risks & watch-outs
- Climate carrying-cost: severe wind risk, 80% chance of damaging wind over 30y; moderate wildfire risk; extreme-heat days projected 7→23/yr by 2055 (HVAC capex compounding) — expect insurance premiums to compound above CPI over the hold.
Questions for the listing agent
- What do current leases actually rent for vs. the listed asking? Can we see a recent rent roll and the last 12 months of T-12 income?
- It's been on market 89 days. Have you received any prior offers? Is the seller open to a 18% concession, seller financing, or rate buy-down credit?
- Why hasn't it sold? Are there any deal-killer items the seller is aware of (foundation, flood, title, zoning, code violations)?
- Is there a deadline driving the sale (1031 exchange, divorce, estate, relocation)? That informs how much negotiation room exists.
- The area grade is low — what's the realistic commute time and amenity access for the typical tenant pool here? Any planned neighborhood developments (good or bad) we should know about?
- What's the average days-on-market for RENTAL listings here right now (not sales)? A rising rental-DOM trend means longer vacancies and softer asking-rent achievability than the comps imply.
- What's the recent tenant-quality profile in this submarket — average credit score on applications, eviction rate, late-payment / NSF rate, and stable-employment percentage? A property-management company in the area should have these aggregated.
- How much new for-sale + rental construction is in the pipeline within 1–3 miles? Heavy new supply typically softens prices + rents 12–24 months out; constrained supply supports both.
Investment metrics
- 1% rule
- 0.82% ✗
- Cap rate
- 5.44%
- Cash-on-cash
- -3.05%
- DSCR
- 0.86
- GRM
- 10.2
CMA / ARV
- ARV (on-the-fly)
- $262,986
- Comps found
- 12
Show comp detail 12 sales within ~0.75 mi
| Address | Dist | Beds/Ba | Sqft | Sold | Price | $/sf | Match |
|---|---|---|---|---|---|---|---|
| 3529 Cliffside | 0.45mi | 3/2.0 | 1,648 (-0%) | 2mo | $224,500 | $136 | 77 |
| 3422 Morning Dr | 0.43mi | 3/2.0 | 1,631 (-1%) | 3mo | $175,000 | $107 | 75 |
| 3302 Whisper Blf | 0.12mi | 3/2.0 | 1,419 (-14%) | 4mo | $267,400 | $188 | 67 |
| 5724 Columbia | 0.58mi | 3/2.0 | 1,596 (-4%) | 4mo | $245,000 | $154 | 64 |
| 4905 Tiffany | 0.55mi | 3/2.0 | 1,564 (-5%) | 4mo | $239,999 | $153 | 62 |
| 5010 Crestwood Dr | 0.65mi | 4/2.0 (+1) | 1,707 (+3%) | 1mo | $275,000 | $161 | 58 |
| 5725 Maxfli Dr | 0.57mi | 3/2.0 | 1,510 (-9%) | 0mo | $209,000 | $138 | 58 |
| 6017 Scenic Links | 0.58mi | 3/2.0 | 1,510 (-9%) | 2mo | $244,000 | $162 | 57 |
| 6226 Fred Couples | 0.74mi | 3/2.0 | 1,591 (-4%) | 4mo | $265,000 | $167 | 56 |
| 4910 Cherry Tree | 0.57mi | 3/2.0 | 1,474 (-11%) | 2mo | $234,900 | $159 | 54 |
| 5457 Storm King | 0.75mi | 3/2.0 | 1,745 (+6%) | 5mo | $263,900 | $151 | 52 |
| 5752 Ping Way | 0.60mi | 4/2.0 (+1) | 1,496 (-10%) | 4mo | $249,500 | $167 | 48 |
Match score weights: distance 35% · size 25% · config 20% · recency 20%. Top-matched comps best support the ARV.
Projected returns pro-forma
0.47% appreciation · 2.42% rent growth · sell at horizon
- IRR
- -4.2%
- Equity multiple
- 0.80×
- Total profit
- $-14,459
- Equity at exit
- $80,098
- IRR
- 1.0%
- Equity multiple
- 1.11×
- Total profit
- $7,933
- Equity at exit
- $101,257
Cash invested: $71,400 (down + closing). Projections, not guarantees.
Landlord ↔ Tenant lean methodology
- Overall (STATE)
- 87 Strongly Landlord-Friendly
- State Texas
- 87 Strongly Landlord-Friendly · R+5
- County
- — inherits STATE
- City
- — inherits STATE
ZIP-level market 78108
- Home prices YoY
- 0.3%
- Rents YoY
- 2.4%
- Active inventory
- 739
- Price-to-rent
- 10.2×
Monthly cashflow live
- Estimated rent
- $2,090 high interval (Pro) →
- Mortgage (P&I)
- −$1,337
- Tax from tax record
- −$389 /mo · $4,669/yr
- Insurance
- −$106
- HOA
- −$0
- Vacancy / Maint / Mgmt
- −$439
- Net cashflow
- $-181
Break-even live
UW: 25.0% down · 7.5% · 30yr · 1.5% tax · 5.0% vac · 8.0% maint · 8.0% mgmt
Financing live
Cash to close
- Down payment
- $63,750
- Closing costs
- $7,650
- Reserves months
- —
- Total cash needed
- —
Loan-product check · same deal, 3 products live
Conventional
25% down · 7.5% · 30yr
- Down + closing
- —
- Monthly P&I
- —
- Monthly cashflow
- —
- DSCR
- —
- Eligible?
- —
Personal DTI + credit; lowest rate.
DSCR
20% down · 8.5% · 30yr
- Down + closing
- —
- Monthly P&I
- —
- Monthly cashflow
- —
- DSCR
- —
- Eligible?
- —
No personal income docs; deal must DSCR.
Hard money
10% down · 12.0% · 12mo
- Down + closing
- —
- Monthly P&I
- —
- Monthly cashflow
- —
- DSCR
- —
- Eligible?
- —
Short-term bridge; refi at stabilization.
Rent comps 13 comps
| Address | Beds | Baths | Sqft | Rent | $/sqft | DOM | Units | Dist |
|---|---|---|---|---|---|---|---|---|
| 3301 Orth Ave Schertz, TX | 3.0 | 2.0 | 1654 | $2,200 | $1.33 | 2d | 1 | 0.03mi |
| 5745 Maxfli Dr Schertz, TX | 3.0 | 2.0 | 1214 | $1,600 | $1.32 | 17d | 1 | 0.54mi |
| 4909 Tiffany Ln Schertz, TX | 3.0 | 2.0 | 1434 | $1,629 | $1.14 | 23d | 1 | 0.58mi |
| 3406 Sherwin Dr Schertz, TX | 3.0 | 2.5 | 1819 | $1,950 | $1.07 | 23d | 1 | 0.71mi |
| 229 Holland Park Schertz, TX | 4.0 | 2.0 | 1724 | $2,075 | $1.20 | 3d | 1 | 0.83mi |
| 325 Cortijo Cibolo, TX | 4.0 | 2.0 | 2080 | $2,350 | $1.13 | 4d | 1 | 0.89mi |
| 5248 Columbia Dr Cibolo, TX | 3.0 | 2.0 | 1745 | $1,800 | $1.03 | 23d | 1 | 0.94mi |
| 2272 Monument Hl , TX | 4.0 | 3.0 | 2210 | $2,400 | $1.09 | 17d | 1 | 0.95mi |
| 5244 Brookline Schertz, TX | 3.0 | 2.0 | 1758 | $1,750 | $1.00 | 23d | 1 | 1.00mi |
| 420 Cactus Flower Cibolo, TX | 3.0 | 2.0 | 1774 | $1,900 | $1.07 | 14d | 1 | 1.09mi |
| 308 Rustic Trl Cibolo, TX | 3.0 | 2.0 | 1863 | $1,895 | $1.02 | 23d | 1 | 1.36mi |
| 201 Gatewood Fls Cibolo, TX | 4.0 | 2.5 | 2245 | $1,949 | $0.87 | 23d | 1 | 1.44mi |
| 428 Kings Way Cibolo, TX | 4.0 | 2.0 | 1730 | $2,099 | $1.21 | 23d | 1 | 1.46mi |
Listing history 19 events
-
2026-06-17days on market $255,000 Active 89 DOM
-
2026-06-16days on market $255,000 Active 88 DOM
-
2026-06-13days on market $255,000 Active 85 DOM
-
2026-06-13days on market $255,000 Active 84 DOM
-
2026-06-09days on market $255,000 Active 81 DOM
-
2026-06-08days on market $255,000 Active 80 DOM
-
2026-06-07statusdays on market $255,000 Active 79 DOM
-
2026-06-04days on market $255,000 Price Change 76 DOM
-
2026-06-03days on market $255,000 Price Change 75 DOM
-
2026-06-02days on market $255,000 Price Change 74 DOM
-
2026-06-01days on market $255,000 Price Change 73 DOM
-
2026-05-31days on market $255,000 Price Change 72 DOM
-
2026-05-06price $260,000
-
2026-03-21historical $2,200
-
2026-03-20$265,000 New
-
2026-03-17$2,200
-
2023-08-19historical $2,050
-
2023-08-16$2,050
-
2023-07-18historical
ⓘ Source: listings_history table (triggers on properties + properties_extension) + one-shot
backfill from property_details.listing_events for pre-trigger history.
Tax reassessment forecast TX · Resets to sale price
- Current annual tax
- $4,669 · $389/mo
- Projected year-2 tax
- $4,669 · $389/mo
- Expected delta
- $0/yr ($0/mo · 0.0%)
ⓘ Screening estimate from a state-policy table — verify with the county assessor before closing.
Climate risk First Street
- Flood 1/10 Low FEMA zone X (unshaded) · 0% chance over 30 yrs
- Wildfire 5/10 Major
- Heat 8/10 Severe 7 d/yr ≥107°F today · 23 d/yr by 30 yrs out
- Wind 8/10 Severe 80% chance of damaging wind over 30 yrs
- Air quality 1/10 Low 0 unhealthy d/yr today · 0 by 30 yrs out
Nearby sold comps map
Loading sold comps map…
Walkable amenities ~0.75 mi
Loading nearby amenities…
Taxation est. · year 1
- Rental income
- $25,082
- − Mortgage interest
- −$14,284
- − Property taxes
- −$4,669
- − Insurance
- −$1,275
- − Repairs & maintenance
- −$2,007
- − Management
- −$2,007
- − Depreciation
- −$7,418
- Taxable loss
- −$6,578
- Est. tax savings @ 24.0%
- +$1,579
- After-tax cash flow
- $-598/yr
For passive investors: Depreciation is non-cash, so a rental often shows a tax loss while cash-flowing — sheltering income. Rental losses are passive: they offset passive income freely, and up to $25,000/yr can offset ordinary (W-2) income if you actively participate and your MAGI is under $100k (phasing out to $0 by $150k); unused losses carry forward. On sale, claimed depreciation is recaptured at up to 25%, and gains may owe capital-gains tax (a 1031 exchange can defer both). Figures are a year-1 estimate at your 24.0% rate — not tax advice; consult a CPA.
Schools (NCES district)
- District
- Schertz-Cibolo-U City ISD
- NCES district ID
- 4839480
- Math proficiency
- 49% ▼ -12.00%
- Reading proficiency
- 48% ▼ -4.00%
- Median HH income
- $75,790
- Composite
- 44.02/100
- National rank
- #2886
- State rank
- #152 of 826 in TX
Livability — Schertz
- Score
- 73/100
- State rank
- #198
- US rank
- #5013
Category grades
Schools grade is shown separately in the Schools card above.
Census & demographics
- Census place
- Schertz, TX
- County
- Guadalupe County · 147,291 people
- City population
- 41,907
- Metro
- San Antonio-New Braunfels, TX
- Population (ZIP)
- 49,784
- Household income
- $113,004
- Rent vs Own
- Severe rent burden
- 521.0
Population outlook (Guadalupe County) Hauer SSP2
- Today (2025)
- 196,854 people
- By 2030
- 220,210 · +11.9%
- By 2040
- 268,004 · +36.1%
- By 2050
- 316,333 · +60.7%
- By 2075
- 434,747 · +120.8%
- By 2100
- 520,447 · +164.4%
Race, ethnicity, and origin ACS 2023
- Neighborhood character
- Diverse neighborhood (Simpson 0.68)
- Race & ethnicity
- White 46% Hispanic / Latino 30% Two or more races 22% Black 13% Asian 3%
- Hispanic origin (detail)
- Mexican 22% Puerto Rican 4%
- Common ancestry
- Italian 2% Lithuanian 2% Slovak 2%
- Foreign-born
- 7% · Canada, Vietnam, China
- Languages at home
- 83% English-only · Spanish 13% Vietnamese 1% German/W. Germanic 1%
Political lean MEDSL · Guadalupe
- 2024 margin
- Strong R (+29.5) · D 34.8% · R 64.3%
- 2008→2024 swing
- +1.5pp toward D · 2008: -31.0pp · 2024: -29.5pp
- All cycles
- 2024: R+29.5 2020: R+24.2 2016: R+31.8 2012: R+35.1 2008: R+31.0
Not yet ingested
- Civics
- —
Market trends
- HPI YoY
- ▲ 0.47%
- Current HPI
- 182.7296
- Rent YoY
- ▲ 2.42%
- Metro
- San Antonio-New Braunfels, TX
- State GDP YoY
- ▲ 3.95%
- F500 in state
- 110
Industry mix (Fortune 500 HQ in TX)
| Industry | F500 HQs | Revenue |
|---|---|---|
| Energy | 16 | $1,198B |
|
||
| Technology | 5 | $198B |
|
||
| Engineering / Construction | 4 | $72B |
|
||
| Energy Services | 3 | $60B |
|
||
| Utilities | 3 | $41B |
|
||
| Healthcare | 2 | $330B |
|
||
Price history
+12582.9% since first listed7 events — show timeline
- 2026-05-06 Price Changed $260,000 LERA
- 2026-03-21 Rental Removed $2,200 SABOR
- 2026-03-20 Listed $265,000 LERA
- 2026-03-17 Listed for Rent $2,200 SABOR
- 2023-08-19 Rental Removed $2,050 SABOR
- 2023-08-16 Listed for Rent $2,050 SABOR
- 2023-07-18 Rental Removed — SABOR
Property tax history
+1.6%/yrLatest (2026): $4,669 · +2.7% YoY. Source: county tax records.
Cash-flow waterfall
monthlySold comps — $/sqft
last 12 mo · ≤1 miLoading sold comps…