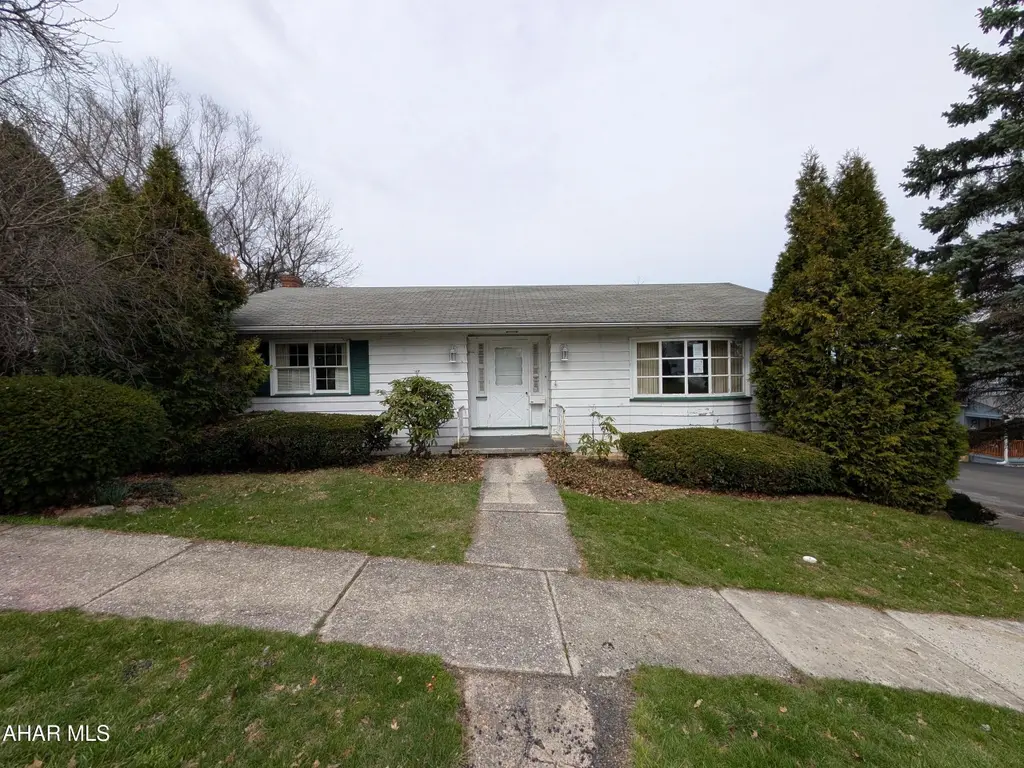
2400 Crawford Ave · Altoona, PA
Flood risk 1/10 · Minimal
- FEMA flood zone
- X (unshaded)
- Chance of flooding over 30 yrs
- 0.0%
- Est. flood insurance / yr
- $507 – $1,088
Fire risk 1/10 · Minimal
- Est. fire insurance / yr
- $511 – $949
Heat risk 3/10 · Minor
- Hot days now (above 95°F)
- 7 days/yr
- Hot days in 30 yrs
- 17 days/yr
Wind risk 2/10 · Minimal
- Chance of severe wind over 30 yrs
- —
Air-quality risk 2/10 · Minimal
- Unhealthy air days now
- 1 days/yr
- Unhealthy air days in 30 yrs
- 3 days/yr
Risk factors via First Street. Map © Google.
Why this score? — see what drove the B- grade
The composite is a weighted blend of 9 inputs, each scored 0–100. Each bar is that input's sub-score; the figure is the points it added to the 100-point composite (weight × sub-score).
- Cash flow +25.9/30.0
- ARV discount +15.0/15.0
- DSCR +8.7/10.0
- 1% rule +6.8/10.0
- Livability +4.0/5.0
- Schools +3.1/10.0
- Rent growth +2.5/5.0
- Condition / age +2.2/5.0
- Appreciation +0.0/10.0
$87,000
🖨 Deal sheet 📄 Offer letter ✓ Due diligence
Listing remarks
Altoona area 1 story home is perfect for investors or handy persons! Large formal living room, formal dining room, eat-in kitchen plus two bedrooms and bath. Hardwood floors, rear deck, 1 car integral garage, 1/2 bath in basement and plenty of opportunity to imagine all the possibilties! Property sold AS-IS. Seller will make no repairs. Offers must be submitted through HUD approved broker. Buyer pays both transfer taxes. Exclusive Agency. Equal Housing Opportunity. www. HUDHomestore.com. Property was built pre-1978 - requiring LBP disclosures. Subject to Appraisal - If the purchaser is utilizing FHA financing the purchaser's appraisal will determine final insurability and escrow holdback am
Key facts
- 5,227 sq ft lot
- Garage
- Built 1951
Property features AI
Exterior
- Parking: 1-car garage
- Utilities: Public water
- Home design: Single-family residence; One level
- Construction: Wood siding; Shingle roof
- Exterior features: Deck
Interior
- Flooring: Hardwood; Vinyl; Wood; Carpet
- Bathrooms: 1 full bathroom
- Heating & cooling: Forced air heating (natural gas); Cooling
- Interior features: Eat-in kitchen; Basement
Neighborhood map
What this means for you Summary
Snapshot
- This is a 2-bed/1.0-bath single-family listed at $87k. Condition is rated fair.
Deal economics
- At list price, monthly cash flow is $213 ($3k/yr) — positive.
- The deal already cash-flows at list — no discount required.
- Meets the 1% rule at list price ($1k rent vs $87k).
- Cap rate 9.2% vs local median 5.8% in Altoona — top-decile yield for the area; either an underpriced asset or a hidden risk that comps aren't pricing in. Stress-test before assuming the spread holds.
Location & tenants
- Location reads 79/100 on livability (#237 in PA, #2,060 nationally) — a middle-class / working-renter tenant base. Strengths: commute A+, cost of living A+, housing A+; Watch: crime C-, employment D, amenities F.
- Altoona Area SD (urban): math 30% / reading 44% proficiency, ranked #406 of 539 in PA (top 75%) — families likely to look elsewhere, expect single-tenant / working-renter base with shorter leases.
- Market conditions: 151 active listings in the ZIP; 5 comparable units currently listed for rent nearby; rentals lingering (median 44d on market — plan ~5-8 weeks vacancy on turnover, expect pricing pressure); 100% of comp listings sitting > 30 days — soft ceiling on asking rent; 99 units permitted in Blair County in 2024 (0 in 5+ unit buildings).
Forward outlook
- Local home prices are declining (-3.0%/yr); year-one equity from $601 of loan paydown is wiped out by about $3k of value loss. Plan a longer hold.
- Blair County population projected at -18% by 2050 — secular population decline; favor cash flow + early exit over multi-decade hold.
Negotiation context
- Only 14 days on market — expect competitive offers; lowballing is unlikely to land.
Risks & watch-outs
- Watch-outs: built in 1951 — expect roof / HVAC / electrical / plumbing capex.
Questions for the listing agent
- Have any recent inspections been done? Can we get a copy of the seller's disclosures and any deferred-maintenance estimates?
- Built in 1951 — when were the roof, HVAC, electrical panel, plumbing, and water heater last replaced?
- Is there a deadline driving the sale (1031 exchange, divorce, estate, relocation)? That informs how much negotiation room exists.
- Schools are B-rated — typically a magnet for longer-tenancy family renters. What's the average tenant stay here, and is there a school-zone premium baked into asking?
- What's the average days-on-market for RENTAL listings here right now (not sales)? A rising rental-DOM trend means longer vacancies and softer asking-rent achievability than the comps imply.
- What's the recent tenant-quality profile in this submarket — average credit score on applications, eviction rate, late-payment / NSF rate, and stable-employment percentage? A property-management company in the area should have these aggregated.
- How much new for-sale + rental construction is in the pipeline within 1–3 miles? Heavy new supply typically softens prices + rents 12–24 months out; constrained supply supports both.
Investment metrics
- 1% rule
- 1.18% ✓
- Cap rate
- 9.23%
- Cash-on-cash
- 10.48%
- DSCR
- 1.47
- GRM
- 7.0
CMA / ARV
- ARV (on-the-fly)
- $117,124
- Comps found
- 12
Show comp detail 12 sales within ~0.75 mi
| Address | Dist | Beds/Ba | Sqft | Sold | Price | $/sf | Match |
|---|---|---|---|---|---|---|---|
| 2400 Crawford Ave | 0.00mi | 2/1.0 | 1,316 (0%) | 1mo | $95,000 | $72 | 99 |
| 1919 5th Ave | 0.39mi | 3/1.0 (+1) | 1,260 (-4%) | 3mo | $38,000 | $30 | 67 |
| 1518 1st Ave | 0.56mi | 2/1.0 | 1,350 (+3%) | 3mo | $116,400 | $86 | 67 |
| 2004 3rd Ave | 0.29mi | 2/1.0 | 1,148 (-13%) | 2mo | $90,000 | $78 | 64 |
| 1828 Grant Ave | 0.37mi | 3/1.5 (+1) | 1,242 (-6%) | 6mo | $151,000 | $122 | 61 |
| 2710 7th Ave | 0.46mi | 3/1.0 (+1) | 1,400 (+6%) | 3mo | $125,000 | $89 | 60 |
| 1916 Hudson Ave | 0.39mi | 3/1.0 (+1) | 1,169 (-11%) | 2mo | $170,000 | $145 | 57 |
| 1901 3rd Ave | 0.35mi | 3/1.0 (+1) | 1,138 (-14%) | 3mo | $22,500 | $20 | 54 |
| 2607 Wren Ave | 0.45mi | 3/1.0 (+1) | 1,146 (-13%) | 0mo | $210,000 | $183 | 52 |
| 2524 Pleasant Valley Blvd | 0.50mi | 3/1.0 (+1) | 1,456 (+11%) | 6mo | $164,900 | $113 | 49 |
| 1110 S 16th St | 0.70mi | 2/1.0 | 1,164 (-12%) | 5mo | $75,000 | $64 | 44 |
| 1320 Walton Ave | 0.74mi | 3/2.0 (+1) | 1,440 (+9%) | 6mo | $205,000 | $142 | 36 |
Match score weights: distance 35% · size 25% · config 20% · recency 20%. Top-matched comps best support the ARV.
Projected returns pro-forma
-3.0% appreciation · 3.0% rent growth · sell at horizon
- IRR
- -0.6%
- Equity multiple
- 0.98×
- Total profit
- $-533
- Equity at exit
- $12,972
- IRR
- 9.1%
- Equity multiple
- 1.70×
- Total profit
- $17,046
- Equity at exit
- $7,522
Cash invested: $24,360 (down + closing). Projections, not guarantees.
Landlord ↔ Tenant lean methodology
- Overall (STATE)
- 62 Landlord-Friendly
- State Pennsylvania
- 62 Landlord-Friendly · EVEN
- County
- — inherits STATE
- City
- — inherits STATE
ZIP-level market 16602
- Home prices YoY
- -30.3%
- Active inventory
- 151
- Price-to-rent
- 7.0×
Monthly cashflow live
- Estimated rent
- $1,030 high interval (Pro) →
- Mortgage (P&I)
- −$456
- Tax est. 1.5%
- −$109 /mo · $1,305/yr
- Insurance
- −$36
- HOA
- −$0
- Vacancy / Maint / Mgmt
- −$216
- Net cashflow
- $213
Break-even live
UW: 25.0% down · 7.5% · 30yr · 1.5% tax · 5.0% vac · 8.0% maint · 8.0% mgmt
Financing live
Cash to close
- Down payment
- $21,750
- Closing costs
- $2,610
- Reserves months
- —
- Total cash needed
- —
Loan-product check · same deal, 3 products live
Conventional
25% down · 7.5% · 30yr
- Down + closing
- —
- Monthly P&I
- —
- Monthly cashflow
- —
- DSCR
- —
- Eligible?
- —
Personal DTI + credit; lowest rate.
DSCR
20% down · 8.5% · 30yr
- Down + closing
- —
- Monthly P&I
- —
- Monthly cashflow
- —
- DSCR
- —
- Eligible?
- —
No personal income docs; deal must DSCR.
Hard money
10% down · 12.0% · 12mo
- Down + closing
- —
- Monthly P&I
- —
- Monthly cashflow
- —
- DSCR
- —
- Eligible?
- —
Short-term bridge; refi at stabilization.
Rent comps 5 comps
| Address | Beds | Baths | Sqft | Rent | $/sqft | DOM | Units | Dist |
|---|---|---|---|---|---|---|---|---|
| 2015 12th Ave Altoona, PA | 3.0 | 1.0 | 1600 | $1,200 | $0.75 | 43d | 1 | 0.92mi |
| 3925 Burgoon Rd Altoona, PA | 3.0 | 1.0 | 1500 | $895 | $0.60 | 43d | 1 | 1.11mi |
| 1326 14th Ave Altoona, PA | 3.0 | 1.0 | 1600 | $1,150 | $0.72 | 43d | 1 | 1.16mi |
| 1489 Washington Ave Altoona, PA | 3.0 | 1.5 | 1050 | $850 | $0.81 | 43d | 1 | 1.23mi |
| 1102 17th Ave Altoona, PA | 3.0 | 1.0 | 1430 | $899 | $0.63 | 43d | 1 | 1.43mi |
Listing history 2 events
-
2026-04-24status Pending
-
2026-04-10$87,000 Active
ⓘ Source: listings_history table (triggers on properties + properties_extension) + one-shot
backfill from property_details.listing_events for pre-trigger history.
Climate risk First Street
- Flood 1/10 Low FEMA zone X (unshaded) · 0% chance over 30 yrs
- Wildfire 1/10 Low
- Heat 3/10 Moderate 7 d/yr ≥95°F today · 17 d/yr by 30 yrs out
- Wind 2/10 Low
- Air quality 2/10 Low 1 unhealthy d/yr today · 3 by 30 yrs out
Nearby sold comps map
Loading sold comps map…
Walkable amenities ~0.75 mi
Loading nearby amenities…
Taxation est. · year 1
- Rental income
- $12,364
- − Mortgage interest
- −$4,873
- − Property taxes
- −$1,305
- − Insurance
- −$435
- − Repairs & maintenance
- −$989
- − Management
- −$989
- − Depreciation
- −$2,531
- Taxable income
- $1,242
- Est. tax owed @ 24.0%
- −$298
- After-tax cash flow
- $2,255/yr
For passive investors: Depreciation is non-cash, so a rental often shows a tax loss while cash-flowing — sheltering income. Rental losses are passive: they offset passive income freely, and up to $25,000/yr can offset ordinary (W-2) income if you actively participate and your MAGI is under $100k (phasing out to $0 by $150k); unused losses carry forward. On sale, claimed depreciation is recaptured at up to 25%, and gains may owe capital-gains tax (a 1031 exchange can defer both). Figures are a year-1 estimate at your 24.0% rate — not tax advice; consult a CPA.
Condition & rehab AI · 12 photos
This home requires moderate renovations to improve its condition and increase its value. Exterior repairs and updates to the kitchen and bathrooms are essential.
Repairs flagged
- Major exterior siding — Severe peeling
- Major exterior paint — Visible damage
- Major kitchen cabinets — Old and outdated
- Major bathroom fixtures — Outdated and worn
Value-add opportunities
- Both new exterior siding — Enhances curb appeal and value
- Both new paint — Improves home's appearance and value
- Both new kitchen cabinets — Modernizes the space and increases value
- Both new bathroom fixtures — Updates the space and increases value
Renovation cost estimate screening
| Repair item | Severity | Est. cost |
|---|---|---|
| exterior siding · Severe peeling | Major | $15,000–50,000 |
| exterior paint · Visible damage | Major | $15,000–50,000 |
| kitchen cabinets · Old and outdated | Major | $15,000–50,000 |
| bathroom fixtures · Outdated and worn | Major | $15,000–50,000 |
| Total estimated repair cost · 4 items | $60,000–200,000 |
Value-add ROI direction
- Both new exterior siding — Enhances curb appeal and value ↑
- Both new paint — Improves home's appearance and value ↑
- Both new kitchen cabinets — Modernizes the space and increases value ↑
- Both new bathroom fixtures — Updates the space and increases value ↑
ⓘ Cost ranges are severity-bucket heuristics (US national rule-of-thumb). Get contractor quotes + a written scope before underwriting a rehab budget.
Schools (NCES district)
- District
- Altoona Area SD
- NCES district ID
- 4202340
- Math proficiency
- 30% ▼ -15.00%
- Reading proficiency
- 44% ▼ -15.00%
- Median HH income
- $38,465
- Composite
- 30.85/100
- National rank
- #6130
- State rank
- #406 of 539 in PA
Livability — Altoona
- Score
- 79/100
- State rank
- #237
- US rank
- #2060
Category grades
Schools grade is shown separately in the Schools card above.
Census & demographics
- Census place
- Altoona, PA
- County
- Blair County · 59,867 people
- City population
- 59,867
- Metro
- Altoona, PA
- Population (ZIP)
- 26,352
- Household income
- $55,046
- Rent vs Own
- Severe rent burden
- 740.0
Population outlook (Blair County) Hauer SSP2
- Today (2025)
- 121,571 people
- By 2030
- 117,966 · -3.0%
- By 2040
- 109,174 · -10.2%
- By 2050
- 99,542 · -18.1%
- By 2075
- 76,775 · -36.8%
- By 2100
- 54,326 · -55.3%
Race, ethnicity, and origin ACS 2023
- Neighborhood character
- Predominantly White (90%)
- Race & ethnicity
- White 90% Two or more races 5% Black 3% Hispanic / Latino 2%
- Common ancestry
- Romanian 4% Lithuanian 1% Italian 1%
- Foreign-born
- 2% · Canada
- Languages at home
- 97% English-only · Spanish 1%
Political lean MEDSL · Blair
- 2024 margin
- Solid R (+43.5) · D 27.9% · R 71.4%
- 2008→2024 swing
- -19.2pp toward R · 2008: -24.3pp · 2024: -43.5pp
- All cycles
- 2024: R+43.5 2020: R+43.5 2016: R+46.4 2012: R+33.5 2008: R+24.3
Not yet ingested
- Civics
- —
Market trends
- HPI YoY
- ▼ -92.37%
- Current HPI
- 212.2268
- Rent YoY
- —
- Metro
- Altoona, PA
- State GDP YoY
- ▲ 1.68%
- F500 in state
- 34
Industry mix (Fortune 500 HQ in PA)
| Industry | F500 HQs | Revenue |
|---|---|---|
| Healthcare | 2 | $309B |
|
||
| Insurance | 2 | $27B |
|
||
| Telecommunications / Media | 1 | $124B |
|
||
| Industrial Distribution | 1 | $22B |
|
||
| Financial Services | 1 | $20B |
|
||
| Chemicals / Materials | 1 | $18B |
|
||
Price history
2 events — show timeline
- 2026-04-24 Pending — AHARMLS
- 2026-04-10 Listed $87,000 AHARMLS
Cash-flow waterfall
monthlySold comps — $/sqft
last 12 mo · ≤1 miLoading sold comps…