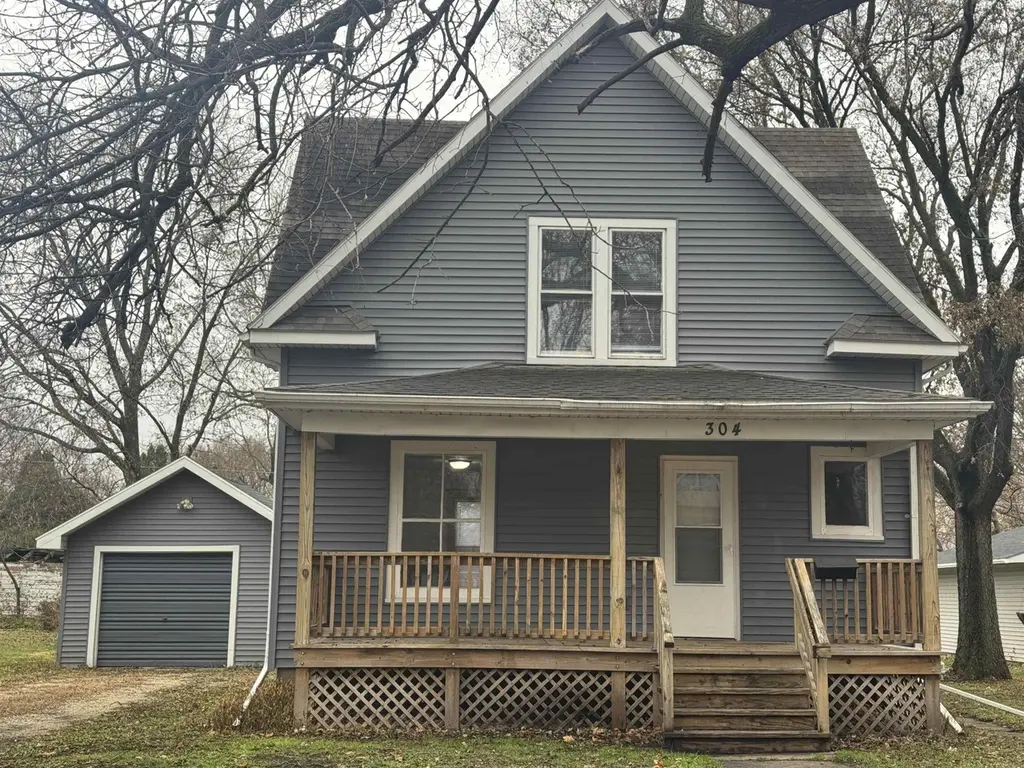
304 8th Ave. Ave · Charles City, IA
Flood risk 4/10 · Minor
- FEMA flood zone
- X (unshaded)
- Chance of flooding over 30 yrs
- 0.21%
- Est. flood insurance / yr
- $473 – $860
Fire risk 4/10 · Minor
- Est. fire insurance / yr
- $902 – $1,676
Heat risk 2/10 · Minimal
- Hot days now (above 101°F)
- 7 days/yr
- Hot days in 30 yrs
- 16 days/yr
Wind risk 2/10 · Minimal
- Chance of severe wind over 30 yrs
- —
Air-quality risk 1/10 · Minimal
- Unhealthy air days now
- 0 days/yr
- Unhealthy air days in 30 yrs
- 0 days/yr
Risk factors via First Street. Map © Google.
Why this score? — see what drove the C+ grade
The composite is a weighted blend of 9 inputs, each scored 0–100. Each bar is that input's sub-score; the figure is the points it added to the 100-point composite (weight × sub-score).
- Cash flow +29.6/30.0
- DSCR +10.0/10.0
- 1% rule +8.4/10.0
- Schools +4.7/10.0
- Livability +3.9/5.0
- Rent growth +2.5/5.0
- Condition / age +2.5/5.0
- ARV discount +0.0/15.0
- Appreciation +0.0/10.0
$117,500
🖨 Deal sheet 📄 Offer letter ✓ Due diligence
Listing remarks MLS
Step into this beautifully maintained two-story home offering 1,344 sq. ft. of comfortable living space and exceptional updates throughout. This three-bedroom, one-bath residence shines with newer siding, all-new interior décor, and a new furnace, ensuring worry-free living for years to come. The moment you enter, you’ll appreciate the gorgeous open staircase, rich oak trim, and inviting layout that blends classic character with modern finishes. The spacious oak kitchen features an eating bar, ample cabinetry, and a warm, functional design perfect for daily living and entertaining. Additional highlights include a single detached garage, large 66x125 lot, as well as new front and rear porches that provide ideal outdoor spaces for relaxing or greeting guests. This home is in excellent condition and move-in ready—an outstanding opportunity you won’t want to miss.
Key facts
- Oak trim
- New furnace
- Open staircase
Tags
Neighborhood map
What this means for you Summary
Snapshot
- This is a 3-bed/1.0-bath single-family listed at $118k.
Deal economics
- At list price, monthly cash flow is $425 ($5k/yr) — positive.
- The deal already cash-flows at list — no discount required.
- Meets the 1% rule at list price ($2k rent vs $118k).
- Recommended offer: $103k (12.0% below list) — sets the bar for market timing.
- Cap rate 10.6% vs local median 6.5% in Charles City — top-decile yield for the area; either an underpriced asset or a hidden risk that comps aren't pricing in. Stress-test before assuming the spread holds.
Location & tenants
- Location reads 77/100 on livability (#161 in IA, #2,944 nationally) — a middle-class / working-renter tenant base. Strengths: cost of living A+, health & safety A+, housing A; Watch: amenities F, commute F, employment F.
- Charles City Community School District (town): math 52% / reading 61% proficiency, ranked #262 of 289 in IA (top 91%) — acceptable for families but not a draw, mixed tenant base, ~2y average lease.
- Market conditions: 70 active listings in the ZIP; 2 comparable units currently listed for rent nearby; 38 units permitted in Floyd County in 2024 (0 in 5+ unit buildings).
Forward outlook
- Local home prices are declining (-3.0%/yr); year-one equity from $812 of loan paydown is wiped out by about $4k of value loss. Plan a longer hold.
- Floyd County population projected to shrink 6% by 2050 — rents likely to lag national; underwrite the cash flow, not the appreciation.
- At projected returns (-3.0% appreciation + 3.0% rent growth), your $33k cash investment doubles in ~8 years — after that, you're playing with house money.
Negotiation context
- It's been on market 192 days — a 12% lower offer ($103k) is reasonable based on typical stale-listing flexibility.
- Current owner paid $22k; list at $118k implies a 444% gain — meaningful room to come down on a strong offer.
Risks & watch-outs
- Watch-outs: built in 1910 — expect roof / HVAC / electrical / plumbing capex.
Questions for the listing agent
- It's been on market 192 days. Have you received any prior offers? Is the seller open to a 12% concession, seller financing, or rate buy-down credit?
- Built in 1910 — when were the roof, HVAC, electrical panel, plumbing, and water heater last replaced?
- Why hasn't it sold? Are there any deal-killer items the seller is aware of (foundation, flood, title, zoning, code violations)?
- Is there a deadline driving the sale (1031 exchange, divorce, estate, relocation)? That informs how much negotiation room exists.
- What's the average days-on-market for RENTAL listings here right now (not sales)? A rising rental-DOM trend means longer vacancies and softer asking-rent achievability than the comps imply.
- What's the recent tenant-quality profile in this submarket — average credit score on applications, eviction rate, late-payment / NSF rate, and stable-employment percentage? A property-management company in the area should have these aggregated.
- How much new for-sale + rental construction is in the pipeline within 1–3 miles? Heavy new supply typically softens prices + rents 12–24 months out; constrained supply supports both.
Investment metrics
- 1% rule
- 1.34% ✓
- Cap rate
- 10.64%
- Cash-on-cash
- 15.51%
- DSCR
- 1.69
- GRM
- 6.2
CMA / ARV
- ARV (median comp)
- $88,156
- List price
- $117,500
- Delta
- 33.29%
- Verdict
- OVERPRICED
- Comps
- 20 within 1.0 mi
Show comp detail 12 sales within ~0.75 mi
| Address | Dist | Beds/Ba | Sqft | Sold | Price | $/sf | Match |
|---|---|---|---|---|---|---|---|
| 503 8th Ave | 0.16mi | 3/1.5 | 1,414 (+5%) | 4mo | $149,000 | $105 | 79 |
| 315 16th Ave | 0.60mi | 3/1.5 | 1,400 (+4%) | 6mo | $136,000 | $97 | 58 |
| 1312 Missouri Ave | 0.60mi | 3/1.0 | 1,364 (+2%) | 14mo | $141,500 | $104 | 58 |
| 513 3rd Ave | 0.35mi | 2/1.0 (-1) | 1,179 (-12%) | 2mo | $120,000 | $102 | 57 |
| 108 15th Ave | 0.49mi | 3/1.5 | 1,456 (+8%) | 8mo | $84,000 | $58 | 54 |
| 514 8th Ave | 0.21mi | 3/2.0 | 1,542 (+15%) | 9mo | $88,000 | $57 | 54 |
| 603 8th Ave | 0.25mi | 3/1.0 | 1,544 (+15%) | 12mo | $105,000 | $68 | 54 |
| 406 16th Ave | 0.57mi | 3/1.0 | 1,176 (-12%) | 14mo | $65,000 | $55 | 41 |
| 305 16th Ave | 0.59mi | 3/2.0 | 1,232 (-8%) | 17mo | $90,000 | $73 | 40 |
| 1008 Ellis Dr. Apt #6 Dr | 0.62mi | 2/1.0 (-1) | 1,144 (-15%) | 7mo | $115,000 | $101 | 35 |
| 202 Ferguson St | 0.65mi | 3/1.5 | 1,166 (-13%) | 13mo | $90,000 | $77 | 35 |
| 600 Freeman St | 0.68mi | 3/2.0 | 1,540 (+15%) | 8mo | $142,500 | $93 | 34 |
Match score weights: distance 35% · size 25% · config 20% · recency 20%. Top-matched comps best support the ARV.
Projected returns pro-forma
-3.0% appreciation · 3.0% rent growth · sell at horizon
- IRR
- 6.3%
- Equity multiple
- 1.25×
- Total profit
- $8,072
- Equity at exit
- $17,520
- IRR
- 15.7%
- Equity multiple
- 2.28×
- Total profit
- $42,015
- Equity at exit
- $10,159
Cash invested: $32,900 (down + closing). Projections, not guarantees.
Landlord ↔ Tenant lean methodology
- Overall (STATE)
- 83 Strongly Landlord-Friendly
- State Iowa
- 83 Strongly Landlord-Friendly · R+6
- County
- — inherits STATE
- City
- — inherits STATE
ZIP-level market 50616
- Home prices YoY
- -19.7%
- Active inventory
- 70
- Price-to-rent
- 6.2×
Monthly cashflow live
- Estimated rent
- $1,573 medium interval (Pro) →
- Mortgage (P&I)
- −$616
- Tax from tax record
- −$153 /mo · $1,832/yr
- Insurance
- −$49
- HOA
- −$0
- Vacancy / Maint / Mgmt
- −$330
- Net cashflow
- $425
Break-even live
UW: 25.0% down · 7.5% · 30yr · 1.5% tax · 5.0% vac · 8.0% maint · 8.0% mgmt
Financing live
Cash to close
- Down payment
- $29,375
- Closing costs
- $3,525
- Reserves months
- —
- Total cash needed
- —
Loan-product check · same deal, 3 products live
Conventional
25% down · 7.5% · 30yr
- Down + closing
- —
- Monthly P&I
- —
- Monthly cashflow
- —
- DSCR
- —
- Eligible?
- —
Personal DTI + credit; lowest rate.
DSCR
20% down · 8.5% · 30yr
- Down + closing
- —
- Monthly P&I
- —
- Monthly cashflow
- —
- DSCR
- —
- Eligible?
- —
No personal income docs; deal must DSCR.
Hard money
10% down · 12.0% · 12mo
- Down + closing
- —
- Monthly P&I
- —
- Monthly cashflow
- —
- DSCR
- —
- Eligible?
- —
Short-term bridge; refi at stabilization.
Rent comps 2 comps
| Address | Beds | Baths | Sqft | Rent | $/sqft | DOM | Units | Dist |
|---|---|---|---|---|---|---|---|---|
| 1030 13th Ave Charles City, IA | 1.0–3.0 | 1.0–2.0 | 926 | $1,927 | $2.08 | 43d | 28 | 0.50mi |
| 1004 20th Ave Charles City, IA | 3.0 | 2.0 | 960 | $975 | $1.02 | 23d | 1 | 0.88mi |
Listing history 7 events
-
2026-06-01status $117,500 Pending 192 DOM
-
2026-06-01days on market $117,500 Active 192 DOM
-
2026-05-31days on market $117,500 Active 191 DOM
-
2026-05-31days on market $117,500 Active 190 DOM
-
2025-11-21$117,500 Active 897-char remark
Show marketing remark (897 chars)
Step into this beautifully maintained two-story home offering 1,344 sq. ft. of comfortable living space and exceptional updates throughout. This three-bedroom, one-bath residence shines with newer siding, all-new interior décor, and a new furnace, ensuring worry-free living for years to come. The moment you enter, you’ll appreciate the gorgeous open staircase, rich oak trim, and inviting layout that blends classic character with modern finishes. The spacious oak kitchen features an eating bar, ample cabinetry, and a warm, functional design perfect for daily living and entertaining. Additional highlights include a single detached garage, large 66x125 lot, as well as new front and rear porches that provide ideal outdoor spaces for relaxing or greeting guests. This home is in excellent condition and move-in ready—an outstanding opportunity you won’t want to miss.
-
1996-10-31soldstatus $21,600
-
1994-02-19soldstatus $15,500
ⓘ Source: listings_history table (triggers on properties + properties_extension) + one-shot
backfill from property_details.listing_events for pre-trigger history.
Tax reassessment forecast IA · Partial reset (capped growth)
- Current annual tax
- $1,832 · $153/mo
- Projected year-2 tax
- $1,838 · $153/mo
- Expected delta
- +$6/yr (+$1/mo · 0.3%)
ⓘ Screening estimate from a state-policy table — verify with the county assessor before closing.
Climate risk First Street
- Flood 4/10 Moderate FEMA zone X (unshaded) · 21% chance over 30 yrs
- Wildfire 4/10 Moderate
- Heat 2/10 Low 7 d/yr ≥101°F today · 16 d/yr by 30 yrs out
- Wind 2/10 Low
- Air quality 1/10 Low 0 unhealthy d/yr today · 0 by 30 yrs out
Nearby sold comps map
Loading sold comps map…
Walkable amenities ~0.75 mi
Loading nearby amenities…
Taxation est. · year 1
- Rental income
- $18,882
- − Mortgage interest
- −$6,582
- − Property taxes
- −$1,832
- − Insurance
- −$588
- − Repairs & maintenance
- −$1,511
- − Management
- −$1,511
- − Depreciation
- −$3,418
- Taxable income
- $3,441
- Est. tax owed @ 24.0%
- −$826
- After-tax cash flow
- $4,277/yr
For passive investors: Depreciation is non-cash, so a rental often shows a tax loss while cash-flowing — sheltering income. Rental losses are passive: they offset passive income freely, and up to $25,000/yr can offset ordinary (W-2) income if you actively participate and your MAGI is under $100k (phasing out to $0 by $150k); unused losses carry forward. On sale, claimed depreciation is recaptured at up to 25%, and gains may owe capital-gains tax (a 1031 exchange can defer both). Figures are a year-1 estimate at your 24.0% rate — not tax advice; consult a CPA.
Schools (NCES district)
- District
- Charles City Community School District
- NCES district ID
- 1907080
- Math proficiency
- 52% ▼ -3.00%
- Reading proficiency
- 61% ▲ 9.00%
- Median HH income
- $41,414
- Composite
- 47.32/100
- National rank
- #2299
- State rank
- #262 of 289 in IA
Livability — Charles City
- Score
- 77/100
- State rank
- #161
- US rank
- #2944
Category grades
Schools grade is shown separately in the Schools card above.
Census & demographics
- Census place
- Charles City, IA
- City population
- 9,419
- Population (ZIP)
- 9,419
Population outlook (Floyd County) Hauer SSP2
- Today (2025)
- 15,524 people
- By 2030
- 15,254 · -1.7%
- By 2040
- 14,830 · -4.5%
- By 2050
- 14,660 · -5.6%
- By 2075
- 15,548 · +0.2%
- By 2100
- 17,406 · +12.1%
Race, ethnicity, and origin ACS 2023
- Neighborhood character
- Predominantly White (87%)
- Race & ethnicity
- White 87% Two or more races 6% Hispanic / Latino 5% Asian 2% Black 2%
- Hispanic origin (detail)
- Mexican 4%
- Common ancestry
- Portuguese 6% Scandinavian 2% Lithuanian 2%
- Foreign-born
- 5% · Canada
- Languages at home
- 94% English-only · Spanish 2% Other Asian/Pacific 1% Tagalog/Filipino 1%
Political lean MEDSL · Floyd
- 2024 margin
- Strong R (+25.7) · D 36.5% · R 62.2% · Other 1.3%
- 2008→2024 swing
- -47.6pp toward R · 2008: 21.9pp · 2024: -25.7pp
- All cycles
- 2024: R+25.7 2020: R+19.4 2016: R+14.9 2012: D+14.7 2008: D+21.9
Not yet ingested
- Civics
- —
Market trends
- HPI YoY
- ▼ -46.03%
- Current HPI
- 187.4742
- Rent YoY
- —
- Metro
- —
- State GDP YoY
- ▲ 2.48%
- F500 in state
- 4
Industry mix (Fortune 500 HQ in IA)
| Industry | F500 HQs | Revenue |
|---|---|---|
| Financial Services | 1 | $16B |
|
||
| Retail / Convenience | 1 | $15B |
|
||
Price history
+658.1% since first listed3 events — show timeline
- 2025-11-21 Listed $117,500 NEIRBR as distributed by MLS GRID
- 1996-10-31 Sold (Public Records) $21,600 Public Records
- 1994-02-19 Sold (Public Records) $15,500 Public Records
Property tax history
+12.9%/yrLatest (2025): $1,832 · +0.2% YoY. Source: county tax records.
Cash-flow waterfall
monthlySold comps — $/sqft
last 12 mo · ≤1 miLoading sold comps…