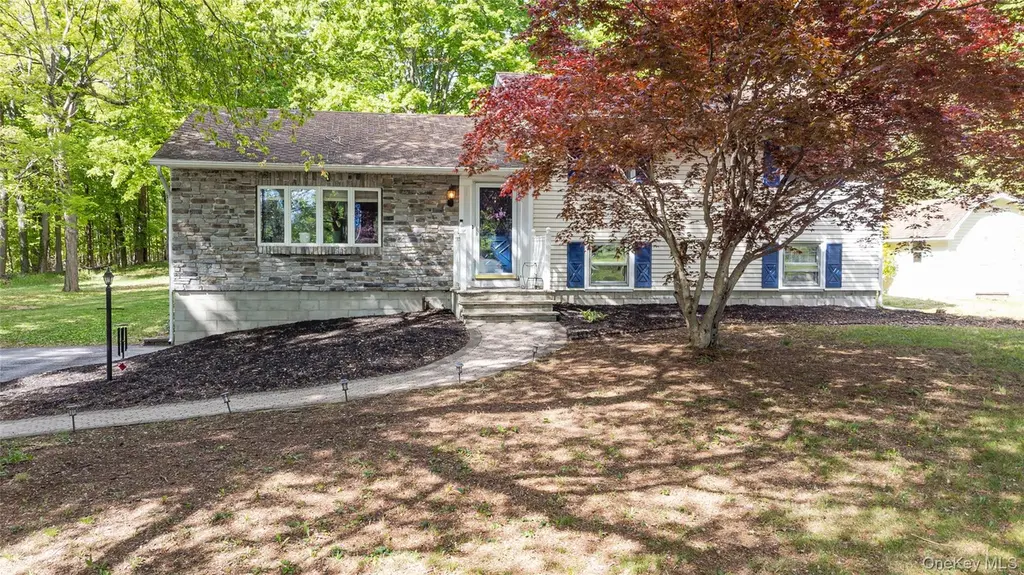
25 Mcallister Dr · Freedom Plains, NY
Flood risk 1/10 · Minimal
- FEMA flood zone
- X (unshaded)
- Chance of flooding over 30 yrs
- 0.0%
- Est. flood insurance / yr
- $473 – $860
Fire risk 3/10 · Minor
- Est. fire insurance / yr
- $691 – $1,283
Heat risk 4/10 · Minor
- Hot days now (above 98°F)
- 7 days/yr
- Hot days in 30 yrs
- 15 days/yr
Wind risk 4/10 · Minor
- Chance of severe wind over 30 yrs
- 12.0%
Air-quality risk 3/10 · Minor
- Unhealthy air days now
- 2 days/yr
- Unhealthy air days in 30 yrs
- 3 days/yr
Risk factors via First Street. Map © Google.
Why this score? — see what drove the D+ grade
The composite is a weighted blend of 9 inputs, each scored 0–100. Each bar is that input's sub-score; the figure is the points it added to the 100-point composite (weight × sub-score).
- Cash flow +12.9/30.0
- ARV discount +9.9/15.0
- Schools +6.3/10.0
- 1% rule +4.5/10.0
- DSCR +3.9/10.0
- Livability +3.2/5.0
- Rent growth +2.5/5.0
- Condition / age +2.5/5.0
- Appreciation +0.0/10.0
$475,000
🖨 Deal sheet (PDF) 📄 Offer letter ✓ Due diligence
Listing remarks MLS
3 BEDROOM SPLIT LEVEL SITUATED ON BEAUTIFUL 1.14 ACRE PARK LIKE PROPERTY. MAIN LEVEL FEATURES KITCHEN, LIVING ROOM & DINING ROOM. MASTER BEDROOM W/ENSUITE HALF BATH & WALK-IN CLOSET. LOWER LEVEL INCLUDES LARGE FAMILY ROOM W/WOOD STOVE, OFFICE & HALF BATH/LAUNDRY ROOM. NEW BOILER. 2 CAR GARAGE FOR ABUNDANT STORAGE. THREE SEASON ROOM OVERLOOKING EXPANSIVE BACKYARD INCLUDES INGROUND POOL PATIO W/BUILT-IN FIREPLACE & STORAGE SHED. PRIVATE & QUIET YET CENTRALLY LOCATED & JUST MINUTES FROM SCHOOLS, SHOPPING, TACONIC STATE PARKWAY, POUGHKEEPSIE TRAIN STATION & AREA ATTRACTIONS. SOLD AS-IS.,Level 1 Desc:FAMILY ROOM W/WOODSTOVE, OFFICE, .5 BATH/LAUNDRY,FLOORING:Ceramic Tile,Wood,Vinyl,OTHERROOMS:Formal Dining Room,Family Room,Laundry/Util. Room,Office/Computer Room,ROOF:Asphalt Shingles,ExteriorFeatures:Outside Lighting,InteriorFeatures:Electric Dryer Connection,Electric Stove Connection,Walk-In Closets,Washer Connection,AboveGrade:1800,Level 2 Desc:LIVING ROOM, DINING ROOM, KITCHEN,Level 3 Desc:MASTER BEDROOM W/ENSUITE .5 BATH, 2 BEDROOMS, FULL BATH,FOUNDATION:Block
Key facts
- 1.14 acre lot
- 2 garage spots
- Pool
Property features AI
Finance
- Other: Private in-ground pool
Exterior
- Parking: Driveway parking; 2 garage spaces (has garage); Total parking for 2 vehicles
- Utilities: Central Hudson electric service; Septic tank; Cable connected; Electricity connected; Natural gas connected
- Home design: Single family residence
- Construction: Wood siding; Block and concrete perimeter foundation
- Exterior features: Fire pit; Outdoor lighting; Mailbox; Shed(s); Back yard; Cleared and landscaped yard; Paved areas; Wooded portions
Interior
- Kitchen: Dishwasher; Microwave; Oven; Range; Refrigerator
- Bedrooms: 7 total rooms (includes bedrooms and living spaces)
- Flooring: Carpet; Hardwood; Vinyl
- Bathrooms: 1 full bathroom; 2 half bathrooms
- Heating & cooling: Baseboard heating; Oil heating; Wood heating; Wall/window air conditioning unit(s); One fireplace (free-standing, in basement)
- Interior features: Formal dining room; Pantry; Storage; Washer/dryer hookup
- Laundry & utility: Washer; Dryer; Laundry located in basement
Neighborhood map
What this means for you Summary
Snapshot
- This is a 3-bed/2.0-bath single-family listed at $475k.
Deal economics
- At list price, monthly cash flow is $-32 ($-381/yr) — negative.
- To cash-flow at today's rent, offer at most $469k (1.2% below list).
- To meet the 1% rule (rent ≥ 1% of price), the offer needs to be $450k (5.3% below list).
- Recommended offer: $450k (5.3% below list) — sets the bar for 1% rule.
- Cap rate 6.2% vs local median 3.4% in Freedom Plains — top-decile yield for the area; either an underpriced asset or a hidden risk that comps aren't pricing in. Stress-test before assuming the spread holds.
Location & tenants
- Location reads 65/100 on livability (#715 in NY) — a middle-class / working-renter tenant base. Watch: housing C-, crime F, amenities F.
- Arlington Central School District (suburban): math 77% / reading 65% proficiency, ranked #106 of 590 in NY (top 18%) — strong family-tenant draw, lease renewals of 3-5y typical; only 16% free/reduced lunch — higher-income household profile.
- Zoned schools: Overlook Primary School (402 students, 25% FRL); Lagrange Middle School (math 34% / reading 74%, grade B-, #214 of 729 statewide, top 31%, 865 students, 38% FRL); Arlington High School (math 95% / reading 58%, grade A-, #612 of 1,100 statewide, top 56%, 2,547 students, 26% FRL).
- Market conditions: 59 active listings in the ZIP; 1 comparable units currently listed for rent nearby; 620 units permitted in Dutchess County in 2024 (242 in 5+ unit buildings).
Forward outlook
- Local home prices are declining (-3.0%/yr); year-one equity from $3k of loan paydown is wiped out by about $14k of value loss. Plan a longer hold.
- Dutchess County population projected at -11% by 2050 — secular population decline; favor cash flow + early exit over multi-decade hold.
Negotiation context
- It's been on market 19 days — a 2% lower offer ($468k) is reasonable based on typical stale-listing flexibility.
- 2 sale attempts since 5y ago; this cycle's ask is 49% above the opening price — seller raised mid-cycle; expect resistance to lowballs.
- Current owner paid $376k; 26% above their basis — modest negotiation headroom, anchor on the comps not their cost.
Questions for the listing agent
- What do current leases actually rent for vs. the listed asking? Can we see a recent rent roll and the last 12 months of T-12 income?
- Built in 1962 — when were the roof, HVAC, electrical panel, plumbing, and water heater last replaced?
- Is there a deadline driving the sale (1031 exchange, divorce, estate, relocation)? That informs how much negotiation room exists.
- Schools are A-rated — typically a magnet for longer-tenancy family renters. What's the average tenant stay here, and is there a school-zone premium baked into asking?
- Crime grade is F in this area — have there been break-ins, vandalism, or insurance claims at this property in the last 3 years? What carrier currently insures it and at what premium?
- The area grade is low — what's the realistic commute time and amenity access for the typical tenant pool here? Any planned neighborhood developments (good or bad) we should know about?
- What's the average days-on-market for RENTAL listings here right now (not sales)? A rising rental-DOM trend means longer vacancies and softer asking-rent achievability than the comps imply.
- What's the recent tenant-quality profile in this submarket — average credit score on applications, eviction rate, late-payment / NSF rate, and stable-employment percentage? A property-management company in the area should have these aggregated.
- How much new for-sale + rental construction is in the pipeline within 1–3 miles? Heavy new supply typically softens prices + rents 12–24 months out; constrained supply supports both.
Investment metrics
- 1% rule
- 0.95% ✗
- Cap rate
- 6.21%
- Cash-on-cash
- -0.29%
- DSCR
- 0.99
- GRM
- 8.8
CMA / ARV
- ARV (on-the-fly)
- $502,200
- Comps found
- 5
Show comp detail 5 sales within ~0.75 mi
| Address | Dist | Beds/Ba | Sqft | Sold | Price | $/sf | Match |
|---|---|---|---|---|---|---|---|
| 29 Mcallister Dr | 0.07mi | 3/1.5 | 1,701 (-6%) | 1mo | $475,000 | $279 | 85 |
| 347 Overlook | 0.15mi | 3/2.0 | 1,800 (0%) | 11mo | $400,000 | $222 | 83 |
| 9 Mcallister Dr | 0.16mi | 3/2.5 | 1,670 (-7%) | 5mo | $475,000 | $284 | 75 |
| 7 Nied Dr | 0.55mi | 3/2.0 | 1,726 (-4%) | 2mo | $485,000 | $281 | 66 |
| 218 Freedom Rd | 0.53mi | 3/1.5 | 1,592 (-12%) | 18mo | $408,000 | $256 | 39 |
Match score weights: distance 35% · size 25% · config 20% · recency 20%. Top-matched comps best support the ARV.
Projected returns pro-forma
-3.0% appreciation · 3.0% rent growth · sell at horizon
- IRR
- -16.7%
- Equity multiple
- 0.41×
- Total profit
- $-78,735
- Equity at exit
- $70,824
- IRR
- -8.4%
- Equity multiple
- 0.47×
- Total profit
- $-70,127
- Equity at exit
- $41,069
Cash invested: $133,000 (down + closing). Projections, not guarantees.
Landlord ↔ Tenant lean methodology
- Overall (STATE)
- 15 Strongly Tenant-Friendly
- State New York
- 15 Strongly Tenant-Friendly · D+10
- County
- — inherits STATE
- City
- — inherits STATE
ZIP-level market 12569
- Home prices YoY
- -16.2%
- Active inventory
- 59
- Price-to-rent
- 8.8×
Monthly cashflow live
- Estimated rent
- $4,500 medium interval (Pro) →
- Mortgage (P&I)
- −$2,491
- Tax from tax record
- −$898 /mo · $10,774/yr
- Insurance
- −$198
- HOA
- −$0
- Vacancy / Maint / Mgmt
- −$945
- Net cashflow
- $-32
Break-even live
Sensitivity live
| Price | -10% $237 | -5% $103 | +0% $-32 | +5% $-166 | +10% $-301 |
|---|---|---|---|---|---|
| Rent | -10% $-387 | -5% $-209 | +0% $-32 | +5% $146 | +10% $324 |
| Rate | -1.0pp $207 | -0.5pp $89 | base $-32 | +0.5pp $-155 | +1.0pp $-280 |
UW: 25.0% down · 7.5% · 30yr · 1.5% tax · 5.0% vac · 8.0% maint · 8.0% mgmt
Financing live
Cash to close
- Down payment
- $118,750
- Closing costs
- $14,250
- Reserves months
- —
- Total cash needed
- —
Loan-product check · same deal, 3 products live
Conventional
25% down · 7.5% · 30yr
- Down + closing
- —
- Monthly P&I
- —
- Monthly cashflow
- —
- DSCR
- —
- Eligible?
- —
Personal DTI + credit; lowest rate.
DSCR
20% down · 8.5% · 30yr
- Down + closing
- —
- Monthly P&I
- —
- Monthly cashflow
- —
- DSCR
- —
- Eligible?
- —
No personal income docs; deal must DSCR.
Hard money
10% down · 12.0% · 12mo
- Down + closing
- —
- Monthly P&I
- —
- Monthly cashflow
- —
- DSCR
- —
- Eligible?
- —
Short-term bridge; refi at stabilization.
Rent comps 1 comps
| Address | Beds | Baths | Sqft | Rent | $/sqft | DOM | Units | Dist |
|---|---|---|---|---|---|---|---|---|
| 4 Glen Ct Poughkeepsie, NY | 3.0 | 2.0 | 1782 | $4,500 | $2.53 | 45d | 1 | 1.35mi |
Listing history 13 events
-
2026-06-22days on market $475,000 Active 19 DOM
-
2026-06-18days on market $475,000 Active 16 DOM
-
2026-06-17days on market $475,000 Active 15 DOM
-
2026-06-16days on market $475,000 Active 14 DOM
-
2026-06-15days on market $475,000 Active 13 DOM
-
2026-06-14days on market $475,000 Active 11 DOM
-
2026-06-10days on market $475,000 Active 8 DOM
-
2026-06-09days on market $475,000 Active 7 DOM
-
2026-06-08days on market $475,000 Active 6 DOM
-
2026-06-07days on market $475,000 Active 5 DOM
-
2026-06-03pricestatus $475,000 Active 1 DOM
-
2026-06-03remarks 699-char remark
-
2026-06-03$450,000 Coming Soon 1 DOM
ⓘ Source: listings_history table (triggers on properties + properties_extension) + one-shot
backfill from property_details.listing_events for pre-trigger history.
Tax reassessment forecast NY · Partial reset (capped growth)
- Current annual tax
- $10,774 · $898/mo
- Projected year-2 tax
- $10,774 · $898/mo
- Expected delta
- $0/yr ($0/mo · 0.0%)
ⓘ Screening estimate from a state-policy table — verify with the county assessor before closing.
Climate risk First Street
- Flood 1/10 Low FEMA zone X (unshaded) · 0% chance over 30 yrs
- Wildfire 3/10 Moderate
- Heat 4/10 Moderate 7 d/yr ≥98°F today · 15 d/yr by 30 yrs out
- Wind 4/10 Moderate 12% chance of damaging wind over 30 yrs
- Air quality 3/10 Moderate 2 unhealthy d/yr today · 3 by 30 yrs out
Nearby sold comps map
Loading sold comps map…
Walkable amenities ~0.75 mi
Loading nearby amenities…
Taxation est. · year 1
- Rental income
- $54,000
- − Mortgage interest
- −$26,607
- − Property taxes
- −$10,774
- − Insurance
- −$2,375
- − Repairs & maintenance
- −$4,320
- − Management
- −$4,320
- − Depreciation
- −$13,818
- Taxable loss
- −$8,215
- Est. tax savings @ 24.0%
- +$1,972
- After-tax cash flow
- $1,591/yr
For passive investors: Depreciation is non-cash, so a rental often shows a tax loss while cash-flowing — sheltering income. Rental losses are passive: they offset passive income freely, and up to $25,000/yr can offset ordinary (W-2) income if you actively participate and your MAGI is under $100k (phasing out to $0 by $150k); unused losses carry forward. On sale, claimed depreciation is recaptured at up to 25%, and gains may owe capital-gains tax (a 1031 exchange can defer both). Figures are a year-1 estimate at your 24.0% rate — not tax advice; consult a CPA.
Schools (NCES district)
- District
- Arlington Central School District
- NCES district ID
- 3603270
- Math proficiency
- 77% ▲ 19.00%
- Reading proficiency
- 65% ▲ 12.00%
- Median HH income
- $83,597
- Composite
- 63.47/100
- National rank
- #613
- State rank
- #106 of 590 in NY
Livability — Freedom Plains
- Score
- 65/100
- State rank
- #715
- US rank
- #13585
Category grades
Schools grade is shown separately in the Schools card above.
Census & demographics
- Population (ZIP)
- 9,766
Population outlook (Dutchess County) Hauer SSP2
- Today (2025)
- 291,768 people
- By 2030
- 287,131 · -1.6%
- By 2040
- 274,881 · -5.8%
- By 2050
- 259,971 · -10.9%
- By 2075
- 235,366 · -19.3%
- By 2100
- 208,786 · -28.4%
Race, ethnicity, and origin ACS 2023
- Neighborhood character
- Predominantly White (79%)
- Race & ethnicity
- White 79% Hispanic / Latino 12% Two or more races 9% Black 3% Asian 1%
- Hispanic origin (detail)
- Mexican 2% Puerto Rican 3% Cuban 1%
- Common ancestry
- Romanian 5% Lithuanian 3% Iranian 3%
- Foreign-born
- 7% · Canada, China, Jamaica
- Languages at home
- 91% English-only · Spanish 4% Russian/Polish/Slavic 2% Chinese 1%
Political lean MEDSL · Dutchess
- 2024 margin
- Lean D (+5.4) · D 52.7% · R 47.3%
- 2008→2024 swing
- -3.2pp toward R · 2008: 8.6pp · 2024: 5.4pp
- All cycles
- 2024: D+5.4 2020: D+9.6 2016: R+1.1 2012: D+6.6 2008: D+8.6
Not yet ingested
- Civics
- —
Market trends
- HPI YoY
- ▼ -46.72%
- Current HPI
- 240.7838
- Rent YoY
- —
- Metro
- —
- State GDP YoY
- ▲ 2.60%
- F500 in state
- 92
Industry mix (Fortune 500 HQ in NY)
| Industry | F500 HQs | Revenue |
|---|---|---|
| Financial Services | 10 | $950B |
|
||
| Consumer Goods | 9 | $162B |
|
||
| Insurance | 4 | $225B |
|
||
| Telecommunications | 2 | $144B |
|
||
| Pharmaceuticals | 2 | $112B |
|
||
| Media / Entertainment | 2 | $69B |
|
||
Price history
+216.7% since first listed9 events — show timeline
- 2026-06-03 Price Changed $475,000 OneKey® MLS as Distributed by MLS Grid
- 2026-06-03 Coming Soon $450,000 OneKey® MLS as Distributed by MLS Grid
- 2022-09-12 Sold (Public Records) $376,000 Public Records
- 2022-09-08 Sold (MLS) $375,555 OneKey® MLS as Distributed by MLS Grid
- 2022-05-19 Listed $319,000 OneKey® MLS as Distributed by MLS Grid
- 2022-05-19 Listing Removed — OneKey® MLS as Distributed by MLS Grid
- 2021-11-09 Listed $299,000 OneKey® MLS as Distributed by MLS Grid
- 2010-01-29 Sold (Public Records) $302,500 Public Records
- 1994-09-30 Sold (Public Records) $150,000 Public Records
Property tax history
+3.4%/yrLatest (2025): $10,774 · +6.2% YoY. Source: county tax records.
Cash-flow waterfall
monthlySold comps — $/sqft
last 12 mo · ≤1 miLoading sold comps…