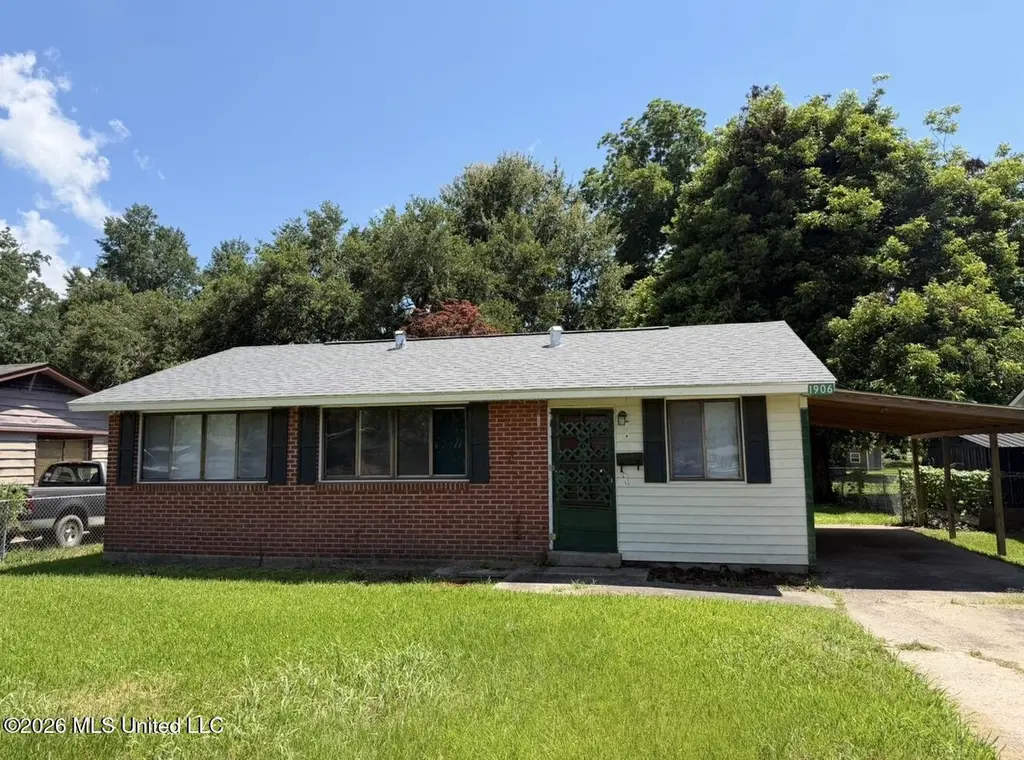
1906 Murray Dr · Vidalia, LA
Flood risk 6/10 · Moderate
- FEMA flood zone
- X (shaded)
- Chance of flooding over 30 yrs
- 0.7%
- Est. flood insurance / yr
- $507 – $1,088
Fire risk 1/10 · Minimal
- Est. fire insurance / yr
- $1,269 – $2,357
Heat risk 8/10 · Major
- Hot days now (above 108°F)
- 7 days/yr
- Hot days in 30 yrs
- 19 days/yr
Wind risk 8/10 · Major
- Chance of severe wind over 30 yrs
- 95.0%
Air-quality risk 1/10 · Minimal
- Unhealthy air days now
- 0 days/yr
- Unhealthy air days in 30 yrs
- 0 days/yr
Risk factors via First Street. Map © Google.
Why this score? — see what drove the C+ grade
The composite is a weighted blend of 9 inputs, each scored 0–100. Each bar is that input's sub-score; the figure is the points it added to the 100-point composite (weight × sub-score).
- Cash flow +21.1/30.0
- ARV discount +12.4/15.0
- Appreciation +8.5/10.0
- DSCR +6.7/10.0
- 1% rule +5.0/10.0
- Livability +3.3/5.0
- Rent growth +2.5/5.0
- Condition / age +2.5/5.0
- Schools +1.8/10.0
$105,000
🖨 Deal sheet (PDF) 📄 Offer letter ✓ Due diligence
Listing remarks MLS
Great 3 bedroom 1 bath house just around the corner from Vidalia High School. Tile floors, granite counter tops and plenty of extra storage. A bonus room could be used for whatever you need. There is a covered patio area and a large, shaded, and fenced back yard for all of your outdoor living. Call and schedule your viewing today! Square footage and property size are from previous listing. Buyer is encouraged to measure. Home is being sold AS IS.
Key facts
- Slab foundation
- Great lot
- Convenient location
Tags
Property features AI
Finance
- Other: Located at 1906 Murray Dr, Vidalia, LA 71373
Exterior
- Parking: Attached carport (1 space)
- Utilities: Public water; Public sewer; Electricity connected; Water connected; Sewer connected
- Home design: Single-family house; One story; Approximately 1,100 building area
- Construction: Vinyl siding; Brick veneer; Composition roof; Slab foundation; Built recently (year not provided)
- Exterior features: Porch; Back yard fence
Interior
- Kitchen: Dishwasher
- Bathrooms: 1 full bathroom
- Heating & cooling: Central heating; Central air; Ceiling fan(s) for cooling
- Interior features: Ceiling fans; Storage
- Laundry & utility: Laundry room
Neighborhood map
What this means for you Summary
Snapshot
- This is a 3-bed/1.0-bath single-family listed at $105k.
Deal economics
- At list price, monthly cash flow is $150 ($2k/yr) — positive.
- The deal already cash-flows at list — no discount required.
- To meet the 1% rule (rent ≥ 1% of price), the offer needs to be $105k (0.1% below list).
- Recommended offer: $105k (0.1% below list) — sets the bar for 1% rule.
Location & tenants
- Location reads 66/100 on livability (#123 in LA) — a middle-class / working-renter tenant base. Strengths: cost of living A+, housing A+; Watch: health & safety C-, crime D-, amenities F.
- Concordia Parish (town): math 19% / reading 27% proficiency, ranked #65 of 98 in LA (top 66%) — low school quality limits family demand, transient renter base, plan for 1-2y turnover; 74% free/reduced lunch — lower-income household profile, screen leases tightly.
- Market conditions: 40 active listings in the ZIP; 27 units permitted in Concordia Parish in 2024 (0 in 5+ unit buildings).
Forward outlook
- In year one you build about $8k of equity ($726 loan paydown + $7k appreciation (7.0% local appreciation)).
- Concordia County population projected at -20% by 2050 — secular population decline; favor cash flow + early exit over multi-decade hold.
- At projected returns (7.0% appreciation + 3.0% rent growth), your $29k cash investment doubles in ~3 years — after that, you're playing with house money.
- By year 5, paydown + projected appreciation supports a ~$36k cash-out refi (75% LTV) — recoverable capital for the next deal without selling this one.
Negotiation context
- Only 11 days on market — expect competitive offers; lowballing is unlikely to land.
- 5 sale attempts since 15y ago with the ask held roughly flat each time — persistent listings suggest the price (not the market) is what's stuck; bring a comps-based counter.
Risks & watch-outs
- Climate carrying-cost: major flood risk; severe wind risk, 95% chance of damaging wind over 30y; extreme-heat days projected 7→19/yr by 2055 (HVAC capex compounding) — expect insurance premiums to compound above CPI over the hold.
Questions for the listing agent
- Is there a deadline driving the sale (1031 exchange, divorce, estate, relocation)? That informs how much negotiation room exists.
- Crime grade is D in this area — have there been break-ins, vandalism, or insurance claims at this property in the last 3 years? What carrier currently insures it and at what premium?
- What's the average days-on-market for RENTAL listings here right now (not sales)? A rising rental-DOM trend means longer vacancies and softer asking-rent achievability than the comps imply.
- What's the recent tenant-quality profile in this submarket — average credit score on applications, eviction rate, late-payment / NSF rate, and stable-employment percentage? A property-management company in the area should have these aggregated.
- How much new for-sale + rental construction is in the pipeline within 1–3 miles? Heavy new supply typically softens prices + rents 12–24 months out; constrained supply supports both.
Investment metrics
- 1% rule
- 1.00% ✗
- Cap rate
- 8.01%
- Cash-on-cash
- 6.13%
- DSCR
- 1.27
- GRM
- 8.3
CMA / ARV
- ARV (on-the-fly)
- $117,700
- Comps found
- 6
Show comp detail 6 sales within ~0.75 mi
| Address | Dist | Beds/Ba | Sqft | Sold | Price | $/sf | Match |
|---|---|---|---|---|---|---|---|
| 1906 Murray Dr | 0.00mi | 3/1.0 | 1,100 (0%) | 13mo | $98,000 | $89 | 89 |
| 2033 Charles St | 0.23mi | 3/1.0 | 1,231 (+12%) | 10mo | $132,500 | $108 | 60 |
| 2061 Eleanor Ave | 0.33mi | 3/1.0 | 1,200 (+9%) | 14mo | $139,000 | $116 | 58 |
| 1201 Palm St | 0.67mi | 3/1.5 | 1,180 (+7%) | 11mo | $105,000 | $89 | 46 |
| 1213 Apple St | 0.64mi | 3/2.0 | 1,236 (+12%) | 8mo | $132,000 | $107 | 39 |
| 1202 Apple St | 0.73mi | 3/2.0 | 1,214 (+10%) | 7mo | $121,000 | $100 | 39 |
Match score weights: distance 35% · size 25% · config 20% · recency 20%. Top-matched comps best support the ARV.
Projected returns pro-forma
6.97% appreciation · 3.0% rent growth · sell at horizon
- IRR
- 22.5%
- Equity multiple
- 2.57×
- Total profit
- $46,043
- Equity at exit
- $72,577
- IRR
- 21.0%
- Equity multiple
- 5.31×
- Total profit
- $126,666
- Equity at exit
- $137,697
Cash invested: $29,400 (down + closing). Projections, not guarantees.
Landlord ↔ Tenant lean methodology
- Overall (STATE)
- 90 Strongly Landlord-Friendly
- State Louisiana
- 90 Strongly Landlord-Friendly · R+12
- County
- — inherits STATE
- City
- — inherits STATE
ZIP-level market 71373
- Home prices YoY
- 6.3%
- Active inventory
- 40
- Price-to-rent
- 8.3×
Monthly cashflow live
- Estimated rent
- $1,049 medium interval (Pro) →
- Mortgage (P&I)
- −$551
- Tax from tax record
- −$84 /mo · $1,010/yr
- Insurance
- −$44
- HOA
- −$0
- Vacancy / Maint / Mgmt
- −$220
- Net cashflow
- $150
Break-even live
Sensitivity live
| Price | -10% $210 | -5% $180 | +0% $150 | +5% $120 | +10% $91 |
|---|---|---|---|---|---|
| Rent | -10% $67 | -5% $109 | +0% $150 | +5% $192 | +10% $233 |
| Rate | -1.0pp $203 | -0.5pp $177 | base $150 | +0.5pp $123 | +1.0pp $95 |
UW: 25.0% down · 7.5% · 30yr · 1.5% tax · 5.0% vac · 8.0% maint · 8.0% mgmt
Financing live
Cash to close
- Down payment
- $26,250
- Closing costs
- $3,150
- Reserves months
- —
- Total cash needed
- —
Loan-product check · same deal, 3 products live
Conventional
25% down · 7.5% · 30yr
- Down + closing
- —
- Monthly P&I
- —
- Monthly cashflow
- —
- DSCR
- —
- Eligible?
- —
Personal DTI + credit; lowest rate.
DSCR
20% down · 8.5% · 30yr
- Down + closing
- —
- Monthly P&I
- —
- Monthly cashflow
- —
- DSCR
- —
- Eligible?
- —
No personal income docs; deal must DSCR.
Hard money
10% down · 12.0% · 12mo
- Down + closing
- —
- Monthly P&I
- —
- Monthly cashflow
- —
- DSCR
- —
- Eligible?
- —
Short-term bridge; refi at stabilization.
Listing history 9 events
-
2026-06-21days on market $105,000 Active 11 DOM
-
2026-06-21days on market $105,000 Active 10 DOM
-
2026-06-18days on market $105,000 Active 8 DOM
-
2026-06-17days on market $105,000 Active 7 DOM
-
2026-06-16days on market $105,000 Active 6 DOM
-
2026-06-15days on market $105,000 Active 5 DOM
-
2026-06-13days on market $105,000 Active 3 DOM
-
2026-06-12remarks 632-char remark
-
2026-06-12$105,000 Active 2 DOM
ⓘ Source: listings_history table (triggers on properties + properties_extension) + one-shot
backfill from property_details.listing_events for pre-trigger history.
Tax reassessment forecast LA · Resets to sale price
- Current annual tax
- $1,010 · $84/mo
- Projected year-2 tax
- $1,010 · $84/mo
- Expected delta
- $0/yr ($0/mo · 0.0%)
ⓘ Screening estimate from a state-policy table — verify with the county assessor before closing.
Climate risk First Street
- Flood 6/10 Major FEMA zone X (shaded) · 70% chance over 30 yrs
- Wildfire 1/10 Low
- Heat 8/10 Severe 7 d/yr ≥108°F today · 19 d/yr by 30 yrs out
- Wind 8/10 Severe 95% chance of damaging wind over 30 yrs
- Air quality 1/10 Low 0 unhealthy d/yr today · 0 by 30 yrs out
Nearby sold comps map
Loading sold comps map…
Walkable amenities ~0.75 mi
Loading nearby amenities…
Taxation est. · year 1
- Rental income
- $12,588
- − Mortgage interest
- −$5,882
- − Property taxes
- −$1,010
- − Insurance
- −$525
- − Repairs & maintenance
- −$1,007
- − Management
- −$1,007
- − Depreciation
- −$3,055
- Taxable income
- $103
- Est. tax owed @ 24.0%
- −$25
- After-tax cash flow
- $1,777/yr
For passive investors: Depreciation is non-cash, so a rental often shows a tax loss while cash-flowing — sheltering income. Rental losses are passive: they offset passive income freely, and up to $25,000/yr can offset ordinary (W-2) income if you actively participate and your MAGI is under $100k (phasing out to $0 by $150k); unused losses carry forward. On sale, claimed depreciation is recaptured at up to 25%, and gains may owe capital-gains tax (a 1031 exchange can defer both). Figures are a year-1 estimate at your 24.0% rate — not tax advice; consult a CPA.
Schools (NCES district)
- District
- Concordia Parish
- NCES district ID
- 2200480
- Math proficiency
- 19% ▼ -39.00%
- Reading proficiency
- 27% ▼ -34.00%
- Median HH income
- $29,931
- Composite
- 18.45/100
- National rank
- #8929
- State rank
- #65 of 98 in LA
Livability — Vidalia
- Score
- 66/100
- State rank
- #123
- US rank
- #11620
Category grades
Schools grade is shown separately in the Schools card above.
Census & demographics
- Census place
- Vidalia, LA
- Population (ZIP)
- 5,754
Population outlook (Concordia County) Hauer SSP2
- Today (2025)
- 18,933 people
- By 2030
- 18,157 · -4.1%
- By 2040
- 16,559 · -12.5%
- By 2050
- 15,067 · -20.4%
- By 2075
- 11,770 · -37.8%
- By 2100
- 8,541 · -54.9%
Race, ethnicity, and origin ACS 2023
- Neighborhood character
- Predominantly White (74%)
- Race & ethnicity
- White 74% Black 24% Hispanic / Latino 1%
- Common ancestry
- Lithuanian 2% Slovak 1%
- Foreign-born
- 1% · Canada
- Languages at home
- 98% English-only · Spanish 1% French/Haitian/Cajun 1%
Political lean MEDSL · Concordia
- 2024 margin
- Strong R (+29.4) · D 34.8% · R 64.1% · Other 1.1%
- 2008→2024 swing
- -9.4pp toward R · 2008: -20.0pp · 2024: -29.4pp
- All cycles
- 2024: R+29.4 2020: R+26.9 2016: R+24.8 2012: R+17.2 2008: R+20.0
Not yet ingested
- Civics
- —
Market trends
- HPI YoY
- ▲ 6.97%
- Current HPI
- 117.3895
- Rent YoY
- —
- Metro
- —
- State GDP YoY
- ▲ 3.29%
- F500 in state
- 10
Industry mix (Fortune 500 HQ in LA)
| Industry | F500 HQs | Revenue |
|---|---|---|
| Telecommunications | 2 | $23B |
|
||
| Utilities | 1 | $12B |
|
||
| Wholesale / Distribution | 1 | $5B |
|
||
| Advertising | 1 | $2B |
|
||
Price history
+42.9% since first listed15 events — show timeline
- 2026-06-10 Listed $105,000 MLSU
- 2025-05-15 Sold (Public Records) $95,400 Public Records
- 2025-05-15 Sold (MLS) — MLSU
- 2025-04-13 Pending — MLSU
- 2025-02-26 Price Changed $98,000 MLSU
- 2024-12-19 Relisted — MLSU
- 2024-12-19 Price Changed $110,000 MLSU
- 2024-12-15 Listing Removed — MLSU
- 2024-12-14 Listing Removed — MLSU
- 2024-06-14 Listed $118,000 MLSU
- 2024-06-14 Listed $118,000 MLSU
- 2011-12-20 Sold (Public Records) $88,000 Public Records
- 2011-12-14 Sold (MLS) — MLSU
- 2011-05-21 Listed $95,000 MLSU
- 2007-12-03 Sold (Public Records) $73,500 Public Records
Property tax history
+1.4%/yrLatest (2025): $1,010 · +18.6% YoY. Source: county tax records.
Cash-flow waterfall
monthlySold comps — $/sqft
last 12 mo · ≤1 miLoading sold comps…