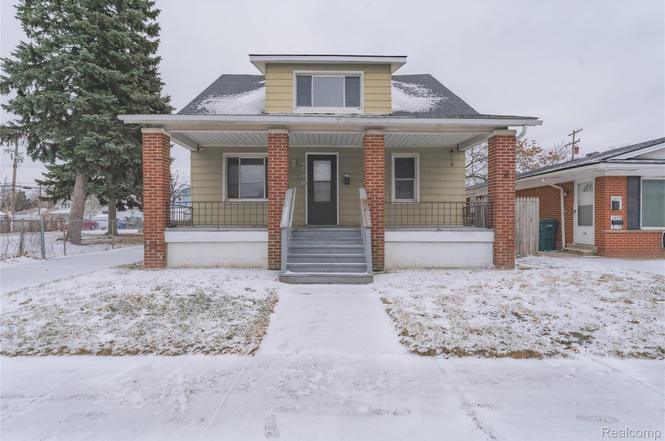
1623 Electric Ave · Lincoln Park, MI
Flood risk 1/10 · Minimal
- FEMA flood zone
- X (unshaded)
- Chance of flooding over 30 yrs
- 0.0%
- Est. flood insurance / yr
- $507 – $1,088
Fire risk 1/10 · Minimal
- Est. fire insurance / yr
- $784 – $1,456
Heat risk 3/10 · Minor
- Hot days now (above 97°F)
- 7 days/yr
- Hot days in 30 yrs
- 15 days/yr
Wind risk 2/10 · Minimal
- Chance of severe wind over 30 yrs
- —
Air-quality risk 3/10 · Minor
- Unhealthy air days now
- 2 days/yr
- Unhealthy air days in 30 yrs
- 4 days/yr
Risk factors via First Street. Map © Google.
Why this score? — see what drove the D+ grade
The composite is a weighted blend of 9 inputs, each scored 0–100. Each bar is that input's sub-score; the figure is the points it added to the 100-point composite (weight × sub-score).
- Cash flow +16.4/30.0
- ARV discount +8.7/15.0
- DSCR +5.1/10.0
- 1% rule +4.4/10.0
- Livability +4.0/5.0
- Rent growth +3.7/5.0
- Condition / age +2.5/5.0
- Schools +2.0/10.0
- Appreciation +0.0/10.0
$169,900
🖨 Deal sheet (PDF) 📄 Offer letter ✓ Due diligence
Listing remarks MLS
4 bedroom 1 bath home with basement and detached garage. Ready for move in. Newly update. Perfect for first time buyer.
Key facts
- 4,792 sq ft lot
- 2 garage spots
- Built 1924
Property features AI
Exterior
- Parking: Detached 2-car garage
- Utilities: Public water; Public sewer
- Home design: Single-family residence; Two levels; Ground-level entry with steps; Above-grade finished area approximately 1,478 square feet; Aluminum siding
- Construction: Block foundation
- Exterior features: Paved road access; Lot approximately 45 x 105 (0.11 acres)
Interior
- Bathrooms: Two full bathrooms
- Heating & cooling: Forced air heating (natural gas); No central air
- Interior features: Unfinished basement; Six total rooms
Neighborhood map
What this means for you Summary
Snapshot
- This is a 4-bed/2.0-bath single-family listed at $170k.
Deal economics
- At list price, monthly cash flow is $97 ($1k/yr) — positive.
- The deal already cash-flows at list — no discount required.
- To meet the 1% rule (rent ≥ 1% of price), the offer needs to be $161k (5.5% below list).
- Recommended offer: $161k (5.5% below list) — sets the bar for 1% rule.
Location & tenants
- Location reads 80/100 on livability (#82 in MI, #1,720 nationally) — a professional / high-income tenant draw. Strengths: amenities A+, commute A+, cost of living A+; Watch: crime F, employment D-.
- Lincoln Park School District (suburban): math 15% / reading 32% proficiency, ranked #440 of 540 in MI (top 82%) — low school quality limits family demand, transient renter base, plan for 1-2y turnover; 72% free/reduced lunch — lower-income household profile, screen leases tightly.
- Zoned schools: Raupp School (math 15% / reading 24%, grade F, #1,091 of 1,397 statewide, top 79%, 293 students, 98% FRL); Lincoln Park Middle School (math 12% / reading 35%, grade F, #399 of 493 statewide, top 81%, 1,105 students, 86% FRL); Lincoln Park High School (math 5% / reading 33%, grade F, #630 of 713 statewide, top 88%, 1,367 students, 79% FRL) — zoned schools average 88% FRL vs 72% district-wide (15 pts higher); higher-poverty schools than district average — tighter screening recommended.
- Market conditions: Rents rising fast (+4.7%/yr); 154 active listings in the ZIP; 7 comparable units currently listed for rent nearby; rentals at typical pace (median 19d on market — plan ~3-4 weeks tenant-placement turnaround); 2,639 units permitted in Wayne County in 2024 (1,216 in 5+ unit buildings).
- This rent runs 33% of the median local income ($59k/yr) — at the standard rent-burdened threshold; future hikes will face affordability resistance.
Forward outlook
- Local home prices are declining (-3.0%/yr); year-one equity from $1k of loan paydown is wiped out by about $5k of value loss. Plan a longer hold.
- Wayne County population projected at -17% by 2050 — secular population decline; favor cash flow + early exit over multi-decade hold.
Negotiation context
- It's been on market 54 days — a 3% lower offer ($165k) is reasonable based on typical stale-listing flexibility.
- 10 sale attempts since 24y ago with the ask held roughly flat each time — persistent listings suggest the price (not the market) is what's stuck; bring a comps-based counter.
- Current owner paid $20k; list at $170k implies a 750% gain — meaningful room to come down on a strong offer.
Risks & watch-outs
- Watch-outs: built in 1924 — expect roof / HVAC / electrical / plumbing capex.
Questions for the listing agent
- It's been on market 54 days. Have you received any prior offers? Is the seller open to a 6% concession, seller financing, or rate buy-down credit?
- Built in 1924 — when were the roof, HVAC, electrical panel, plumbing, and water heater last replaced?
- Is there a deadline driving the sale (1031 exchange, divorce, estate, relocation)? That informs how much negotiation room exists.
- Schools are D-rated, which usually means shorter tenancies and higher turnover. Who's the typical renter profile here, and what's been the actual vacancy rate?
- Crime grade is F in this area — have there been break-ins, vandalism, or insurance claims at this property in the last 3 years? What carrier currently insures it and at what premium?
- The area grade is low — what's the realistic commute time and amenity access for the typical tenant pool here? Any planned neighborhood developments (good or bad) we should know about?
- What's the average days-on-market for RENTAL listings here right now (not sales)? A rising rental-DOM trend means longer vacancies and softer asking-rent achievability than the comps imply.
- What's the recent tenant-quality profile in this submarket — average credit score on applications, eviction rate, late-payment / NSF rate, and stable-employment percentage? A property-management company in the area should have these aggregated.
- How much new for-sale + rental construction is in the pipeline within 1–3 miles? Heavy new supply typically softens prices + rents 12–24 months out; constrained supply supports both.
Investment metrics
- 1% rule
- 0.94% ✗
- Cap rate
- 6.98%
- Cash-on-cash
- 2.44%
- DSCR
- 1.11
- GRM
- 8.8
CMA / ARV
- ARV (on-the-fly)
- $174,404
- Comps found
- 12
Show comp detail 12 sales within ~0.75 mi
| Address | Dist | Beds/Ba | Sqft | Sold | Price | $/sf | Match |
|---|---|---|---|---|---|---|---|
| 864 Cleophus Pkwy | 0.34mi | 4/2.0 | 1,414 (-4%) | 2mo | $230,000 | $163 | 75 |
| 1519 Fort Park Blvd | 0.25mi | 4/2.5 | 1,587 (+7%) | 2mo | $137,000 | $86 | 72 |
| 1133 Mill St | 0.51mi | 3/1.0 (-1) | 1,512 (+2%) | 1mo | $170,000 | $112 | 63 |
| 1472 Philomene Blvd | 0.47mi | 3/2.0 (-1) | 1,574 (+6%) | 1mo | $185,000 | $118 | 62 |
| 850 Montie Rd | 0.53mi | 3/1.5 (-1) | 1,536 (+4%) | 2mo | $94,000 | $61 | 60 |
| 1417 Lincoln Ave | 0.51mi | 3/2.0 (-1) | 1,368 (-7%) | 3mo | $160,000 | $117 | 56 |
| 2933 Fort Park Ave | 0.71mi | 4/2.5 | 1,563 (+6%) | 1mo | $206,000 | $132 | 54 |
| 764 White Ave | 0.50mi | 3/2.0 (-1) | 1,632 (+10%) | 2mo | $185,000 | $113 | 53 |
| 1055 Chandler Ave | 0.63mi | 3/1.0 (-1) | 1,383 (-6%) | 4mo | $172,500 | $125 | 48 |
| 1558 College Ave | 0.68mi | 5/2.0 (+1) | 1,600 (+8%) | 2mo | $200,000 | $125 | 48 |
| 782 Cleveland Ave | 0.59mi | 3/1.0 (-1) | 1,298 (-12%) | 3mo | $160,000 | $123 | 40 |
| 1045 Detroit Ave | 0.72mi | 3/1.5 (-1) | 1,650 (+12%) | 2mo | $181,000 | $110 | 38 |
Match score weights: distance 35% · size 25% · config 20% · recency 20%. Top-matched comps best support the ARV.
Projected returns pro-forma
-3.0% appreciation · 4.65% rent growth · sell at horizon
- IRR
- -10.6%
- Equity multiple
- 0.61×
- Total profit
- $-18,635
- Equity at exit
- $25,333
- IRR
- 0.9%
- Equity multiple
- 1.07×
- Total profit
- $3,300
- Equity at exit
- $14,690
Cash invested: $47,572 (down + closing). Projections, not guarantees.
Landlord ↔ Tenant lean methodology
- Overall (STATE)
- 62 Landlord-Friendly
- State Michigan
- 62 Landlord-Friendly · EVEN
- County
- — inherits STATE
- City
- — inherits STATE
ZIP-level market 48146
- Home prices YoY
- -32.7%
- Rents YoY
- 4.7%
- Active inventory
- 154
- Price-to-rent
- 8.8×
Monthly cashflow live
- Estimated rent
- $1,605 high interval (Pro) →
- Mortgage (P&I)
- −$891
- Tax from tax record
- −$210 /mo · $2,517/yr
- Insurance
- −$71
- HOA
- −$0
- Vacancy / Maint / Mgmt
- −$337
- Net cashflow
- $97
Break-even live
Sensitivity live
| Price | -10% $193 | -5% $145 | +0% $97 | +5% $49 | +10% $1 |
|---|---|---|---|---|---|
| Rent | -10% $-30 | -5% $33 | +0% $97 | +5% $160 | +10% $224 |
| Rate | -1.0pp $182 | -0.5pp $140 | base $97 | +0.5pp $53 | +1.0pp $8 |
UW: 25.0% down · 7.5% · 30yr · 1.5% tax · 5.0% vac · 8.0% maint · 8.0% mgmt
Financing live
Cash to close
- Down payment
- $42,475
- Closing costs
- $5,097
- Reserves months
- —
- Total cash needed
- —
Loan-product check · same deal, 3 products live
Conventional
25% down · 7.5% · 30yr
- Down + closing
- —
- Monthly P&I
- —
- Monthly cashflow
- —
- DSCR
- —
- Eligible?
- —
Personal DTI + credit; lowest rate.
DSCR
20% down · 8.5% · 30yr
- Down + closing
- —
- Monthly P&I
- —
- Monthly cashflow
- —
- DSCR
- —
- Eligible?
- —
No personal income docs; deal must DSCR.
Hard money
10% down · 12.0% · 12mo
- Down + closing
- —
- Monthly P&I
- —
- Monthly cashflow
- —
- DSCR
- —
- Eligible?
- —
Short-term bridge; refi at stabilization.
Rent comps 7 comps
| Address | Beds | Baths | Sqft | Rent | $/sqft | DOM | Units | Dist |
|---|---|---|---|---|---|---|---|---|
| 1473 Empire Ave Lincoln Park, MI | 3.0 | 2.0 | 1342 | $1,700 | $1.27 | 0d | 1 | 0.50mi |
| 3575 S Ethel St Detroit, MI | 3.0 | 1.0 | 894 | $1,350 | $1.51 | 19d | 1 | 0.87mi |
| 1774 College Ave Lincoln Park, MI | 3.0 | 1.0 | 944 | $1,525 | $1.62 | 0d | 1 | 0.95mi |
| 4015 16th St Ecorse, MI | 3.0 | 1.5 | 1170 | $1,300 | $1.11 | 26d | 1 | 0.97mi |
| 4282 7th St Ecorse, MI | 3.0 | 1.0 | 1144 | $1,250 | $1.09 | 26d | 1 | 1.09mi |
| 3801 18th St Ecorse, MI | 3.0 | 1.0 | 1196 | $1,150 | $0.96 | 19d | 1 | 1.28mi |
| 357 Emmons Blvd Lincoln Park, MI | 3.0 | 1.0 | 1268 | $1,695 | $1.34 | 0d | 1 | 1.36mi |
Listing history 34 events
-
2026-06-21days on market $169,900 Active 54 DOM
-
2026-06-18days on market $169,900 Active 51 DOM
-
2026-06-17days on market $169,900 Active 50 DOM
-
2026-06-16days on market $169,900 Active 49 DOM
-
2026-06-15days on market $169,900 Active 48 DOM
-
2026-06-13days on market $169,900 Active 46 DOM
-
2026-06-13days on market $169,900 Active 45 DOM
-
2026-06-09statusdays on market $169,900 Active 42 DOM
-
2026-05-12status Pending 119-char remark
Show marketing remark (119 chars)
4 bedroom 1 bath home with basement and detached garage. Ready for move in. Newly update. Perfect for first time buyer.
-
2026-05-12status Pending
Show marketing remark (119 chars)
4 bedroom 1 bath home with basement and detached garage. Ready for move in. Newly update. Perfect for first time buyer.
-
2026-04-12status Active 119-char remark
Show marketing remark (119 chars)
4 bedroom 1 bath home with basement and detached garage. Ready for move in. Newly update. Perfect for first time buyer.
-
2026-04-12status Active
Show marketing remark (119 chars)
4 bedroom 1 bath home with basement and detached garage. Ready for move in. Newly update. Perfect for first time buyer.
-
2026-03-08status Pending 119-char remark
Show marketing remark (119 chars)
4 bedroom 1 bath home with basement and detached garage. Ready for move in. Newly update. Perfect for first time buyer.
-
2026-03-08status Pending
Show marketing remark (119 chars)
4 bedroom 1 bath home with basement and detached garage. Ready for move in. Newly update. Perfect for first time buyer.
-
2026-02-28historical $1,350
-
2026-02-25$169,900 Active
Show marketing remark (119 chars)
4 bedroom 1 bath home with basement and detached garage. Ready for move in. Newly update. Perfect for first time buyer.
-
2026-02-25$169,900 Active 119-char remark
Show marketing remark (119 chars)
4 bedroom 1 bath home with basement and detached garage. Ready for move in. Newly update. Perfect for first time buyer.
-
2025-11-20price $1,350
-
2025-11-13price $1,395
-
2025-10-31$1,475
-
2012-07-25soldstatus $20,000 184-char remark
Show marketing remark (184 chars)
HUD CASE #261-834824. HUD HOME SOLD AS-IS. HUD MAKES NO REPAIRS. FHA FINANCING NOT AVAILABLE. LEAD BASED PAINT NOTICE ON LINE. EASY ACCESS - USE HUD KEYS. SHOW ANYTIME. NEW HOMES EACH.
-
2012-07-25soldstatus $20,000
Show marketing remark (184 chars)
HUD CASE #261-834824. HUD HOME SOLD AS-IS. HUD MAKES NO REPAIRS. FHA FINANCING NOT AVAILABLE. LEAD BASED PAINT NOTICE ON LINE. EASY ACCESS - USE HUD KEYS. SHOW ANYTIME. NEW HOMES EACH.
-
2012-07-05historical 184-char remark
Show marketing remark (184 chars)
HUD CASE #261-834824. HUD HOME SOLD AS-IS. HUD MAKES NO REPAIRS. FHA FINANCING NOT AVAILABLE. LEAD BASED PAINT NOTICE ON LINE. EASY ACCESS - USE HUD KEYS. SHOW ANYTIME. NEW HOMES EACH.
-
2012-07-05historical
Show marketing remark (184 chars)
HUD CASE #261-834824. HUD HOME SOLD AS-IS. HUD MAKES NO REPAIRS. FHA FINANCING NOT AVAILABLE. LEAD BASED PAINT NOTICE ON LINE. EASY ACCESS - USE HUD KEYS. SHOW ANYTIME. NEW HOMES EACH.
-
2012-06-14$20,000 184-char remark
Show marketing remark (184 chars)
HUD CASE #261-834824. HUD HOME SOLD AS-IS. HUD MAKES NO REPAIRS. FHA FINANCING NOT AVAILABLE. LEAD BASED PAINT NOTICE ON LINE. EASY ACCESS - USE HUD KEYS. SHOW ANYTIME. NEW HOMES EACH.
-
2012-06-14$20,000
Show marketing remark (184 chars)
HUD CASE #261-834824. HUD HOME SOLD AS-IS. HUD MAKES NO REPAIRS. FHA FINANCING NOT AVAILABLE. LEAD BASED PAINT NOTICE ON LINE. EASY ACCESS - USE HUD KEYS. SHOW ANYTIME. NEW HOMES EACH.
-
2010-12-10historical
-
2010-06-23$30,000
-
2003-04-23soldstatus $96,000
-
2003-01-28soldstatus $96,000
-
2003-01-28soldstatus $96,000
-
2002-12-09historical
-
2002-10-31$94,900
-
2002-10-31$94,900
ⓘ Source: listings_history table (triggers on properties + properties_extension) + one-shot
backfill from property_details.listing_events for pre-trigger history.
Tax reassessment forecast MI · Partial reset (capped growth)
- Current annual tax
- $2,517 · $210/mo
- Projected year-2 tax
- $2,567 · $214/mo
- Expected delta
- +$50/yr (+$4/mo · 2.0%)
ⓘ Screening estimate from a state-policy table — verify with the county assessor before closing.
Climate risk First Street
- Flood 1/10 Low FEMA zone X (unshaded) · 0% chance over 30 yrs
- Wildfire 1/10 Low
- Heat 3/10 Moderate 7 d/yr ≥97°F today · 15 d/yr by 30 yrs out
- Wind 2/10 Low
- Air quality 3/10 Moderate 2 unhealthy d/yr today · 4 by 30 yrs out
Nearby sold comps map
Loading sold comps map…
Walkable amenities ~0.75 mi
Loading nearby amenities…
Taxation est. · year 1
- Rental income
- $19,266
- − Mortgage interest
- −$9,517
- − Property taxes
- −$2,517
- − Insurance
- −$850
- − Repairs & maintenance
- −$1,541
- − Management
- −$1,541
- − Depreciation
- −$4,943
- Taxable loss
- −$1,643
- Est. tax savings @ 24.0%
- +$394
- After-tax cash flow
- $1,556/yr
For passive investors: Depreciation is non-cash, so a rental often shows a tax loss while cash-flowing — sheltering income. Rental losses are passive: they offset passive income freely, and up to $25,000/yr can offset ordinary (W-2) income if you actively participate and your MAGI is under $100k (phasing out to $0 by $150k); unused losses carry forward. On sale, claimed depreciation is recaptured at up to 25%, and gains may owe capital-gains tax (a 1031 exchange can defer both). Figures are a year-1 estimate at your 24.0% rate — not tax advice; consult a CPA.
Schools (NCES district)
- District
- Lincoln Park School District
- NCES district ID
- 2621600
- Math proficiency
- 15% ▼ -5.00%
- Reading proficiency
- 32% ▬ 0.00%
- Median HH income
- $41,486
- Composite
- 19.93/100
- National rank
- #8678
- State rank
- #440 of 540 in MI
Livability — Lincoln Park
- Score
- 80/100
- State rank
- #82
- US rank
- #1720
Category grades
Schools grade is shown separately in the Schools card above.
Census & demographics
- Census place
- Lincoln Park, MI
- County
- Wayne County · 1,562,939 people
- City population
- 39,257
- Metro
- Detroit-Warren-Dearborn, MI
- Population (ZIP)
- 39,257
- Household income
- $58,616
- Rent vs Own
- Severe rent burden
- 1142.0
Population outlook (Wayne County) Hauer SSP2
- Today (2025)
- 1,675,273 people
- By 2030
- 1,620,300 · -3.3%
- By 2040
- 1,502,341 · -10.3%
- By 2050
- 1,384,039 · -17.4%
- By 2075
- 1,124,592 · -32.9%
- By 2100
- 881,193 · -47.4%
Race, ethnicity, and origin ACS 2023
- Neighborhood character
- Diverse neighborhood (Simpson 0.57)
- Race & ethnicity
- White 60% Hispanic / Latino 25% Two or more races 12% Black 9% Native American 1%
- Hispanic origin (detail)
- Mexican 19% Puerto Rican 3%
- Common ancestry
- Romanian 6% Lithuanian 4% Slovak 1%
- Foreign-born
- 9% · Canada
- Languages at home
- 80% English-only · Spanish 17% Arabic 2%
Political lean MEDSL · Wayne
- 2024 margin
- Strong D (+29.0) · D 62.7% · R 33.7% · Other 3.6%
- 2008→2024 swing
- -20.5pp toward R · 2008: 49.5pp · 2024: 29.0pp
- All cycles
- 2024: D+29.0 2020: D+38.1 2016: D+37.3 2012: D+46.9 2008: D+49.5
Not yet ingested
- Civics
- —
Market trends
- HPI YoY
- ▼ -108.25%
- Current HPI
- 222.8545
- Rent YoY
- ▲ 4.65%
- Metro
- Detroit-Warren-Dearborn, MI
- State GDP YoY
- ▲ 1.37%
- F500 in state
- 28
Industry mix (Fortune 500 HQ in MI)
| Industry | F500 HQs | Revenue |
|---|---|---|
| Automotive Parts | 3 | $48B |
|
||
| Automotive | 2 | $372B |
|
||
| Chemicals | 1 | $45B |
|
||
| Automotive Retail | 1 | $29B |
|
||
| Healthcare / Medical Devices | 1 | $23B |
|
||
| Automotive Technology | 1 | $20B |
|
||
Price history
-98.6% since first listed26 events — show timeline
- 2026-05-12 Pending — MiRealSource-MiMLS
- 2026-05-12 Pending — REALCOMP
- 2026-04-12 Relisted — MiRealSource-MiMLS
- 2026-04-12 Relisted — REALCOMP
- 2026-03-08 Pending — MiRealSource-MiMLS
- 2026-03-08 Pending — REALCOMP
- 2026-02-28 Rental Removed $1,350 APPFOLIO
- 2026-02-25 Listed $169,900 REALCOMP
- 2026-02-25 Listed $169,900 MiRealSource-MiMLS
- 2025-11-20 Price Changed $1,350 APPFOLIO
- 2025-11-13 Price Changed $1,395 APPFOLIO
- 2025-10-31 Listed for Rent $1,475 APPFOLIO
- 2012-07-25 Sold (MLS) $20,000 MiRealSource-MiMLS
- 2012-07-25 Sold (MLS) $20,000 REALCOMP
- 2012-07-05 Listing Removed — MiRealSource-MiMLS
- 2012-07-05 Listing Removed — REALCOMP
- 2012-06-14 Listed $20,000 MiRealSource-MiMLS
- 2012-06-14 Listed $20,000 REALCOMP
- 2010-12-10 Listing Removed — REALCOMP
- 2010-06-23 Listed $30,000 REALCOMP
- 2003-04-23 Sold (Public Records) $96,000 Public Records
- 2003-01-28 Sold (MLS) $96,000 MiRealSource-MiMLS
- 2003-01-28 Sold (MLS) $96,000 REALCOMP
- 2002-12-09 Listing Removed — MiRealSource-MiMLS
- 2002-10-31 Listed $94,900 MiRealSource-MiMLS
- 2002-10-31 Listed $94,900 REALCOMP
Property tax history
-0.4%/yrLatest (2025): $2,517 · -13.6% YoY. Source: county tax records.
Cash-flow waterfall
monthlySold comps — $/sqft
last 12 mo · ≤1 miLoading sold comps…