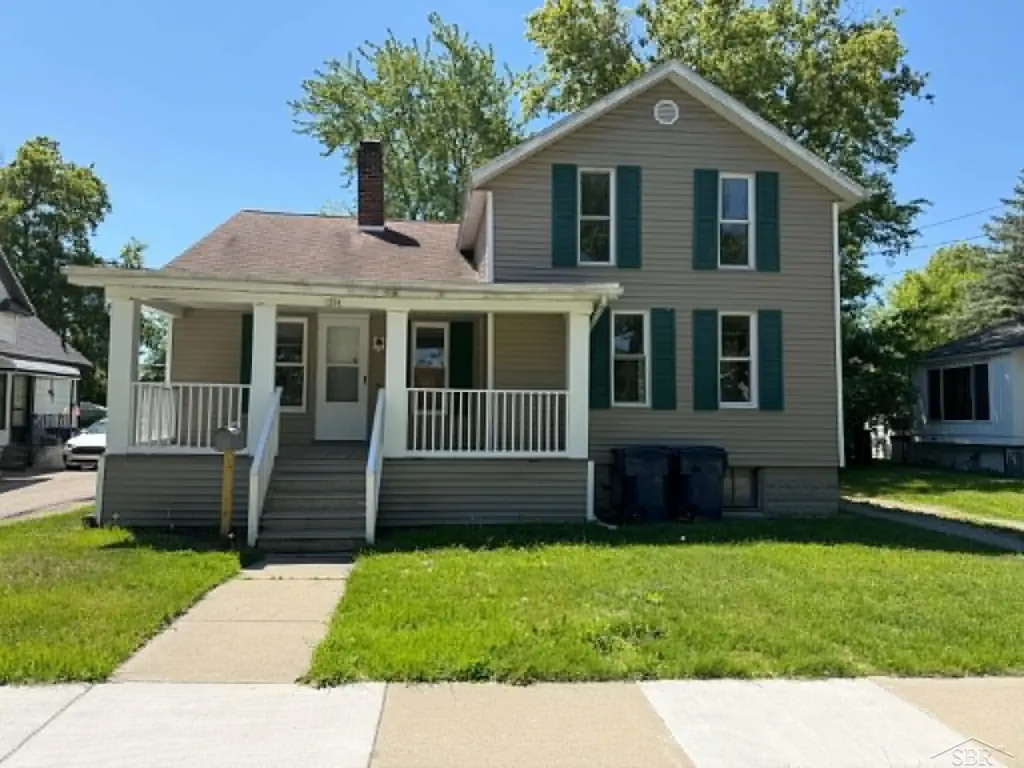
1204 Elm St · Bay City, MI
Flood risk 1/10 · Minimal
- FEMA flood zone
- X (shaded)
- Chance of flooding over 30 yrs
- 0.0%
- Est. flood insurance / yr
- $473 – $860
Fire risk 1/10 · Minimal
- Est. fire insurance / yr
- $784 – $1,456
Heat risk 2/10 · Minimal
- Hot days now (above 96°F)
- 7 days/yr
- Hot days in 30 yrs
- 14 days/yr
Wind risk 1/10 · Minimal
- Chance of severe wind over 30 yrs
- —
Air-quality risk 2/10 · Minimal
- Unhealthy air days now
- 1 days/yr
- Unhealthy air days in 30 yrs
- 2 days/yr
Risk factors via First Street. Map © Google.
Why this score? — see what drove the B grade
The composite is a weighted blend of 9 inputs, each scored 0–100. Each bar is that input's sub-score; the figure is the points it added to the 100-point composite (weight × sub-score).
- Cash flow +30.0/30.0
- ARV discount +12.4/15.0
- DSCR +10.0/10.0
- 1% rule +9.0/10.0
- Livability +3.4/5.0
- Schools +2.8/10.0
- Rent growth +2.5/5.0
- Condition / age +2.5/5.0
- Appreciation +0.0/10.0
$119,900
🖨 Deal sheet (PDF) 📄 Offer letter ✓ Due diligence
Listing remarks MLS
Freshly remodeled 3 bedroom 1.5 bath home in Bay City's westside. Vinyl windows throughout. Completely remodeled bathrooms. Fresh paint and flooring. Open living space. Full basement. Close to shopping and entertainment. All of this at an affordable cost! Call today for your private showing.
Key facts
- Vinyl windows
- Full basement
- Open living space
Tags
Property features AI
Finance
- Other: Lot size approximately 0.12 acres (about 5,009 sqft)
- HOA & community: Homeowners association present
Exterior
- Utilities: Public water; Public sewer
- Home design: Single-family residence; One and one-half story
- Construction: Vinyl siding
- Exterior features: Lot in TREMBLES subdivision; Located at Transit / Sophia (cross streets)
Interior
- Bathrooms: 1 full bathroom; 1 half bathroom
- Heating & cooling: Natural gas heating; Steam heating; No cooling
- Interior features: Total of 4 rooms; Basement present
Neighborhood map
What this means for you Summary
Snapshot
- This is a 3-bed/1.0-bath single-family listed at $120k.
Deal economics
- At list price, monthly cash flow is $573 ($7k/yr) — positive.
- The deal already cash-flows at list — no discount required.
- Meets the 1% rule at list price ($2k rent vs $120k).
- Recommended offer: $118k (1.5% below list) — sets the bar for market timing.
- Cap rate 12.0% vs local median 6.5% in Bay City — top-decile yield for the area; either an underpriced asset or a hidden risk that comps aren't pricing in. Stress-test before assuming the spread holds.
Location & tenants
- Location reads 68/100 on livability (#360 in MI) — a middle-class / working-renter tenant base. Strengths: cost of living A+, housing A+, health & safety A+; Watch: amenities D, crime F, commute F.
- Bay City School District (urban): math 27% / reading 40% proficiency, ranked #317 of 540 in MI (top 59%) — families likely to look elsewhere, expect single-tenant / working-renter base with shorter leases.
- Zoned schools: Handy Middle School (math 17% / reading 33%, grade F, #387 of 493 statewide, top 78%, 685 students, 79% FRL); Bay City Central High School (math 22% / reading 47%, grade F, #372 of 713 statewide, top 56%, 1,033 students, 64% FRL) — zoned schools average 72% FRL vs 44% district-wide (28 pts higher); higher-poverty schools than district average — tighter screening recommended.
- Market conditions: 248 active listings in the ZIP; 1 comparable units currently listed for rent nearby; 39 units permitted in Bay County in 2024 (0 in 5+ unit buildings).
Forward outlook
- Local home prices are declining (-3.0%/yr); year-one equity from $829 of loan paydown is wiped out by about $4k of value loss. Plan a longer hold.
- Bay County population projected at -21% by 2050 — secular population decline; favor cash flow + early exit over multi-decade hold.
- At projected returns (-3.0% appreciation + 3.0% rent growth), your $34k cash investment doubles in ~6 years — after that, you're playing with house money.
Negotiation context
- It's been on market 18 days — a 2% lower offer ($118k) is reasonable based on typical stale-listing flexibility.
- 2 sale attempts with the ask held roughly flat each time — persistent listings suggest the price (not the market) is what's stuck; bring a comps-based counter.
- Current owner paid $55k; list at $120k implies a 118% gain — meaningful room to come down on a strong offer.
Risks & watch-outs
- Watch-outs: built in 1900 — expect roof / HVAC / electrical / plumbing capex.
Questions for the listing agent
- Built in 1900 — when were the roof, HVAC, electrical panel, plumbing, and water heater last replaced?
- Is there a deadline driving the sale (1031 exchange, divorce, estate, relocation)? That informs how much negotiation room exists.
- Schools are D-rated, which usually means shorter tenancies and higher turnover. Who's the typical renter profile here, and what's been the actual vacancy rate?
- Crime grade is F in this area — have there been break-ins, vandalism, or insurance claims at this property in the last 3 years? What carrier currently insures it and at what premium?
- What's the average days-on-market for RENTAL listings here right now (not sales)? A rising rental-DOM trend means longer vacancies and softer asking-rent achievability than the comps imply.
- What's the recent tenant-quality profile in this submarket — average credit score on applications, eviction rate, late-payment / NSF rate, and stable-employment percentage? A property-management company in the area should have these aggregated.
- How much new for-sale + rental construction is in the pipeline within 1–3 miles? Heavy new supply typically softens prices + rents 12–24 months out; constrained supply supports both.
Investment metrics
- 1% rule
- 1.40% ✓
- Cap rate
- 12.02%
- Cash-on-cash
- 20.47%
- DSCR
- 1.91
- GRM
- 6.0
CMA / ARV
- ARV (on-the-fly)
- $134,610
- Comps found
- 12
Show comp detail 12 sales within ~0.75 mi
| Address | Dist | Beds/Ba | Sqft | Sold | Price | $/sf | Match |
|---|---|---|---|---|---|---|---|
| 1304 LENG St | 0.10mi | 3/1.0 | 1,200 (-6%) | 3mo | $98,000 | $82 | 82 |
| 1107 Bradfield St | 0.19mi | 3/1.0 | 1,224 (-4%) | 3mo | $133,500 | $109 | 81 |
| 1106 Lewis St | 0.26mi | 2/1.0 (-1) | 1,203 (-6%) | 3mo | $60,000 | $50 | 70 |
| 301 LaSalle St | 0.43mi | 3/1.0 | 1,250 (-2%) | 8mo | $76,000 | $61 | 69 |
| 407 Ottawa St | 0.19mi | 3/1.5 | 1,458 (+14%) | 1mo | $79,900 | $55 | 65 |
| 402 Patterson Ave | 0.28mi | 3/2.0 | 1,438 (+12%) | 1mo | $151,000 | $105 | 62 |
| 1235 Wellington St | 0.50mi | 3/2.0 | 1,248 (-3%) | 9mo | $141,000 | $113 | 61 |
| 203 Elm St | 0.67mi | 3/1.0 | 1,321 (+3%) | 4mo | $125,000 | $95 | 60 |
| 910 E Murphy St | 0.44mi | 3/2.0 | 1,188 (-7%) | 6mo | $260,000 | $219 | 59 |
| 117 E Smith St | 0.70mi | 3/1.0 | 1,216 (-5%) | 7mo | $102,000 | $84 | 53 |
| 222 E Murphy St | 0.66mi | 3/1.0 | 1,156 (-10%) | 3mo | $212,000 | $183 | 50 |
| 406 E Murphy St | 0.50mi | 4/1.5 (+1) | 1,448 (+13%) | 1mo | $175,000 | $121 | 47 |
Match score weights: distance 35% · size 25% · config 20% · recency 20%. Top-matched comps best support the ARV.
Projected returns pro-forma
-3.0% appreciation · 3.0% rent growth · sell at horizon
- IRR
- 12.7%
- Equity multiple
- 1.51×
- Total profit
- $17,016
- Equity at exit
- $17,877
- IRR
- 21.6%
- Equity multiple
- 2.84×
- Total profit
- $61,684
- Equity at exit
- $10,367
Cash invested: $33,572 (down + closing). Projections, not guarantees.
Landlord ↔ Tenant lean methodology
- Overall (STATE)
- 62 Landlord-Friendly
- State Michigan
- 62 Landlord-Friendly · EVEN
- County
- — inherits STATE
- City
- — inherits STATE
ZIP-level market 48706
- Active inventory
- 248
- Price-to-rent
- 6.0×
Monthly cashflow live
- Estimated rent
- $1,675 medium interval (Pro) →
- Mortgage (P&I)
- −$629
- Tax from tax record
- −$72 /mo · $863/yr
- Insurance
- −$50
- HOA
- −$0
- Vacancy / Maint / Mgmt
- −$352
- Net cashflow
- $573
Break-even live
Sensitivity live
| Price | -10% $640 | -5% $607 | +0% $573 | +5% $539 | +10% $505 |
|---|---|---|---|---|---|
| Rent | -10% $440 | -5% $506 | +0% $573 | +5% $639 | +10% $705 |
| Rate | -1.0pp $633 | -0.5pp $603 | base $573 | +0.5pp $542 | +1.0pp $510 |
UW: 25.0% down · 7.5% · 30yr · 1.5% tax · 5.0% vac · 8.0% maint · 8.0% mgmt
Financing live
Cash to close
- Down payment
- $29,975
- Closing costs
- $3,597
- Reserves months
- —
- Total cash needed
- —
Loan-product check · same deal, 3 products live
Conventional
25% down · 7.5% · 30yr
- Down + closing
- —
- Monthly P&I
- —
- Monthly cashflow
- —
- DSCR
- —
- Eligible?
- —
Personal DTI + credit; lowest rate.
DSCR
20% down · 8.5% · 30yr
- Down + closing
- —
- Monthly P&I
- —
- Monthly cashflow
- —
- DSCR
- —
- Eligible?
- —
No personal income docs; deal must DSCR.
Hard money
10% down · 12.0% · 12mo
- Down + closing
- —
- Monthly P&I
- —
- Monthly cashflow
- —
- DSCR
- —
- Eligible?
- —
Short-term bridge; refi at stabilization.
Rent comps 1 comps
| Address | Beds | Baths | Sqft | Rent | $/sqft | DOM | Units | Dist |
|---|---|---|---|---|---|---|---|---|
| 1305 Washington Ave Bay City, MI | 2.0 | 1.0 | 635 | $1,675 | $2.64 | 45d | 1 | 0.90mi |
Listing history 13 events
-
2026-06-21days on market $119,900 Active 18 DOM
-
2026-06-19days on market $119,900 Active 16 DOM
-
2026-06-18days on market $119,900 Active 15 DOM
-
2026-06-17days on market $119,900 Active 14 DOM
-
2026-06-16statusdays on market $119,900 Active 13 DOM
-
2026-06-15days on market $119,900 Active Under Contract 12 DOM
-
2026-06-14days on market $119,900 Active Under Contract 10 DOM
-
2026-06-12statusdays on market $119,900 Active Under Contract 9 DOM
-
2026-06-09days on market $119,900 Active 6 DOM
-
2026-06-08days on market $119,900 Active 5 DOM
-
2026-06-07days on market $119,900 Active 4 DOM
-
2026-06-03remarks 292-char remark
Show marketing remark (292 chars)
Freshly remodeled 3 bedroom 1.5 bath home in Bay City's westside. Vinyl windows throughout. Completely remodeled bathrooms. Fresh paint and flooring. Open living space. Full basement. Close to shopping and entertainment. All of this at an affordable cost! Call today for your private showing.
-
2026-06-03$119,900 Active 1 DOM
Show marketing remark (292 chars)
Freshly remodeled 3 bedroom 1.5 bath home in Bay City's westside. Vinyl windows throughout. Completely remodeled bathrooms. Fresh paint and flooring. Open living space. Full basement. Close to shopping and entertainment. All of this at an affordable cost! Call today for your private showing.
ⓘ Source: listings_history table (triggers on properties + properties_extension) + one-shot
backfill from property_details.listing_events for pre-trigger history.
Tax reassessment forecast MI · Partial reset (capped growth)
- Current annual tax
- $863 · $72/mo
- Projected year-2 tax
- $1,355 · $113/mo
- Expected delta
- +$492/yr (+$41/mo · 56.9%)
ⓘ Screening estimate from a state-policy table — verify with the county assessor before closing.
Climate risk First Street
- Flood 1/10 Low FEMA zone X (shaded) · 0% chance over 30 yrs
- Wildfire 1/10 Low
- Heat 2/10 Low 7 d/yr ≥96°F today · 14 d/yr by 30 yrs out
- Wind 1/10 Low
- Air quality 2/10 Low 1 unhealthy d/yr today · 2 by 30 yrs out
Nearby sold comps map
Loading sold comps map…
Walkable amenities ~0.75 mi
Loading nearby amenities…
Taxation est. · year 1
- Rental income
- $20,100
- − Mortgage interest
- −$6,716
- − Property taxes
- −$863
- − Insurance
- −$600
- − Repairs & maintenance
- −$1,608
- − Management
- −$1,608
- − Depreciation
- −$3,488
- Taxable income
- $5,217
- Est. tax owed @ 24.0%
- −$1,252
- After-tax cash flow
- $5,619/yr
For passive investors: Depreciation is non-cash, so a rental often shows a tax loss while cash-flowing — sheltering income. Rental losses are passive: they offset passive income freely, and up to $25,000/yr can offset ordinary (W-2) income if you actively participate and your MAGI is under $100k (phasing out to $0 by $150k); unused losses carry forward. On sale, claimed depreciation is recaptured at up to 25%, and gains may owe capital-gains tax (a 1031 exchange can defer both). Figures are a year-1 estimate at your 24.0% rate — not tax advice; consult a CPA.
Schools (NCES district)
- District
- Bay City School District
- NCES district ID
- 2604260
- Math proficiency
- 27% ▼ -8.00%
- Reading proficiency
- 40% ▼ -4.00%
- Median HH income
- $43,833
- Composite
- 28.47/100
- National rank
- #6743
- State rank
- #317 of 540 in MI
Livability — Bay City
- Score
- 68/100
- State rank
- #360
- US rank
- #8912
Category grades
Schools grade is shown separately in the Schools card above.
Census & demographics
- Census place
- Bay City, MI
- City population
- 25,635
- Population (ZIP)
- 38,756
Population outlook (Bay County) Hauer SSP2
- Today (2025)
- 101,476 people
- By 2030
- 98,152 · -3.3%
- By 2040
- 89,711 · -11.6%
- By 2050
- 80,614 · -20.6%
- By 2075
- 60,544 · -40.3%
- By 2100
- 41,603 · -59.0%
Race, ethnicity, and origin ACS 2023
- Neighborhood character
- Predominantly White (90%)
- Race & ethnicity
- White 90% Hispanic / Latino 5% Two or more races 4%
- Common ancestry
- Romanian 16% Lithuanian 9% Slovak 2%
- Foreign-born
- 1%
- Languages at home
- 98% English-only · Spanish 1%
Political lean MEDSL · Bay
- 2024 margin
- R (+14.7) · D 42.0% · R 56.7% · Other 1.3%
- 2008→2024 swing
- -30.0pp toward R · 2008: 15.3pp · 2024: -14.7pp
- All cycles
- 2024: R+14.7 2020: R+11.6 2016: R+12.6 2012: D+6.0 2008: D+15.3
Not yet ingested
- Civics
- —
Market trends
- HPI YoY
- ▼ -133.29%
- Current HPI
- 203.6444
- Rent YoY
- —
- Metro
- —
- State GDP YoY
- ▲ 1.37%
- F500 in state
- 28
Industry mix (Fortune 500 HQ in MI)
| Industry | F500 HQs | Revenue |
|---|---|---|
| Automotive Parts | 3 | $48B |
|
||
| Automotive | 2 | $372B |
|
||
| Chemicals | 1 | $45B |
|
||
| Automotive Retail | 1 | $29B |
|
||
| Healthcare / Medical Devices | 1 | $23B |
|
||
| Automotive Technology | 1 | $20B |
|
||
Price history
+118.0% since first listed3 events — show timeline
- 2026-06-03 Listed $119,900 REALCOMP
- 2026-06-03 Listed $119,900 MiRealSource-MiMLS
- 2025-09-02 Sold (Public Records) $55,000 Public Records
Property tax history
+2.1%/yrLatest (2025): $863 · +3.0% YoY. Source: county tax records.
Cash-flow waterfall
monthlySold comps — $/sqft
last 12 mo · ≤1 miLoading sold comps…