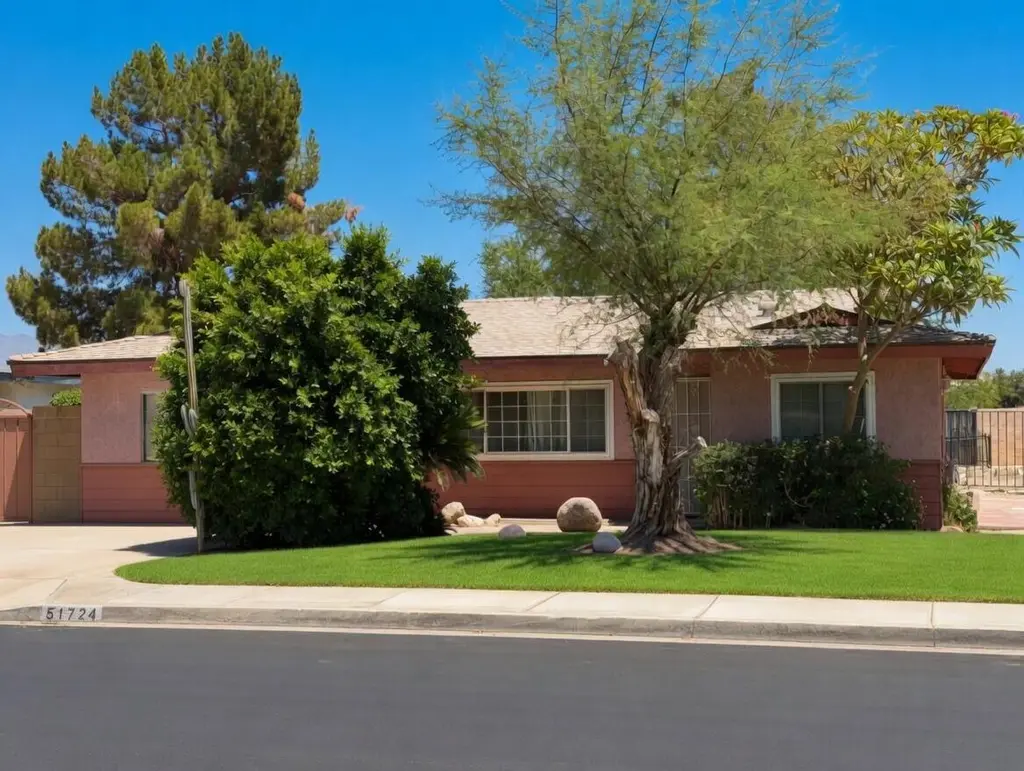
51724 Douma St · Coachella, CA
Flood risk 1/10 · Minimal
- FEMA flood zone
- X (unshaded)
- Chance of flooding over 30 yrs
- 0.0%
- Est. flood insurance / yr
- $507 – $1,088
Fire risk 7/10 · Major
- Est. fire insurance / yr
- $659 – $1,223
Heat risk 10/10 · Severe
- Hot days now (above 115°F)
- 7 days/yr
- Hot days in 30 yrs
- 18 days/yr
Wind risk 1/10 · Minimal
- Chance of severe wind over 30 yrs
- —
Air-quality risk 3/10 · Minor
- Unhealthy air days now
- 3 days/yr
- Unhealthy air days in 30 yrs
- 5 days/yr
Risk factors via First Street. Map © Google.
Why this score? — see what drove the C grade
The composite is a weighted blend of 9 inputs, each scored 0–100. Each bar is that input's sub-score; the figure is the points it added to the 100-point composite (weight × sub-score).
- Cash flow +21.4/30.0
- ARV discount +15.0/15.0
- DSCR +6.8/10.0
- 1% rule +4.6/10.0
- Rent growth +2.5/5.0
- Condition / age +2.5/5.0
- Livability +2.4/5.0
- Schools +1.5/10.0
- Appreciation +0.0/10.0
$300,000
🖨 Deal sheet 📄 Offer letter ✓ Due diligence
Listing remarks
This charming 1964-built family home sits on a generous 5,227 sq. ft. lot in a quiet, established residential neighborhood of Coachella, offering the perfect blend of space, privacy, and convenience. At 1,440 square feet, the single-story layout features two bedrooms, a versatile den that easily converts to a third bedroom or home office, and two bathrooms--ideal for growing families or those seeking flexible living space. While the home is ready for your personal vision, it comes with significant recent upgrades that set it apart: a brand-new roof, HVAC system, and water heater, all installed within the last year. These major systems provide immediate peace of mind and substantial cost sav
Key facts
- Water heater
- Large backyard
- Swimming pool
Tags
Property features AI
Finance
- Other: Will not consider lease; Short term rental status unknown; Located across the street from Bagdouma Park (cross street: Avenue 52)
- Financial info: Listing terms: Conventional, Cash to New Loan, Cash; Sale type: Probate listing; Possession at close of escrow; Property sold as-is
- HOA & community: No monthly association fee
Exterior
- Parking: Driveway with 2 uncovered parking spaces (total 2 spaces)
- Security: No gated community; No specific security system listed
- Utilities: PUD: No; Sewer: Unknown; Natural gas available
- Home design: Detached single family residence; One story
- Construction: Composition roof; Property has major repairs needed; Year built per assessor
- Exterior features: Covered concrete slab patio; Back yard; Block fencing; Park nearby; Park/green belt view; Private in-ground fiberglass pool with pool cover and fenced area
Interior
- Kitchen: Granite counters; Refrigerator; Gas range
- Flooring: Laminate flooring; Tile flooring
- Bathrooms: Two full bathrooms with shower and tub
- Heating & cooling: Forced air heating powered by natural gas; Central air conditioning; Ceiling fan(s); Air conditioning
- Interior features: Unfurnished; Den / Study; Living room; Dining area; Utility room
- Laundry & utility: Laundry in an individual room
Neighborhood map
What this means for you Summary
Snapshot
- This is a 3-bed/2.0-bath single-family listed at $300k.
Deal economics
- At list price, monthly cash flow is $445 ($5k/yr) — positive.
- The deal already cash-flows at list — no discount required.
- To meet the 1% rule (rent ≥ 1% of price), the offer needs to be $289k (3.6% below list).
- Recommended offer: $289k (3.6% below list) — sets the bar for 1% rule.
- Cap rate 8.1% vs local median 4.4% in Coachella — top-decile yield for the area; either an underpriced asset or a hidden risk that comps aren't pricing in. Stress-test before assuming the spread holds.
Location & tenants
- Location reads 47/100 on livability (#1,230 in CA) — a working-class tenant base; expect higher turnover. Watch: schools F, amenities F, commute F.
- Coachella Valley Unified (rural): math 12% / reading 23% proficiency, ranked #481 of 517 in CA (top 93%) — low school quality limits family demand, transient renter base, plan for 1-2y turnover; 79% free/reduced lunch — lower-income household profile, screen leases tightly.
- Market conditions: 103 active listings in the ZIP; 5 comparable units currently listed for rent nearby; rentals lingering (median 44d on market — plan ~5-8 weeks vacancy on turnover, expect pricing pressure); 60% of comp listings sitting > 30 days — soft ceiling on asking rent; 9,195 units permitted in Riverside County in 2024 (1,512 in 5+ unit buildings).
Forward outlook
- Local home prices are declining (-3.0%/yr); year-one equity from $2k of loan paydown is wiped out by about $9k of value loss. Plan a longer hold.
- Riverside County population projected at +22% by 2050 — long-run rental-demand tailwind backs the buy-and-hold thesis.
Negotiation context
- It's been on market 21 days — a 2% lower offer ($296k) is reasonable based on typical stale-listing flexibility.
- 2 sale attempts; this cycle's ask has dropped $45k (13%) from the opening price — seller is motivated, your offer sets the floor, not the list.
Risks & watch-outs
- Climate carrying-cost: major wildfire risk; extreme-heat days projected 7→18/yr by 2055 (HVAC capex compounding) — expect insurance premiums to compound above CPI over the hold.
Questions for the listing agent
- Built in 1964 — when were the roof, HVAC, electrical panel, plumbing, and water heater last replaced?
- Is there a deadline driving the sale (1031 exchange, divorce, estate, relocation)? That informs how much negotiation room exists.
- Schools are F-rated, which usually means shorter tenancies and higher turnover. Who's the typical renter profile here, and what's been the actual vacancy rate?
- What's the average days-on-market for RENTAL listings here right now (not sales)? A rising rental-DOM trend means longer vacancies and softer asking-rent achievability than the comps imply.
- What's the recent tenant-quality profile in this submarket — average credit score on applications, eviction rate, late-payment / NSF rate, and stable-employment percentage? A property-management company in the area should have these aggregated.
- How much new for-sale + rental construction is in the pipeline within 1–3 miles? Heavy new supply typically softens prices + rents 12–24 months out; constrained supply supports both.
Investment metrics
- 1% rule
- 0.96% ✗
- Cap rate
- 8.07%
- Cash-on-cash
- 6.35%
- DSCR
- 1.28
- GRM
- 8.6
CMA / ARV
- ARV (on-the-fly)
- $468,000
- Comps found
- 12
Show comp detail 12 sales within ~0.75 mi
| Address | Dist | Beds/Ba | Sqft | Sold | Price | $/sf | Match |
|---|---|---|---|---|---|---|---|
| 51724 Douma St | 0.00mi | 2/2.0 (-1) | 1,440 (0%) | 1mo | $300,000 | $208 | 94 |
| 84576 Vermouth Dr | 0.24mi | 3/2.0 | 1,401 (-3%) | 1mo | $455,000 | $325 | 83 |
| 52119 Calle Techa | 0.20mi | 4/2.0 (+1) | 1,495 (+4%) | 4mo | $455,000 | $304 | 76 |
| 84734 Damascus Ave | 0.12mi | 3/2.0 | 1,386 (-4%) | 17mo | $310,000 | $224 | 74 |
| 84526 Calle Gregorio | 0.44mi | 3/2.0 | 1,426 (-1%) | 9mo | $415,000 | $291 | 70 |
| 52717 Calle Techa | 0.52mi | 4/2.0 (+1) | 1,445 (+0%) | 1mo | $345,000 | $239 | 70 |
| 84268 Miramar Ct | 0.42mi | 3/2.0 | 1,288 (-11%) | 3mo | $460,000 | $357 | 61 |
| 52755 Calle Avila | 0.56mi | 3/2.0 | 1,434 (-0%) | 15mo | $455,000 | $317 | 60 |
| 84062 Huntington Ave | 0.66mi | 3/2.0 | 1,401 (-3%) | 9mo | $515,000 | $368 | 58 |
| 84098 Huntington Ave | 0.63mi | 3/2.0 | 1,401 (-3%) | 11mo | $490,000 | $350 | 57 |
| 52300 Jennifer Way | 0.51mi | 3/2.0 | 1,262 (-12%) | 1mo | $420,000 | $333 | 55 |
| 51157 Venice Ct | 0.69mi | 3/2.0 | 1,401 (-3%) | 16mo | $470,000 | $335 | 49 |
Match score weights: distance 35% · size 25% · config 20% · recency 20%. Top-matched comps best support the ARV.
Projected returns pro-forma
-3.0% appreciation · 3.0% rent growth · sell at horizon
- IRR
- -6.6%
- Equity multiple
- 0.76×
- Total profit
- $-20,382
- Equity at exit
- $44,731
- IRR
- 3.0%
- Equity multiple
- 1.22×
- Total profit
- $18,325
- Equity at exit
- $25,939
Cash invested: $84,000 (down + closing). Projections, not guarantees.
Landlord ↔ Tenant lean methodology
- Overall (STATE)
- 18 Strongly Tenant-Friendly
- State California
- 18 Strongly Tenant-Friendly · D+13
- County
- — inherits STATE
- City
- — inherits STATE
ZIP-level market 92236
- Home prices YoY
- -5.1%
- Active inventory
- 103
- Price-to-rent
- 8.6×
Monthly cashflow live
- Estimated rent
- $2,891 high interval (Pro) →
- Mortgage (P&I)
- −$1,573
- Tax from tax record
- −$141 /mo · $1,688/yr
- Insurance
- −$125
- HOA
- −$0
- Vacancy / Maint / Mgmt
- −$607
- Net cashflow
- $445
Break-even live
UW: 25.0% down · 7.5% · 30yr · 1.5% tax · 5.0% vac · 8.0% maint · 8.0% mgmt
Financing live
Cash to close
- Down payment
- $75,000
- Closing costs
- $9,000
- Reserves months
- —
- Total cash needed
- —
Loan-product check · same deal, 3 products live
Conventional
25% down · 7.5% · 30yr
- Down + closing
- —
- Monthly P&I
- —
- Monthly cashflow
- —
- DSCR
- —
- Eligible?
- —
Personal DTI + credit; lowest rate.
DSCR
20% down · 8.5% · 30yr
- Down + closing
- —
- Monthly P&I
- —
- Monthly cashflow
- —
- DSCR
- —
- Eligible?
- —
No personal income docs; deal must DSCR.
Hard money
10% down · 12.0% · 12mo
- Down + closing
- —
- Monthly P&I
- —
- Monthly cashflow
- —
- DSCR
- —
- Eligible?
- —
Short-term bridge; refi at stabilization.
Rent comps 5 comps
| Address | Beds | Baths | Sqft | Rent | $/sqft | DOM | Units | Dist |
|---|---|---|---|---|---|---|---|---|
| 52119 Calle Avila Coachella, CA | 3.0 | 2.0 | 960 | $2,375 | $2.47 | 24d | 1 | 0.27mi |
| 50765 Chiapas Dr Coachella, CA | 4.0 | 2.5 | 1656 | $2,900 | $1.75 | 16d | 1 | 0.49mi |
| 50765 Chiapas Dr Coachella, CA | 4.0 | 2.5 | 1656 | $3,000 | $1.81 | 43d | 1 | 0.49mi |
| 85157 Avenida Yucateco Coachella, CA | 3.0 | 2.0 | 1580 | $3,200 | $2.03 | 43d | 1 | 1.27mi |
| 83589 Shadowrock Dr Coachella, CA | 4.0 | 3.0 | 1679 | $4,300 | $2.56 | 43d | 1 | 1.43mi |
Listing history 6 events
-
2026-06-02statusdays on market $300,000 Pending 21 DOM
-
2026-06-01days on market $300,000 Active Under Contract 20 DOM
-
2026-05-31days on market $300,000 Active Under Contract 19 DOM
-
2026-05-13price $300,000
-
2026-05-13status Active Under Contract
-
2026-05-11$345,000 Active
ⓘ Source: listings_history table (triggers on properties + properties_extension) + one-shot
backfill from property_details.listing_events for pre-trigger history.
Tax reassessment forecast CA · Resets to sale price
- Current annual tax
- $1,688 · $141/mo
- Projected year-2 tax
- $2,280 · $190/mo
- Expected delta
- +$592/yr (+$49/mo · 35.1%)
ⓘ Screening estimate from a state-policy table — verify with the county assessor before closing.
Climate risk First Street
- Flood 1/10 Low FEMA zone X (unshaded) · 0% chance over 30 yrs
- Wildfire 7/10 Severe
- Heat 10/10 Extreme 7 d/yr ≥115°F today · 18 d/yr by 30 yrs out
- Wind 1/10 Low
- Air quality 3/10 Moderate 3 unhealthy d/yr today · 5 by 30 yrs out
Nearby sold comps map
Loading sold comps map…
Walkable amenities ~0.75 mi
Loading nearby amenities…
Taxation est. · year 1
- Rental income
- $34,689
- − Mortgage interest
- −$16,805
- − Property taxes
- −$1,688
- − Insurance
- −$1,500
- − Repairs & maintenance
- −$2,775
- − Management
- −$2,775
- − Depreciation
- −$8,727
- Taxable income
- $419
- Est. tax owed @ 24.0%
- −$101
- After-tax cash flow
- $5,237/yr
For passive investors: Depreciation is non-cash, so a rental often shows a tax loss while cash-flowing — sheltering income. Rental losses are passive: they offset passive income freely, and up to $25,000/yr can offset ordinary (W-2) income if you actively participate and your MAGI is under $100k (phasing out to $0 by $150k); unused losses carry forward. On sale, claimed depreciation is recaptured at up to 25%, and gains may owe capital-gains tax (a 1031 exchange can defer both). Figures are a year-1 estimate at your 24.0% rate — not tax advice; consult a CPA.
Schools (NCES district)
- District
- Coachella Valley Unified
- NCES district ID
- 0609070
- Math proficiency
- 12% ▼ -8.00%
- Reading proficiency
- 23% ▼ -6.00%
- Median HH income
- $37,683
- Composite
- 14.62/100
- National rank
- #9408
- State rank
- #481 of 517 in CA
Livability — Coachella
- Score
- 47/100
- State rank
- #1230
- US rank
- #26216
Category grades
Schools grade is shown separately in the Schools card above.
Census & demographics
- Census place
- Coachella, CA
- Population (ZIP)
- 42,884
Population outlook (Riverside County) Hauer SSP2
- Today (2025)
- 2,664,475 people
- By 2030
- 2,802,692 · +5.2%
- By 2040
- 3,050,904 · +14.5%
- By 2050
- 3,256,783 · +22.2%
- By 2075
- 3,655,058 · +37.2%
- By 2100
- 3,766,594 · +41.4%
Race, ethnicity, and origin ACS 2023
- Neighborhood character
- Predominantly Hispanic (97%)
- Race & ethnicity
- Hispanic / Latino 97% Two or more races 47% White 1%
- Hispanic origin (detail)
- Mexican 94%
- Foreign-born
- 39% · Canada
- Languages at home
- 19% English-only · Spanish 81%
Political lean MEDSL · Riverside
- 2024 margin
- Toss-up / Even · D 48.0% · R 49.3% · Other 2.6%
- 2008→2024 swing
- -3.6pp toward R · 2008: 2.3pp · 2024: -1.3pp
- All cycles
- 2024: R+1.3 2020: D+8.0 2016: D+4.3 2012: R+0.4 2008: D+2.3
Not yet ingested
- Civics
- —
Market trends
- HPI YoY
- ▼ -21.87%
- Current HPI
- 406.8857
- Rent YoY
- —
- Metro
- —
- State GDP YoY
- ▲ 3.21%
- F500 in state
- 116
Industry mix (Fortune 500 HQ in CA)
| Industry | F500 HQs | Revenue |
|---|---|---|
| Technology | 27 | $1,492B |
|
||
| Financial Services | 3 | $174B |
|
||
| Retail | 3 | $44B |
|
||
| Insurance | 3 | $26B |
|
||
| Media / Entertainment | 2 | $115B |
|
||
| Pharmaceuticals / Biotech | 2 | $62B |
|
||
Price history
-13.0% since first listed3 events — show timeline
- 2026-05-13 Price Changed $300,000 GPSMLS
- 2026-05-13 Relisted — GPSMLS
- 2026-05-11 Listed $345,000 GPSMLS
Property tax history
+9.8%/yrLatest (2025): $1,688 · +2.1% YoY. Source: county tax records.
Cash-flow waterfall
monthlySold comps — $/sqft
last 12 mo · ≤1 miLoading sold comps…