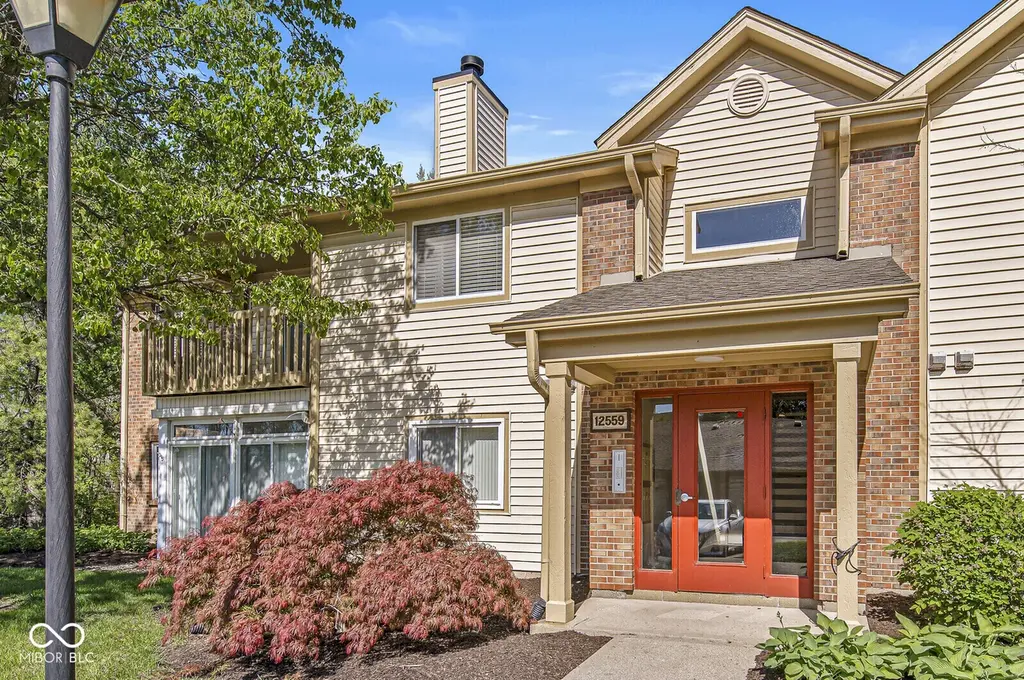
12559 Timber Creek Dr #5 · Carmel, IN
Flood risk 1/10 · Minimal
- FEMA flood zone
- X (unshaded)
- Chance of flooding over 30 yrs
- 0.0%
- Est. flood insurance / yr
- $507 – $1,088
Fire risk 1/10 · Minimal
- Est. fire insurance / yr
- $717 – $1,331
Heat risk 4/10 · Minor
- Hot days now (above 101°F)
- 7 days/yr
- Hot days in 30 yrs
- 18 days/yr
Wind risk 2/10 · Minimal
- Chance of severe wind over 30 yrs
- 0.0%
Air-quality risk 4/10 · Minor
- Unhealthy air days now
- 3 days/yr
- Unhealthy air days in 30 yrs
- 5 days/yr
Risk factors via First Street. Map © Google.
Why this score? — see what drove the D+ grade
The composite is a weighted blend of 9 inputs, each scored 0–100. Each bar is that input's sub-score; the figure is the points it added to the 100-point composite (weight × sub-score).
- Cash flow +15.4/30.0
- ARV discount +7.5/15.0
- Schools +6.4/10.0
- 1% rule +4.8/10.0
- DSCR +4.7/10.0
- Livability +4.2/5.0
- Rent growth +4.1/5.0
- Condition / age +2.5/5.0
- Appreciation +0.0/10.0
$235,000
🖨 Deal sheet 📄 Offer letter ✓ Due diligence
Listing remarks MLS
Come see one of the most tastefully updated properties in desirable Timber Creek. Newer mechanicals, flooring, appliances, paint and much more. 2 bedroom, 2 full bath, vaulted ceiling in Great Room with fireplace. Enjoy morning coffee on your private balcony. Secured entry. Private garage/storage. And this property has one of the best locations in Carmel. Walk to the Monon, Carmel Arts & Design District, the Palladium and Farmer's Market. Storage Room #5 included.
Key facts
- Covered deck
- Pool
- Storage unit
Tags
Neighborhood map
What this means for you Summary
Snapshot
- This is a 3-bed/2.0-bath condo listed at $235k.
Deal economics
- At list price, monthly cash flow is $89 ($1k/yr) — positive.
- The deal already cash-flows at list — no discount required.
- To meet the 1% rule (rent ≥ 1% of price), the offer needs to be $231k (1.6% below list).
- Recommended offer: $231k (1.6% below list) — sets the bar for 1% rule.
- Cap rate 6.7% vs local median 2.7% in Carmel — top-decile yield for the area; either an underpriced asset or a hidden risk that comps aren't pricing in. Stress-test before assuming the spread holds.
Location & tenants
- Location reads 84/100 on livability (#7 in IN, #726 nationally) — a professional / high-income tenant draw. Strengths: schools A+, crime A+, amenities A+; Watch: commute F.
- Carmel Clay Schools (urban): math 68% / reading 70% proficiency, ranked #1 of 301 in IN (top 0%) — acceptable for families but not a draw, mixed tenant base, ~2y average lease; only 7% free/reduced lunch — higher-income household profile.
- Market conditions: Rents rising fast (+6.5%/yr); 340 active listings in the ZIP; 35 comparable units currently listed for rent nearby; rentals leasing fast (median 2d on market — plan ~1-2 weeks tenant-placement turnaround); high-income renter base; 4,661 units permitted in Hamilton County in 2024 (1,528 in 5+ unit buildings).
Forward outlook
- Local home prices are declining (-3.0%/yr); year-one equity from $2k of loan paydown is wiped out by about $7k of value loss. Plan a longer hold.
- Hamilton County population projected at +44% by 2050 — long-run rental-demand tailwind backs the buy-and-hold thesis.
Negotiation context
- Only 7 days on market — expect competitive offers; lowballing is unlikely to land.
- 3 sale attempts since 18y ago with the ask held roughly flat each time — persistent listings suggest the price (not the market) is what's stuck; bring a comps-based counter.
- Current owner paid $104k; list at $235k implies a 126% gain — meaningful room to come down on a strong offer.
Questions for the listing agent
- What does the HOA fee cover, when was the last increase, and are there any pending special assessments or reserve-fund shortfalls?
- Any open or pending special assessments — roof, HVAC, plumbing, elevator, façade? What's the per-unit balance and payoff schedule, and is the seller paying it off at close or rolling it to the buyer?
- Is there a deadline driving the sale (1031 exchange, divorce, estate, relocation)? That informs how much negotiation room exists.
- Schools are A-rated — typically a magnet for longer-tenancy family renters. What's the average tenant stay here, and is there a school-zone premium baked into asking?
- The area grade is low — what's the realistic commute time and amenity access for the typical tenant pool here? Any planned neighborhood developments (good or bad) we should know about?
- What's the average days-on-market for RENTAL listings here right now (not sales)? A rising rental-DOM trend means longer vacancies and softer asking-rent achievability than the comps imply.
- What's the recent tenant-quality profile in this submarket — average credit score on applications, eviction rate, late-payment / NSF rate, and stable-employment percentage? A property-management company in the area should have these aggregated.
- How much new apartment / multifamily construction is in the pipeline within 1–3 miles? Heavy new supply (>2% of stock underway) typically softens rents 12–24 months out; light construction supports rent growth.
Investment metrics
- 1% rule
- 0.98% ✗
- Cap rate
- 6.75%
- Cash-on-cash
- 1.62%
- DSCR
- 1.07
- GRM
- 8.5
CMA / ARV
No comps found within radius.
Projected returns pro-forma
-3.0% appreciation · 6.47% rent growth · sell at horizon
- IRR
- -9.6%
- Equity multiple
- 0.64×
- Total profit
- $-23,967
- Equity at exit
- $35,039
- IRR
- 4.2%
- Equity multiple
- 1.36×
- Total profit
- $23,659
- Equity at exit
- $20,319
Cash invested: $65,800 (down + closing). Projections, not guarantees.
Landlord ↔ Tenant lean methodology
- Overall (STATE)
- 90 Strongly Landlord-Friendly
- State Indiana
- 90 Strongly Landlord-Friendly · R+11
- County
- — inherits STATE
- City
- — inherits STATE
ZIP-level market 46032
- Rents YoY
- 6.5%
- Active inventory
- 340
- Price-to-rent
- 8.5×
Monthly cashflow live
- Estimated rent
- $2,313 high interval (Pro) →
- Mortgage (P&I)
- −$1,232
- Tax from tax record
- −$152 /mo · $1,822/yr
- Insurance
- −$98
- HOA
- −$256
- Vacancy / Maint / Mgmt
- −$486
- Net cashflow
- $89
Break-even live
UW: 25.0% down · 7.5% · 30yr · 1.5% tax · 5.0% vac · 8.0% maint · 8.0% mgmt
Financing live
Cash to close
- Down payment
- $58,750
- Closing costs
- $7,050
- Reserves months
- —
- Total cash needed
- —
Loan-product check · same deal, 3 products live
Conventional
25% down · 7.5% · 30yr
- Down + closing
- —
- Monthly P&I
- —
- Monthly cashflow
- —
- DSCR
- —
- Eligible?
- —
Personal DTI + credit; lowest rate.
DSCR
20% down · 8.5% · 30yr
- Down + closing
- —
- Monthly P&I
- —
- Monthly cashflow
- —
- DSCR
- —
- Eligible?
- —
No personal income docs; deal must DSCR.
Hard money
10% down · 12.0% · 12mo
- Down + closing
- —
- Monthly P&I
- —
- Monthly cashflow
- —
- DSCR
- —
- Eligible?
- —
Short-term bridge; refi at stabilization.
Rent comps 35 comps
| Address | Beds | Baths | Sqft | Rent | $/sqft | DOM | Units | Dist |
|---|---|---|---|---|---|---|---|---|
| 1059 Timber Creek Dr Carmel, IN | 3.0 | 2.0 | 1379 | $1,850 | $1.34 | 43d | 1 | 0.10mi |
| 12484 Breaklines St Carmel, IN | 1.0–3.0 | 1.0–2.0 | 1045 | $2,044 | $1.96 | 1d | 19 | 0.18mi |
| 675 Beacon St Carmel, IN | 1.0–2.0 | 1.0–2.0 | 991 | $2,395 | $2.42 | 1d | 18 | 0.26mi |
| 358 Dartmouth St Carmel, IN | 2.0 | 2.0 | 1188 | $2,095 | $1.76 | 2d | 1 | 0.32mi |
| 301 American Way N Carmel, IN | 1.0–3.0 | 1.0–2.0 | 1167 | $2,980 | $2.55 | 1d | 1 | 0.45mi |
| 300 Providence Blvd Carmel, IN | 1.0–2.0 | 1.0–2.5 | 990 | $2,019 | $2.04 | 1d | 35 | 0.49mi |
| 881 3rd Ave SW Carmel, IN | 1.0–2.0 | 1.0–2.0 | 1135 | $1,999 | $1.76 | 1d | 2 | 0.50mi |
| 400 Industrial Dr Carmel, IN | 1.0–2.0 | 1.0–2.5 | 1175 | $3,570 | $3.04 | 1d | 59 | 0.52mi |
| 833 W Main St Carmel, IN | 1.0–2.0 | 1.0–2.0 | 1304 | $3,485 | $2.67 | 7d | 23 | 0.55mi |
| 880 Monon Green Blvd Carmel, IN | 3.0 | 1.0–2.0 | 1044 | $3,235 | $3.10 | 43d | 5 | 0.59mi |
| 947 Wickham Ct #206 Carmel, IN | 2.0 | 2.0 | 1072 | $1,650 | $1.54 | 2d | 1 | 0.60mi |
| 750 Veterans Way Carmel, IN | 1.0–3.0 | 1.0–2.5 | 1144 | $4,282 | $3.74 | 1d | 1 | 0.61mi |
| 591 Monon Blvd Carmel, IN | 3.0 | 1.0–2.0 | 791 | $2,951 | $3.73 | 1d | 24 | 0.62mi |
| 530 W Main St Carmel, IN | 2.0 | 1.0–1.5 | 875 | $1,412 | $1.61 | 1d | 1 | 0.67mi |
| 1111 W Main St Carmel, IN | 1.0–2.0 | 1.0–2.0 | 932 | $3,224 | $3.46 | 1d | 8 | 0.67mi |
| 720 S Rangeline Rd Carmel, IN | 1.0–2.0 | 1.0–2.0 | 1090 | $3,345 | $3.07 | 1d | 1 | 0.68mi |
| 12415 N Pennsylvania St Carmel, IN | 1.0–2.0 | 1.0–2.0 | 940 | $1,824 | $1.94 | 1d | 21 | 0.79mi |
| 25 Florence St Carmel, IN | 2.0 | 2.5 | 1338 | $2,249 | $1.68 | 10d | 1 | 0.79mi |
| 1225 Veterans Way Carmel, IN | 1.0–2.0 | 1.0–2.0 | 1006 | $2,483 | $2.47 | 1d | 10 | 0.83mi |
| 110 W Main St Carmel, IN | 1.0–3.0 | 1.0–3.0 | 1095 | $3,868 | $3.53 | 1d | 16 | 0.83mi |
| 760 Walkabout Cir E Carmel, IN | 2.0 | 2.0 | 569 | $2,224 | $3.91 | 1d | 24 | 0.84mi |
| 231 Lark Dr #3 Carmel, IN | 2.0 | 1.0 | 925 | $1,195 | $1.29 | 1d | 1 | 0.86mi |
| 110 Bryn Mawr Ln Unit 221-03 Carmel, IN | 2.0 | 1.5 | 876 | $1,499 | $1.71 | 20d | 1 | 0.97mi |
| 110 Bryn Mawr Ln Unit 221-08 Carmel, IN | 2.0 | 1.5 | 876 | $1,499 | $1.71 | 1d | 1 | 0.97mi |
| 110 Bryn Mawr Ln Unit 220-06 Carmel, IN | 2.0 | 2.0 | 876 | $1,499 | $1.71 | 1d | 1 | 0.97mi |
| 110 Bryn Mawr Ln Unit 220-03 Carmel, IN | 2.0 | 2.0 | 876 | $1,429 | $1.63 | 1d | 1 | 0.98mi |
| 110 Bryn Mawr Ln Unit T-203 Carmel, IN | 3.0 | 1.5 | 1280 | $2,199 | $1.72 | 7d | 1 | 0.98mi |
| 221 E Main St Carmel, IN | 1.0–3.0 | 1.0–2.0 | 1010 | $2,099 | $2.08 | 1d | 8 | 1.00mi |
| 13415 Highpointe Blvd Carmel, IN | 1.0–2.0 | 1.0–2.0 | 728 | $1,518 | $2.08 | 1d | 14 | 1.16mi |
| 1685 E 116th St Carmel, IN | 2.0 | 1.0–2.0 | 892 | $2,475 | $2.77 | 1d | 28 | 1.17mi |
| 11405 Central Dr W Carmel, IN | 4.0 | 2.0 | 1408 | $2,600 | $1.85 | 1d | 1 | 1.23mi |
| 741 N Rangeline Rd Carmel, IN | 2.0 | 1.0 | 850 | $1,275 | $1.50 | 1d | 1 | 1.24mi |
| 1825 Jefferson Dr W Carmel, IN | 1.0–3.0 | 1.0–2.5 | 1350 | $2,570 | $1.90 | 1d | 24 | 1.28mi |
| 525 End DR Carmel, IN | 1.0–2.0 | 1.0–2.0 | 955 | $2,380 | $2.49 | 1d | 13 | 1.33mi |
| 945 Mohawk Hills Dr Carmel, IN | 1.0–3.0 | 1.0–2.5 | 1210 | $1,947 | $1.61 | 1d | 33 | 1.40mi |
HOA detail condo
- Monthly dues
- $256 · $3,072/yr
- Assessments
- None detected in remarks — confirm with the listing agent.
Listing history 7 events
-
2026-04-25status Pending
-
2026-04-18$235,000 Active
-
2016-10-12soldstatus $104,000 Sold 478-char remark
Show marketing remark (478 chars)
Come see one of the most tastefully updated properties in desirable Timber Creek. Newer mechanicals, flooring, appliances, paint and much more. 2 bedroom, 2 full bath, vaulted ceiling in Great Room with fireplace. Enjoy morning coffee on your private balcony. Secured entry. Private garage/storage. And this property has one of the best locations in Carmel. Walk to the Monon, Carmel Arts & Design District, the Palladium and Farmer's Market. Storage Room #5 included.
-
2016-08-25status Pending 478-char remark
Show marketing remark (478 chars)
Come see one of the most tastefully updated properties in desirable Timber Creek. Newer mechanicals, flooring, appliances, paint and much more. 2 bedroom, 2 full bath, vaulted ceiling in Great Room with fireplace. Enjoy morning coffee on your private balcony. Secured entry. Private garage/storage. And this property has one of the best locations in Carmel. Walk to the Monon, Carmel Arts & Design District, the Palladium and Farmer's Market. Storage Room #5 included.
-
2016-08-22$105,900 Active 478-char remark
Show marketing remark (478 chars)
Come see one of the most tastefully updated properties in desirable Timber Creek. Newer mechanicals, flooring, appliances, paint and much more. 2 bedroom, 2 full bath, vaulted ceiling in Great Room with fireplace. Enjoy morning coffee on your private balcony. Secured entry. Private garage/storage. And this property has one of the best locations in Carmel. Walk to the Monon, Carmel Arts & Design District, the Palladium and Farmer's Market. Storage Room #5 included.
-
2009-06-02historical
-
2008-06-20$105,000
ⓘ Source: listings_history table (triggers on properties + properties_extension) + one-shot
backfill from property_details.listing_events for pre-trigger history.
Tax reassessment forecast IN · Partial reset (capped growth)
- Current annual tax
- $1,822 · $152/mo
- Projected year-2 tax
- $1,910 · $159/mo
- Expected delta
- +$88/yr (+$7/mo · 4.8%)
ⓘ Screening estimate from a state-policy table — verify with the county assessor before closing.
Climate risk First Street
- Flood 1/10 Low FEMA zone X (unshaded) · 0% chance over 30 yrs
- Wildfire 1/10 Low
- Heat 4/10 Moderate 7 d/yr ≥101°F today · 18 d/yr by 30 yrs out
- Wind 2/10 Low 0% chance of damaging wind over 30 yrs
- Air quality 4/10 Moderate 3 unhealthy d/yr today · 5 by 30 yrs out
Nearby sold comps map
Loading sold comps map…
Walkable amenities ~0.75 mi
Loading nearby amenities…
Taxation est. · year 1
- Rental income
- $27,751
- − Mortgage interest
- −$13,164
- − Property taxes
- −$1,822
- − Insurance
- −$1,175
- − Repairs & maintenance
- −$2,220
- − Management
- −$2,220
- − HOA
- −$3,072
- − Depreciation
- −$6,836
- Taxable loss
- −$2,759
- Est. tax savings @ 24.0%
- +$662
- After-tax cash flow
- $1,727/yr
For passive investors: Depreciation is non-cash, so a rental often shows a tax loss while cash-flowing — sheltering income. Rental losses are passive: they offset passive income freely, and up to $25,000/yr can offset ordinary (W-2) income if you actively participate and your MAGI is under $100k (phasing out to $0 by $150k); unused losses carry forward. On sale, claimed depreciation is recaptured at up to 25%, and gains may owe capital-gains tax (a 1031 exchange can defer both). Figures are a year-1 estimate at your 24.0% rate — not tax advice; consult a CPA.
Schools (NCES district)
- District
- Carmel Clay Schools
- NCES district ID
- 1801200
- Math proficiency
- 68% ▼ -7.00%
- Reading proficiency
- 70% ▼ -7.00%
- Median HH income
- $102,347
- Composite
- 63.54/100
- National rank
- #608
- State rank
- #1 of 301 in IN
Livability — Carmel
- Score
- 84/100
- State rank
- #7
- US rank
- #726
Category grades
Schools grade is shown separately in the Schools card above.
Census & demographics
- Census place
- Carmel, IN
- County
- Hamilton County · 337,479 people
- City population
- 99,910
- Metro
- Indianapolis-Carmel-Anderson, IN
- Population (ZIP)
- 51,515
- Household income
- $132,085
- Rent vs Own
- Severe rent burden
- 1216.0
Population outlook (Hamilton County) Hauer SSP2
- Today (2025)
- 381,938 people
- By 2030
- 417,496 · +9.3%
- By 2040
- 486,684 · +27.4%
- By 2050
- 549,805 · +44.0%
- By 2075
- 687,078 · +79.9%
- By 2100
- 754,495 · +97.5%
Race, ethnicity, and origin ACS 2023
- Neighborhood character
- Predominantly White (77%)
- Race & ethnicity
- White 77% Asian 10% Two or more races 6% Hispanic / Latino 5% Black 4%
- Hispanic origin (detail)
- Mexican 2%
- Common ancestry
- Romanian 4% Lithuanian 3% Slovak 2%
- Foreign-born
- 13% · Canada, China, South Korea
- Languages at home
- 85% English-only · Other Indo-European 4% Spanish 3% Chinese 2%
Political lean MEDSL · Hamilton
- 2024 margin
- Lean R (+6.1) · D 46.0% · R 52.1% · Other 1.9%
- 2008→2024 swing
- +16.2pp toward D · 2008: -22.2pp · 2024: -6.1pp
- All cycles
- 2024: R+6.1 2020: R+6.8 2016: R+19.6 2012: R+34.3 2008: R+22.2
Not yet ingested
- Civics
- —
Market trends
- HPI YoY
- ▼ -248.06%
- Current HPI
- 221.9087
- Rent YoY
- ▲ 6.47%
- Metro
- Indianapolis-Carmel-Anderson, IN
- State GDP YoY
- ▲ 2.90%
- F500 in state
- 18
Industry mix (Fortune 500 HQ in IN)
| Industry | F500 HQs | Revenue |
|---|---|---|
| Industrial Machinery | 2 | $37B |
|
||
| Healthcare | 1 | $177B |
|
||
| Pharmaceuticals | 1 | $45B |
|
||
| Metals / Steel | 1 | $18B |
|
||
| Agriculture | 1 | $17B |
|
||
| Packaging | 1 | $12B |
|
||
Price history
+123.8% since first listed7 events — show timeline
- 2026-04-25 Pending — MIBOR as Distributed by MLS Grid
- 2026-04-18 Listed $235,000 MIBOR as Distributed by MLS Grid
- 2016-10-12 Sold (MLS) $104,000 MIBOR as Distributed by MLS Grid
- 2016-08-25 Pending — MIBOR as Distributed by MLS Grid
- 2016-08-22 Listed $105,900 MIBOR as Distributed by MLS Grid
- 2009-06-02 Listing Removed — MIBOR as Distributed by MLS Grid
- 2008-06-20 Listed $105,000 MIBOR as Distributed by MLS Grid
Property tax history
+0.8%/yrLatest (2025): $1,822 · +4.4% YoY. Source: county tax records.
Cash-flow waterfall
monthlySold comps — $/sqft
last 12 mo · ≤1 miLoading sold comps…