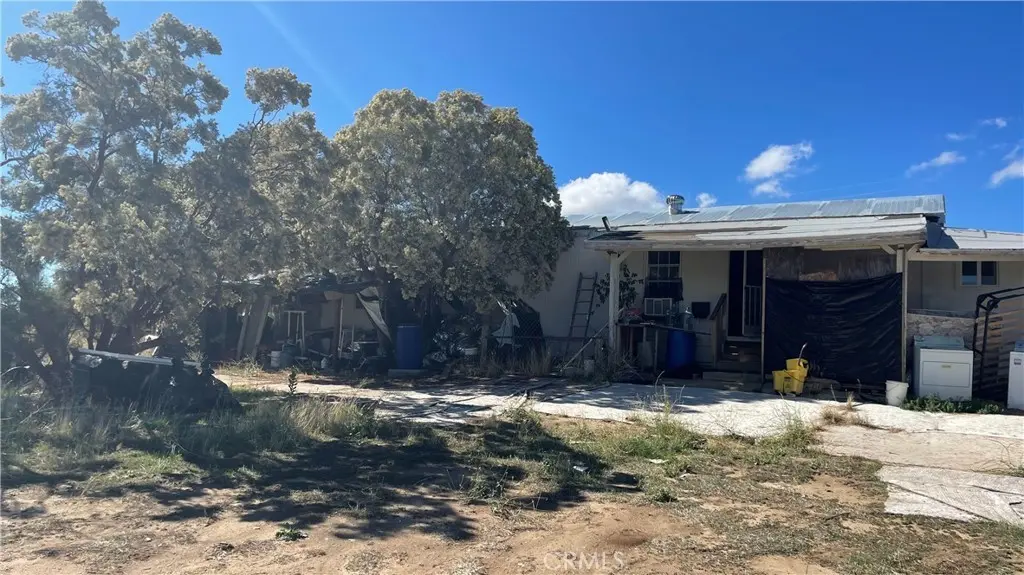
59880 Anzanita Ln · Anza, CA
Flood risk 1/10 · Minimal
- FEMA flood zone
- X (unshaded)
- Chance of flooding over 30 yrs
- 0.0%
- Est. flood insurance / yr
- $507 – $1,088
Fire risk 10/10 · Severe
- Est. fire insurance / yr
- $659 – $1,223
Heat risk 4/10 · Minor
- Hot days now (above 93°F)
- 1 days/yr
- Hot days in 30 yrs
- 3 days/yr
Wind risk 1/10 · Minimal
- Chance of severe wind over 30 yrs
- —
Air-quality risk 4/10 · Minor
- Unhealthy air days now
- 5 days/yr
- Unhealthy air days in 30 yrs
- 7 days/yr
Risk factors via First Street. Map © Google.
Why this score? — see what drove the D+ grade
The composite is a weighted blend of 9 inputs, each scored 0–100. Each bar is that input's sub-score; the figure is the points it added to the 100-point composite (weight × sub-score).
- Cash flow +11.4/30.0
- ARV discount +10.7/15.0
- Appreciation +10.0/10.0
- DSCR +3.3/10.0
- 1% rule +3.2/10.0
- Rent growth +2.5/5.0
- Schools +2.5/10.0
- Condition / age +2.5/5.0
- Livability +2.2/5.0
$198,988
🖨 Deal sheet 📄 Offer letter ✓ Due diligence
Listing remarks MLS
Manufactured Home Built on Mobile home lot with 2 bedroom and 1 bathroom. Approximately 670 sq ft. This manufactured home sits on a flat lot and usable land over 2 acres. Great for farming. There is a private well on this property. Property is fully wood fence. Located on a corner lot. this property to be sold in AS IS present conditions with no repair. This property asking below the market's value, will not last for long. Please call agent for more info.
Key facts
- 2.14 acre lot
- Built 1998
- Listed 276 days
Neighborhood map
What this means for you Summary
Snapshot
- This is a 2-bed/1.0-bath manufactured listed at $199k.
Deal economics
- At list price, monthly cash flow is $-69 ($-833/yr) — negative.
- To cash-flow at today's rent, offer at most $187k (6.2% below list).
- To meet the 1% rule (rent ≥ 1% of price), the offer needs to be $163k (18.2% below list).
- Recommended offer: $163k (18.2% below list) — sets the bar for 1% rule.
- Cap rate 5.9% vs local median 3.5% in Anza — top-decile yield for the area; either an underpriced asset or a hidden risk that comps aren't pricing in. Stress-test before assuming the spread holds.
Location & tenants
- Location reads 45/100 on livability (#1,301 in CA) — a working-class tenant base; expect higher turnover. Strengths: housing A-, crime B; Watch: schools F, amenities F, commute F.
- Hemet Unified (suburban): math 19% / reading 41% proficiency, ranked #360 of 517 in CA (top 70%) — families likely to look elsewhere, expect single-tenant / working-renter base with shorter leases; 66% free/reduced lunch — lower-income household profile, screen leases tightly.
- Market conditions: 155 active listings in the ZIP; 9,195 units permitted in Riverside County in 2024 (1,512 in 5+ unit buildings).
Forward outlook
- In year one you build about $21k of equity ($1k loan paydown + $20k appreciation (10.0% local appreciation)).
- Riverside County population projected at +22% by 2050 — long-run rental-demand tailwind backs the buy-and-hold thesis.
- At projected returns (10.0% appreciation + 3.0% rent growth), your $56k cash investment doubles in ~3 years — after that, you're playing with house money.
- By year 2, paydown + projected appreciation supports a ~$34k cash-out refi (75% LTV) — recoverable capital for the next deal without selling this one.
Negotiation context
- It's been on market 276 days — a 12% lower offer ($175k) is reasonable based on typical stale-listing flexibility.
- 6 sale attempts since 10y ago with the ask held roughly flat each time — persistent listings suggest the price (not the market) is what's stuck; bring a comps-based counter.
Risks & watch-outs
- Climate carrying-cost: severe wildfire risk — expect insurance premiums to compound above CPI over the hold.
Questions for the listing agent
- What do current leases actually rent for vs. the listed asking? Can we see a recent rent roll and the last 12 months of T-12 income?
- It's been on market 276 days. Have you received any prior offers? Is the seller open to a 18% concession, seller financing, or rate buy-down credit?
- Why hasn't it sold? Are there any deal-killer items the seller is aware of (foundation, flood, title, zoning, code violations)?
- Is there a deadline driving the sale (1031 exchange, divorce, estate, relocation)? That informs how much negotiation room exists.
- Schools are F-rated, which usually means shorter tenancies and higher turnover. Who's the typical renter profile here, and what's been the actual vacancy rate?
- The area grade is low — what's the realistic commute time and amenity access for the typical tenant pool here? Any planned neighborhood developments (good or bad) we should know about?
- What's the average days-on-market for RENTAL listings here right now (not sales)? A rising rental-DOM trend means longer vacancies and softer asking-rent achievability than the comps imply.
- What's the recent tenant-quality profile in this submarket — average credit score on applications, eviction rate, late-payment / NSF rate, and stable-employment percentage? A property-management company in the area should have these aggregated.
- How much new for-sale + rental construction is in the pipeline within 1–3 miles? Heavy new supply typically softens prices + rents 12–24 months out; constrained supply supports both.
Investment metrics
- 1% rule
- 0.82% ✗
- Cap rate
- 5.87%
- Cash-on-cash
- -1.50%
- DSCR
- 0.93
- GRM
- 10.2
CMA / ARV
- ARV (median comp)
- $214,224
- List price
- $198,988
- Delta
- -7.11%
- Verdict
- FAIR
- Comps
- 2 within 1.0 mi
Show comp detail 1 sale within ~0.75 mi
| Address | Dist | Beds/Ba | Sqft | Sold | Price | $/sf | Match |
|---|---|---|---|---|---|---|---|
| 60815 Burnt Valley Rd | 0.61mi | 2/2.0 | 768 (+15%) | 6mo | $325,000 | $423 | 38 |
Match score weights: distance 35% · size 25% · config 20% · recency 20%. Top-matched comps best support the ARV.
Projected returns pro-forma
10.0% appreciation · 3.0% rent growth · sell at horizon
- IRR
- 23.2%
- Equity multiple
- 2.87×
- Total profit
- $103,963
- Equity at exit
- $179,264
- IRR
- 20.7%
- Equity multiple
- 6.56×
- Total profit
- $309,658
- Equity at exit
- $386,590
Cash invested: $55,717 (down + closing). Projections, not guarantees.
Landlord ↔ Tenant lean methodology
- Overall (STATE)
- 18 Strongly Tenant-Friendly
- State California
- 18 Strongly Tenant-Friendly · D+13
- County
- — inherits STATE
- City
- — inherits STATE
ZIP-level market 92539
- Home prices YoY
- 16.5%
- Active inventory
- 155
- Price-to-rent
- 10.2×
Monthly cashflow live
- Estimated rent
- $1,628 medium interval (Pro) →
- Mortgage (P&I)
- −$1,044
- Tax from tax record
- −$229 /mo · $2,747/yr
- Insurance
- −$83
- HOA
- −$0
- Vacancy / Maint / Mgmt
- −$342
- Net cashflow
- $-69
Break-even live
UW: 25.0% down · 7.5% · 30yr · 1.5% tax · 5.0% vac · 8.0% maint · 8.0% mgmt
Financing live
Cash to close
- Down payment
- $49,747
- Closing costs
- $5,970
- Reserves months
- —
- Total cash needed
- —
Loan-product check · same deal, 3 products live
Conventional
25% down · 7.5% · 30yr
- Down + closing
- —
- Monthly P&I
- —
- Monthly cashflow
- —
- DSCR
- —
- Eligible?
- —
Personal DTI + credit; lowest rate.
DSCR
20% down · 8.5% · 30yr
- Down + closing
- —
- Monthly P&I
- —
- Monthly cashflow
- —
- DSCR
- —
- Eligible?
- —
No personal income docs; deal must DSCR.
Hard money
10% down · 12.0% · 12mo
- Down + closing
- —
- Monthly P&I
- —
- Monthly cashflow
- —
- DSCR
- —
- Eligible?
- —
Short-term bridge; refi at stabilization.
Listing history 24 events
-
2026-05-31days on market $198,988 Active 276 DOM
-
2025-08-28$198,988 Active 459-char remark
Show marketing remark (459 chars)
Manufactured Home Built on Mobile home lot with 2 bedroom and 1 bathroom. Approximately 670 sq ft. This manufactured home sits on a flat lot and usable land over 2 acres. Great for farming. There is a private well on this property. Property is fully wood fence. Located on a corner lot. this property to be sold in AS IS present conditions with no repair. This property asking below the market's value, will not last for long. Please call agent for more info.
-
2025-08-25historical $198,988 459-char remark
Show marketing remark (459 chars)
Manufactured Home Built on Mobile home lot with 2 bedroom and 1 bathroom. Approximately 670 sq ft. This manufactured home sits on a flat lot and usable land over 2 acres. Great for farming. There is a private well on this property. Property is fully wood fence. Located on a corner lot. this property to be sold in AS IS present conditions with no repair. This property asking below the market's value, will not last for long. Please call agent for more info.
-
2025-06-28historical
-
2024-12-22price $228,000
-
2023-10-29price $218,000
-
2023-10-29$200,000 Active
-
2021-02-20historical
-
2020-08-20$330,000 Active
-
2019-03-25soldstatus $200,000 Closed Sale
-
2019-03-25soldstatus $200,000
-
2019-03-14status Pending Sale
-
2019-03-14price $200,000
-
2019-03-09status Active
-
2019-03-09historical Hold Do Not Show
-
2019-02-16status Pending Sale
-
2019-02-14historical Hold Do Not Show
-
2019-02-14historical Hold Do Not Show
-
2019-02-08$299,000 Active
-
2016-04-01soldstatus $140,000 Closed Sale
-
2016-04-01soldstatus $140,000
-
2016-03-03status Pending Sale
-
2016-02-13$138,000 Active
-
1982-03-01soldstatus $18,000
ⓘ Source: listings_history table (triggers on properties + properties_extension) + one-shot
backfill from property_details.listing_events for pre-trigger history.
Tax reassessment forecast CA · Resets to sale price
- Current annual tax
- $2,747 · $229/mo
- Projected year-2 tax
- $2,747 · $229/mo
- Expected delta
- $0/yr ($0/mo · 0.0%)
ⓘ Screening estimate from a state-policy table — verify with the county assessor before closing.
Climate risk First Street
- Flood 1/10 Low FEMA zone X (unshaded) · 0% chance over 30 yrs
- Wildfire 10/10 Extreme
- Heat 4/10 Moderate 1 d/yr ≥93°F today · 3 d/yr by 30 yrs out
- Wind 1/10 Low
- Air quality 4/10 Moderate 5 unhealthy d/yr today · 7 by 30 yrs out
Nearby sold comps map
Loading sold comps map…
Walkable amenities ~0.75 mi
Loading nearby amenities…
Taxation est. · year 1
- Rental income
- $19,532
- − Mortgage interest
- −$11,146
- − Property taxes
- −$2,747
- − Insurance
- −$995
- − Repairs & maintenance
- −$1,563
- − Management
- −$1,563
- − Depreciation
- −$5,789
- Taxable loss
- −$4,270
- Est. tax savings @ 24.0%
- +$1,025
- After-tax cash flow
- $191/yr
For passive investors: Depreciation is non-cash, so a rental often shows a tax loss while cash-flowing — sheltering income. Rental losses are passive: they offset passive income freely, and up to $25,000/yr can offset ordinary (W-2) income if you actively participate and your MAGI is under $100k (phasing out to $0 by $150k); unused losses carry forward. On sale, claimed depreciation is recaptured at up to 25%, and gains may owe capital-gains tax (a 1031 exchange can defer both). Figures are a year-1 estimate at your 24.0% rate — not tax advice; consult a CPA.
Schools (NCES district)
- District
- Hemet Unified
- NCES district ID
- 0616920
- Math proficiency
- 19% ▼ -3.00%
- Reading proficiency
- 41% ▲ 4.00%
- Median HH income
- $39,962
- Composite
- 25.16/100
- National rank
- #7517
- State rank
- #360 of 517 in CA
Livability — Anza
- Score
- 45/100
- State rank
- #1301
- US rank
- #26600
Category grades
Schools grade is shown separately in the Schools card above.
Census & demographics
- Census place
- Anza, CA
- Population (ZIP)
- 3,480
Population outlook (Riverside County) Hauer SSP2
- Today (2025)
- 2,664,475 people
- By 2030
- 2,802,692 · +5.2%
- By 2040
- 3,050,904 · +14.5%
- By 2050
- 3,256,783 · +22.2%
- By 2075
- 3,655,058 · +37.2%
- By 2100
- 3,766,594 · +41.4%
Race, ethnicity, and origin ACS 2023
- Neighborhood character
- Diverse neighborhood (Simpson 0.57)
- Race & ethnicity
- White 54% Hispanic / Latino 36% Two or more races 16% Asian 8% Native American 4%
- Hispanic origin (detail)
- Mexican 34%
- Common ancestry
- Italian 6% Lithuanian 4% Slovak 3%
- Foreign-born
- 12% · Canada, South Korea, China
- Languages at home
- 66% English-only · Spanish 26% Korean 4% Chinese 2%
Political lean MEDSL · Riverside
- 2024 margin
- Toss-up / Even · D 48.0% · R 49.3% · Other 2.6%
- 2008→2024 swing
- -3.6pp toward R · 2008: 2.3pp · 2024: -1.3pp
- All cycles
- 2024: R+1.3 2020: D+8.0 2016: D+4.3 2012: R+0.4 2008: D+2.3
Not yet ingested
- Civics
- —
Market trends
- HPI YoY
- ▲ 46.58%
- Current HPI
- 329.4083
- Rent YoY
- —
- Metro
- —
- State GDP YoY
- ▲ 3.21%
- F500 in state
- 116
Industry mix (Fortune 500 HQ in CA)
| Industry | F500 HQs | Revenue |
|---|---|---|
| Technology | 27 | $1,492B |
|
||
| Financial Services | 3 | $174B |
|
||
| Retail | 3 | $44B |
|
||
| Insurance | 3 | $26B |
|
||
| Media / Entertainment | 2 | $115B |
|
||
| Pharmaceuticals / Biotech | 2 | $62B |
|
||
Price history
+1005.5% since first listed23 events — show timeline
- 2025-08-28 Listed $198,988 CRMLS
- 2025-08-25 Coming Soon $198,988 CRMLS
- 2025-06-28 Listing Removed — CRMLS
- 2024-12-22 Price Changed $228,000 CRMLS
- 2023-10-29 Price Changed $218,000 CRMLS
- 2023-10-29 Listed $200,000 CRMLS
- 2021-02-20 Listing Removed — CRMLS
- 2020-08-20 Listed $330,000 CRMLS
- 2019-03-25 Sold (Public Records) $200,000 Public Records
- 2019-03-25 Sold (MLS) $200,000 CRMLS
- 2019-03-14 Pending — CRMLS
- 2019-03-14 Price Changed $200,000 CRMLS
- 2019-03-09 Relisted — CRMLS
- 2019-03-09 Delisted — CRMLS
- 2019-02-16 Pending — CRMLS
- 2019-02-14 Delisted — CRMLS
- 2019-02-14 Delisted — CRMLS
- 2019-02-08 Listed $299,000 CRMLS
- 2016-04-01 Sold (Public Records) $140,000 Public Records
- 2016-04-01 Sold (MLS) $140,000 CRMLS
- 2016-03-03 Pending — CRMLS
- 2016-02-13 Listed $138,000 CRMLS
- 1982-03-01 Sold (Public Records) $18,000 Public Records
Property tax history
+8.2%/yrLatest (2025): $2,747 · -16.8% YoY. Source: county tax records.
Cash-flow waterfall
monthlySold comps — $/sqft
last 12 mo · ≤1 miLoading sold comps…