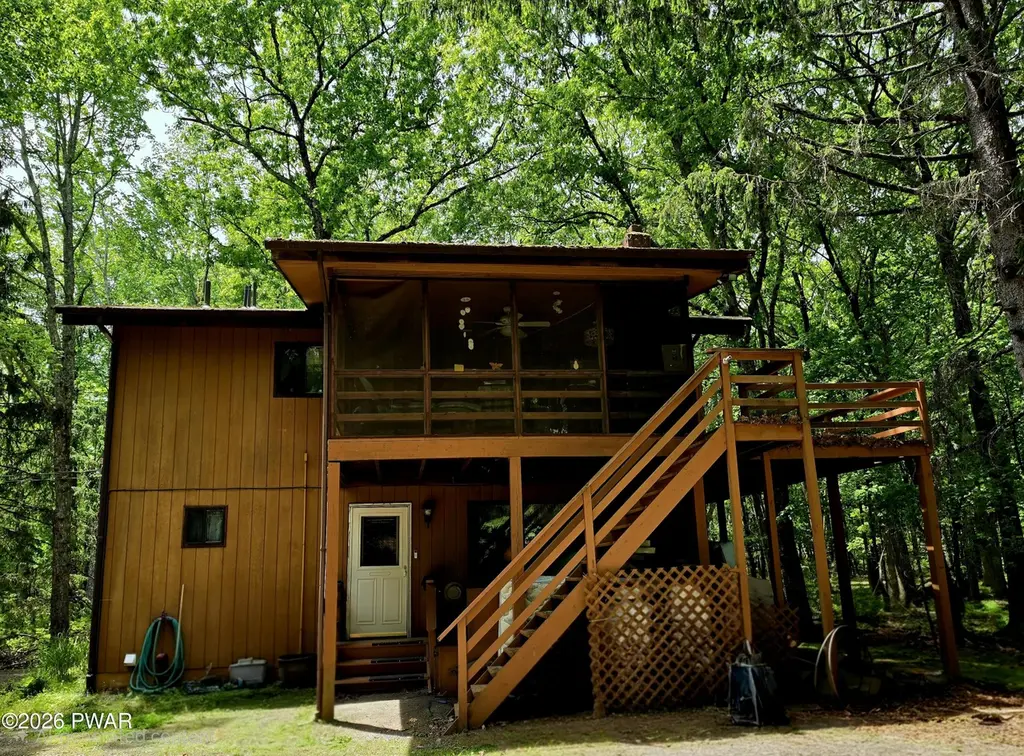
104 Boulder Dr · Hemlock Farms, PA
Flood risk 1/10 · Minimal
- FEMA flood zone
- X (unshaded)
- Chance of flooding over 30 yrs
- 0.0%
- Est. flood insurance / yr
- $473 – $860
Fire risk 4/10 · Minor
- Est. fire insurance / yr
- $511 – $949
Heat risk 2/10 · Minimal
- Hot days now (above 91°F)
- 7 days/yr
- Hot days in 30 yrs
- 15 days/yr
Wind risk 3/10 · Minor
- Chance of severe wind over 30 yrs
- 5.0%
Air-quality risk 2/10 · Minimal
- Unhealthy air days now
- 1 days/yr
- Unhealthy air days in 30 yrs
- 2 days/yr
Risk factors via First Street. Map © Google.
Why this score? — see what drove the A grade
The composite is a weighted blend of 9 inputs, each scored 0–100. Each bar is that input's sub-score; the figure is the points it added to the 100-point composite (weight × sub-score).
- Cash flow +30.0/30.0
- ARV discount +15.0/15.0
- 1% rule +10.0/10.0
- DSCR +10.0/10.0
- Appreciation +10.0/10.0
- Schools +4.2/10.0
- Livability +3.4/5.0
- Rent growth +2.5/5.0
- Condition / age +2.5/5.0
$209,000
🖨 Deal sheet (PDF) 📄 Offer letter ✓ Due diligence
Listing remarks
Located in Hemlock Farms Community this property is waiting for new owners to update and let the fun and new memories begin. The lower level has a large family room, 2 bedrooms and full bath. Upstairs is the open living area with living room, with fireplace, dining area and kitchen opening to screen porch and deck. Also on the upper level is a primary suite with a full bath. Located close to the front gate and not far from clubhouse and Elm Beach this is a very convenient location. Wallenpaupack Area School District See you in The Poconos!
Key facts
- Large family room
- Primary suite
- Open living area
Tags
Property features AI
Finance
- HOA & community: Part of Hemlock Farms community association; Association amenities include pool, indoor pool, tennis courts, basketball court, trails, playground, clubhouse, gated entrance, security, beach access and beach rights, pond; Annual association fee; One-time association fee
Exterior
- Security: Gated community with guard; Association security
- Utilities: Septic tank
- Home design: Single family residence; Two levels
- Exterior features: Deck; Screened porch; Porch; Community lake view; Association pool
Interior
- Kitchen: Range; Refrigerator
- Flooring: Carpet; Tile; Vinyl
- Bathrooms: 2 full bathrooms
- Heating & cooling: Electric heating; Propane heating; Ceiling fan cooling; Wall unit cooling
- Interior features: Ceiling fans; Laminate counters; Living room fireplace
- Laundry & utility: Laundry room on lower level; Dryer
Neighborhood map
What this means for you Summary
Snapshot
- This is a 3-bed/2.0-bath single-family listed at $209k.
Deal economics
- At list price, monthly cash flow is $986 ($12k/yr) — positive.
- The deal already cash-flows at list — no discount required.
- Meets the 1% rule at list price ($3k rent vs $209k).
- Recommended offer: $206k (1.5% below list) — sets the bar for market timing.
- Cap rate 12.0% vs local median 6.9% in Hemlock Farms — top-decile yield for the area; either an underpriced asset or a hidden risk that comps aren't pricing in. Stress-test before assuming the spread holds.
Location & tenants
- Location reads 68/100 on livability (#884 in PA) — a middle-class / working-renter tenant base. Strengths: crime A+, housing A+, health & safety A+; Watch: schools C-, amenities F, commute F.
- Wallenpaupack Area SD (rural): math 39% / reading 59% proficiency, ranked #192 of 539 in PA (top 36%) — families likely to look elsewhere, expect single-tenant / working-renter base with shorter leases.
- Market conditions: 374 active listings in the ZIP; 5 comparable units currently listed for rent nearby; rentals leasing fast (median 3d on market — plan ~1-2 weeks tenant-placement turnaround); 213 units permitted in Pike County in 2024 (0 in 5+ unit buildings).
Forward outlook
- In year one you build about $22k of equity ($1k loan paydown + $21k appreciation (10.0% local appreciation)).
- Pike County population projected at -25% by 2050 — secular population decline; favor cash flow + early exit over multi-decade hold.
- At projected returns (10.0% appreciation + 3.0% rent growth), your $59k cash investment doubles in ~2 years — after that, you're playing with house money.
- By year 2, paydown + projected appreciation supports a ~$36k cash-out refi (75% LTV) — recoverable capital for the next deal without selling this one.
Negotiation context
- It's been on market 20 days — a 2% lower offer ($206k) is reasonable based on typical stale-listing flexibility.
- Current owner paid $115k; list at $209k implies a 82% gain — meaningful room to come down on a strong offer.
Questions for the listing agent
- What does the HOA fee cover, when was the last increase, and are there any pending special assessments or reserve-fund shortfalls?
- Is there a deadline driving the sale (1031 exchange, divorce, estate, relocation)? That informs how much negotiation room exists.
- What's the average days-on-market for RENTAL listings here right now (not sales)? A rising rental-DOM trend means longer vacancies and softer asking-rent achievability than the comps imply.
- What's the recent tenant-quality profile in this submarket — average credit score on applications, eviction rate, late-payment / NSF rate, and stable-employment percentage? A property-management company in the area should have these aggregated.
- How much new for-sale + rental construction is in the pipeline within 1–3 miles? Heavy new supply typically softens prices + rents 12–24 months out; constrained supply supports both.
Investment metrics
- 1% rule
- 1.63% ✓
- Cap rate
- 11.95%
- Cash-on-cash
- 20.22%
- DSCR
- 1.90
- GRM
- 5.1
CMA / ARV
- ARV (on-the-fly)
- $324,816
- Comps found
- 12
Show comp detail 12 sales within ~0.75 mi
| Address | Dist | Beds/Ba | Sqft | Sold | Price | $/sf | Match |
|---|---|---|---|---|---|---|---|
| 809 Boulder Ct | 0.19mi | 3/2.0 | 1,536 (-5%) | 3mo | $620,000 | $404 | 80 |
| 101 Surrey Dr | 0.35mi | 3/2.0 | 1,566 (-3%) | 10mo | $243,000 | $155 | 70 |
| 109 Bluestone Dr | 0.41mi | 3/2.0 | 1,500 (-7%) | 3mo | $255,000 | $170 | 66 |
| 105 Longridge Dr | 0.64mi | 3/2.0 | 1,692 (+5%) | 3mo | $340,000 | $201 | 60 |
| 101 Tupelo Dr | 0.50mi | 3/2.0 | 1,536 (-5%) | 11mo | $333,000 | $217 | 59 |
| 137 Remuda Dr | 0.70mi | 3/2.5 | 1,664 (+3%) | 5mo | $280,000 | $168 | 57 |
| 103 Blue Shelf Ln | 0.35mi | 3/2.0 | 1,424 (-12%) | 12mo | $311,000 | $218 | 54 |
| 802 Rimrock Ct Unit 802 Rimrock Lane, Hawley, PA 18428 | 0.67mi | 4/2.5 (+1) | 1,728 (+7%) | 1mo | $345,000 | $200 | 50 |
| 101 Ridgeway Dr | 0.63mi | 3/2.0 | 1,420 (-12%) | 6mo | $292,500 | $206 | 46 |
| 106 Basswood Dr | 0.71mi | 3/2.0 | 1,800 (+11%) | 10mo | $270,000 | $150 | 39 |
| 106 Palomino Ln | 0.74mi | 4/2.0 (+1) | 1,375 (-15%) | 0mo | $294,000 | $214 | 35 |
| 220 Surrey Dr | 0.74mi | 3/1.5 | 1,820 (+13%) | 13mo | $330,000 | $181 | 31 |
Match score weights: distance 35% · size 25% · config 20% · recency 20%. Top-matched comps best support the ARV.
Projected returns pro-forma
10.0% appreciation · 3.0% rent growth · sell at horizon
- IRR
- 39.4%
- Equity multiple
- 4.02×
- Total profit
- $176,827
- Equity at exit
- $188,284
- IRR
- 34.0%
- Equity multiple
- 9.06×
- Total profit
- $471,760
- Equity at exit
- $406,041
Cash invested: $58,520 (down + closing). Projections, not guarantees.
Landlord ↔ Tenant lean methodology
- Overall (STATE)
- 62 Landlord-Friendly
- State Pennsylvania
- 62 Landlord-Friendly · EVEN
- County
- — inherits STATE
- City
- — inherits STATE
ZIP-level market 18428
- Home prices YoY
- 9.2%
- Active inventory
- 374
- Price-to-rent
- 5.1×
Monthly cashflow live
- Estimated rent
- $3,398 high interval (Pro) →
- Mortgage (P&I)
- −$1,096
- Tax from tax record
- −$266 /mo · $3,186/yr
- Insurance
- −$87
- HOA
- −$250
- Vacancy / Maint / Mgmt
- −$714
- Net cashflow
- $986
Break-even live
Sensitivity live
| Price | -10% $1,104 | -5% $1,045 | +0% $986 | +5% $927 | +10% $868 |
|---|---|---|---|---|---|
| Rent | -10% $717 | -5% $852 | +0% $986 | +5% $1,120 | +10% $1,254 |
| Rate | -1.0pp $1,091 | -0.5pp $1,039 | base $986 | +0.5pp $932 | +1.0pp $877 |
UW: 25.0% down · 7.5% · 30yr · 1.5% tax · 5.0% vac · 8.0% maint · 8.0% mgmt
Financing live
Cash to close
- Down payment
- $52,250
- Closing costs
- $6,270
- Reserves months
- —
- Total cash needed
- —
Loan-product check · same deal, 3 products live
Conventional
25% down · 7.5% · 30yr
- Down + closing
- —
- Monthly P&I
- —
- Monthly cashflow
- —
- DSCR
- —
- Eligible?
- —
Personal DTI + credit; lowest rate.
DSCR
20% down · 8.5% · 30yr
- Down + closing
- —
- Monthly P&I
- —
- Monthly cashflow
- —
- DSCR
- —
- Eligible?
- —
No personal income docs; deal must DSCR.
Hard money
10% down · 12.0% · 12mo
- Down + closing
- —
- Monthly P&I
- —
- Monthly cashflow
- —
- DSCR
- —
- Eligible?
- —
Short-term bridge; refi at stabilization.
Rent comps 5 comps
| Address | Beds | Baths | Sqft | Rent | $/sqft | DOM | Units | Dist |
|---|---|---|---|---|---|---|---|---|
| 131 Surrey Dr Hawley, PA | 4.0 | 2.0 | 1952 | $2,650 | $1.36 | 45d | 1 | 0.46mi |
| 811 Hickory Ct Hawley, PA | 3.0 | 2.0 | 1100 | $2,500 | $2.27 | 0d | 1 | 0.70mi |
| 106 Corral Ln Hawley, PA | 3.0 | 2.0 | 2150 | $4,000 | $1.86 | 5d | 1 | 0.75mi |
| 313 Forest Dr Blooming Grove, PA | 3.0 | 2.0 | 1200 | $4,600 | $3.83 | 0d | 1 | 0.96mi |
| 101 Pommel Dr Hawley, PA | 3.0 | 2.0 | 1691 | $4,400 | $2.60 | 2d | 1 | 1.40mi |
HOA detail
- Monthly dues
- $250 · $3,000/yr
Listing history 14 events
-
2026-06-21days on market $209,000 Active 20 DOM
-
2026-06-18days on market $209,000 Active 17 DOM
-
2026-06-17days on market $209,000 Active 16 DOM
-
2026-06-16days on market $209,000 Active 15 DOM
-
2026-06-15days on market $209,000 Active 14 DOM
-
2026-06-13days on market $209,000 Active 12 DOM
-
2026-06-13days on market $209,000 Active 11 DOM
-
2026-06-09days on market $209,000 Active 8 DOM
-
2026-06-08days on market $209,000 Active 7 DOM
-
2026-06-07days on market $209,000 Active 6 DOM
-
2026-06-04days on market $209,000 Active 3 DOM
-
2026-06-03days on market $209,000 Active 2 DOM
-
2026-06-02remarks 545-char remark
-
2026-06-02$209,000 Active 1 DOM
ⓘ Source: listings_history table (triggers on properties + properties_extension) + one-shot
backfill from property_details.listing_events for pre-trigger history.
Tax reassessment forecast PA · Partial reset (capped growth)
- Current annual tax
- $3,186 · $266/mo
- Projected year-2 tax
- $3,244 · $270/mo
- Expected delta
- +$58/yr (+$5/mo · 1.8%)
ⓘ Screening estimate from a state-policy table — verify with the county assessor before closing.
Climate risk First Street
- Flood 1/10 Low FEMA zone X (unshaded) · 0% chance over 30 yrs
- Wildfire 4/10 Moderate
- Heat 2/10 Low 7 d/yr ≥91°F today · 15 d/yr by 30 yrs out
- Wind 3/10 Moderate 5% chance of damaging wind over 30 yrs
- Air quality 2/10 Low 1 unhealthy d/yr today · 2 by 30 yrs out
Nearby sold comps map
Loading sold comps map…
Walkable amenities ~0.75 mi
Loading nearby amenities…
Taxation est. · year 1
- Rental income
- $40,778
- − Mortgage interest
- −$11,707
- − Property taxes
- −$3,186
- − Insurance
- −$1,045
- − Repairs & maintenance
- −$3,262
- − Management
- −$3,262
- − HOA
- −$3,000
- − Depreciation
- −$6,080
- Taxable income
- $9,235
- Est. tax owed @ 24.0%
- −$2,216
- After-tax cash flow
- $9,615/yr
For passive investors: Depreciation is non-cash, so a rental often shows a tax loss while cash-flowing — sheltering income. Rental losses are passive: they offset passive income freely, and up to $25,000/yr can offset ordinary (W-2) income if you actively participate and your MAGI is under $100k (phasing out to $0 by $150k); unused losses carry forward. On sale, claimed depreciation is recaptured at up to 25%, and gains may owe capital-gains tax (a 1031 exchange can defer both). Figures are a year-1 estimate at your 24.0% rate — not tax advice; consult a CPA.
Schools (NCES district)
- District
- Wallenpaupack Area SD
- NCES district ID
- 4224750
- Math proficiency
- 39% ▼ -10.00%
- Reading proficiency
- 59% ▼ -5.00%
- Median HH income
- $51,027
- Composite
- 41.97/100
- National rank
- #3345
- State rank
- #192 of 539 in PA
Livability — Hemlock Farms
- Score
- 68/100
- State rank
- #884
- US rank
- #9421
Category grades
Schools grade is shown separately in the Schools card above.
Census & demographics
- Census place
- Hemlock Farms, PA
- Population (ZIP)
- 12,446
Population outlook (Pike County) Hauer SSP2
- Today (2025)
- 53,548 people
- By 2030
- 51,622 · -3.6%
- By 2040
- 46,490 · -13.2%
- By 2050
- 40,372 · -24.6%
- By 2075
- 31,951 · -40.3%
- By 2100
- 26,821 · -49.9%
Race, ethnicity, and origin ACS 2023
- Neighborhood character
- Predominantly White (85%)
- Race & ethnicity
- White 85% Hispanic / Latino 8% Two or more races 6% Black 1% Asian 1%
- Hispanic origin (detail)
- Puerto Rican 5%
- Common ancestry
- Romanian 5% Portuguese 3% Italian 2%
- Foreign-born
- 5% · Canada
- Languages at home
- 91% English-only · Spanish 5% Russian/Polish/Slavic 1% Other Asian/Pacific 1%
Political lean MEDSL · Pike
- 2024 margin
- Strong R (+24.1) · D 37.6% · R 61.6%
- 2008→2024 swing
- -19.8pp toward R · 2008: -4.2pp · 2024: -24.1pp
- All cycles
- 2024: R+24.1 2020: R+19.0 2016: R+26.0 2012: R+11.0 2008: R+4.2
Not yet ingested
- Civics
- —
Market trends
- HPI YoY
- ▲ 28.60%
- Current HPI
- 340.8254
- Rent YoY
- —
- Metro
- —
- State GDP YoY
- ▲ 1.68%
- F500 in state
- 34
Industry mix (Fortune 500 HQ in PA)
| Industry | F500 HQs | Revenue |
|---|---|---|
| Healthcare | 2 | $309B |
|
||
| Insurance | 2 | $27B |
|
||
| Telecommunications / Media | 1 | $124B |
|
||
| Industrial Distribution | 1 | $22B |
|
||
| Financial Services | 1 | $20B |
|
||
| Chemicals / Materials | 1 | $18B |
|
||
Price history
+81.7% since first listed2 events — show timeline
- 2026-05-31 Listed $209,000 PWMLS
- 1996-09-09 Sold (Public Records) $115,000 Public Records
Property tax history
+2.8%/yrLatest (2026): $3,186 · +3.0% YoY. Source: county tax records.
Cash-flow waterfall
monthlySold comps — $/sqft
last 12 mo · ≤1 miLoading sold comps…