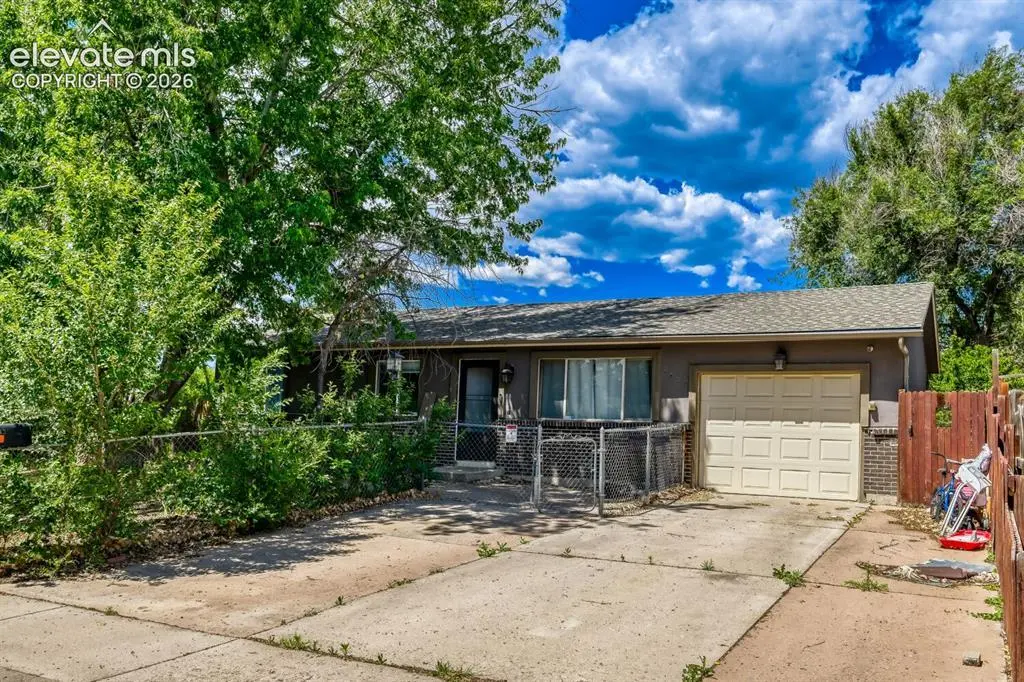
2438 Barkman Dr · Colorado Springs, CO
Flood risk 1/10 · Minimal
- FEMA flood zone
- X (unshaded)
- Chance of flooding over 30 yrs
- 0.0%
- Est. flood insurance / yr
- $507 – $1,088
Fire risk 5/10 · Moderate
- Est. fire insurance / yr
- $939 – $1,743
Heat risk 3/10 · Minor
- Hot days now (above 90°F)
- 7 days/yr
- Hot days in 30 yrs
- 18 days/yr
Wind risk 2/10 · Minimal
- Chance of severe wind over 30 yrs
- —
Air-quality risk 1/10 · Minimal
- Unhealthy air days now
- 0 days/yr
- Unhealthy air days in 30 yrs
- 0 days/yr
Risk factors via First Street. Map © Google.
Why this score? — see what drove the C- grade
The composite is a weighted blend of 9 inputs, each scored 0–100. Each bar is that input's sub-score; the figure is the points it added to the 100-point composite (weight × sub-score).
- Cash flow +15.7/30.0
- ARV discount +15.0/15.0
- DSCR +4.9/10.0
- Livability +3.9/5.0
- 1% rule +3.2/10.0
- Rent growth +3.1/5.0
- Condition / age +2.5/5.0
- Schools +2.1/10.0
- Appreciation +0.0/10.0
$279,000
🖨 Deal sheet (PDF) 📄 Offer letter ✓ Due diligence
Listing remarks MLS
This Ranch Style Home is in Harrison School District 2. It was Built in 1972 and is over 1,800 sq ft. A good opportunity to own a home with 4 Bedrooms, 2 Bathrooms & a 1-car attached Garage with Stucco Exterior. The Driveway is Extended Featuring 2 More Car Spaces. The Front Yard boosts Mature Trees as well. This home Features a Living Room, Kitchen with Nice Appliances:Refrigerator, Gas Oven, Microwave, Dishwasher and Plenty of Cabinets. The Master is on the Main level along with 2 other bedrooms all sharing a 3/4 Bathroom which has Quartz Counter Tops. The Basement features 1 more Bedroom, a Family Room, a Bonus room, a Laundry/Storage Room, another 3/4 Bathroom with Dual Shower Heads. In The backyard you will find a Storage Shed ...plenty of space for your family to enjoy a barbecue or play with your pup, Plus RV parking on the concrete area with its own gate, as well as Peach, Plum and Lilac trees. This is an established neighborhood close to Academy Blvd and easy access to Shopping. In walking proximity to James Irwin schools (District 2).Public transportation across the street.
Key facts
- 8,400 sq ft lot
- Garage
- Built 1972
Property features AI
Finance
- Financial info: Financing accepted: Cash, Conventional, FHA, VA
- HOA & community: No homeowners association
Exterior
- Parking: Attached 1-car garage
- Utilities: Municipal water; Cable available; Electricity available; Gas available
- Home design: Single family home; Existing home
- Construction: Wood frame construction; Wood siding; Composite shingle roof; Full basement (approximately 81% finished)
- Exterior features: Concrete patio; Rear fence; Concrete driveway; Corner lot; Level lot
Interior
- Bedrooms: Main floor bedroom
- Bathrooms: Two 3/4 bathrooms
- Heating & cooling: Forced air heating; Ceiling fan(s)
- Interior features: Ceiling fans; Forced air heating
- Laundry & utility: Laundry in basement
Neighborhood map
What this means for you Summary
Snapshot
- This is a 4-bed/2.0-bath single-family listed at $279k.
Deal economics
- At list price, monthly cash flow is $125 ($1k/yr) — positive.
- The deal already cash-flows at list — no discount required.
- To meet the 1% rule (rent ≥ 1% of price), the offer needs to be $229k (18.0% below list).
- Recommended offer: $229k (18.0% below list) — sets the bar for 1% rule.
- Cap rate 6.8% vs local median 3.3% in Colorado Springs — top-decile yield for the area; either an underpriced asset or a hidden risk that comps aren't pricing in. Stress-test before assuming the spread holds.
Location & tenants
- Location reads 78/100 on livability (#23 in CO, #2,639 nationally) — a middle-class / working-renter tenant base. Strengths: amenities A+, housing A+, health & safety A+; Watch: cost of living C-, crime F.
- Harrison School District No. 2 In The County Of El Paso An (urban): math 16% / reading 35% proficiency, ranked #67 of 86 in CO (top 78%) — low school quality limits family demand, transient renter base, plan for 1-2y turnover; 62% free/reduced lunch — lower-income household profile, screen leases tightly.
- Zoned schools: Bricker Elementary School (math 5% / reading 22%, grade F, #824 of 966 statewide, top 88%, 275 students, 50% FRL); Panorama Middle School (math 6% / reading 17%, grade F, #240 of 270 statewide, top 89%, 403 students, 66% FRL); Sierra High School (math 8% / reading 42%, grade F, #264 of 381 statewide, top 69%, 908 students, 54% FRL).
- Market conditions: Rents rising (+2.4%/yr); 189 active listings in the ZIP; 37 comparable units currently listed for rent nearby; rentals leasing fast (median 5d on market — plan ~1-2 weeks tenant-placement turnaround); 3,906 units permitted in El Paso County in 2024 (872 in 5+ unit buildings).
- This rent runs 41% of the median local income ($67k/yr) — at the standard rent-burdened threshold; future hikes will face affordability resistance.
Forward outlook
- Local home prices are declining (-3.0%/yr); year-one equity from $2k of loan paydown is wiped out by about $8k of value loss. Plan a longer hold.
- El Paso County population projected at +28% by 2050 — long-run rental-demand tailwind backs the buy-and-hold thesis.
Negotiation context
- Only 13 days on market — expect competitive offers; lowballing is unlikely to land.
- 3 sale attempts since 4y ago; this cycle's ask has dropped $41k (13%) from the opening price — seller is motivated, your offer sets the floor, not the list.
Risks & watch-outs
- Climate carrying-cost: moderate wildfire risk — expect insurance premiums to compound above CPI over the hold.
Questions for the listing agent
- Built in 1972 — when were the roof, HVAC, electrical panel, plumbing, and water heater last replaced?
- Is there a deadline driving the sale (1031 exchange, divorce, estate, relocation)? That informs how much negotiation room exists.
- Schools are B-rated — typically a magnet for longer-tenancy family renters. What's the average tenant stay here, and is there a school-zone premium baked into asking?
- Crime grade is F in this area — have there been break-ins, vandalism, or insurance claims at this property in the last 3 years? What carrier currently insures it and at what premium?
- What's the average days-on-market for RENTAL listings here right now (not sales)? A rising rental-DOM trend means longer vacancies and softer asking-rent achievability than the comps imply.
- What's the recent tenant-quality profile in this submarket — average credit score on applications, eviction rate, late-payment / NSF rate, and stable-employment percentage? A property-management company in the area should have these aggregated.
- How much new for-sale + rental construction is in the pipeline within 1–3 miles? Heavy new supply typically softens prices + rents 12–24 months out; constrained supply supports both.
Investment metrics
- 1% rule
- 0.82% ✗
- Cap rate
- 6.83%
- Cash-on-cash
- 1.92%
- DSCR
- 1.09
- GRM
- 10.2
CMA / ARV
- ARV (on-the-fly)
- $387,074
- Comps found
- 12
Show comp detail 12 sales within ~0.75 mi
| Address | Dist | Beds/Ba | Sqft | Sold | Price | $/sf | Match |
|---|---|---|---|---|---|---|---|
| 2466 W Payne Cir | 0.21mi | 4/2.0 | 1,878 (-0%) | 2mo | $307,000 | $163 | 89 |
| 4055 Jet Wing Pl | 0.32mi | 4/2.0 | 1,878 (-0%) | 2mo | $411,000 | $219 | 83 |
| 2233 Farnsworth Dr | 0.39mi | 4/2.0 | 1,880 (+0%) | 2mo | $364,900 | $194 | 80 |
| 4505 S Anjelina Cir | 0.22mi | 4/2.0 | 1,666 (-11%) | 1mo | $375,000 | $225 | 70 |
| 4525 Melville Dr | 0.43mi | 3/1.0 (-1) | 1,902 (+1%) | 2mo | $317,000 | $167 | 67 |
| 2050 S Chelton Rd | 0.45mi | 3/2.0 (-1) | 1,755 (-7%) | 0mo | $385,000 | $219 | 63 |
| 3114 Moonbeam Cir | 0.73mi | 4/2.0 | 1,800 (-4%) | 2mo | $360,000 | $200 | 57 |
| 4320 Kanaly Ct | 0.61mi | 4/2.0 | 1,669 (-11%) | 1mo | $388,000 | $232 | 52 |
| 2645 Prescott Cir E | 0.51mi | 3/2.0 (-1) | 1,679 (-11%) | 1mo | $346,000 | $206 | 52 |
| 2515 Plymouth Dr | 0.56mi | 4/3.0 | 2,132 (+14%) | 1mo | $371,000 | $174 | 47 |
| 2227 Sierra Park Dr | 0.45mi | 3/2.5 (-1) | 1,601 (-15%) | 1mo | $369,500 | $231 | 46 |
| 2835 Blake Dr | 0.70mi | 3/1.0 (-1) | 2,016 (+7%) | 1mo | $360,000 | $179 | 45 |
Match score weights: distance 35% · size 25% · config 20% · recency 20%. Top-matched comps best support the ARV.
Projected returns pro-forma
-3.0% appreciation · 2.36% rent growth · sell at horizon
- IRR
- -13.9%
- Equity multiple
- 0.50×
- Total profit
- $-38,840
- Equity at exit
- $41,600
- IRR
- -6.1%
- Equity multiple
- 0.62×
- Total profit
- $-29,987
- Equity at exit
- $24,123
Cash invested: $78,120 (down + closing). Projections, not guarantees.
Landlord ↔ Tenant lean methodology
- Overall (STATE)
- 38 Tenant-Leaning
- State Colorado
- 38 Tenant-Leaning · D+4
- County
- — inherits STATE
- City
- — inherits STATE
ZIP-level market 80916
- Home prices YoY
- -27.6%
- Rents YoY
- 2.4%
- Active inventory
- 189
- Price-to-rent
- 10.2×
Monthly cashflow live
- Estimated rent
- $2,287 high interval (Pro) →
- Mortgage (P&I)
- −$1,463
- Tax from tax record
- −$103 /mo · $1,233/yr
- Insurance
- −$116
- HOA
- −$0
- Vacancy / Maint / Mgmt
- −$480
- Net cashflow
- $125
Break-even live
Sensitivity live
| Price | -10% $283 | -5% $204 | +0% $125 | +5% $46 | +10% $-33 |
|---|---|---|---|---|---|
| Rent | -10% $-56 | -5% $34 | +0% $125 | +5% $215 | +10% $306 |
| Rate | -1.0pp $265 | -0.5pp $196 | base $125 | +0.5pp $53 | +1.0pp $-21 |
UW: 25.0% down · 7.5% · 30yr · 1.5% tax · 5.0% vac · 8.0% maint · 8.0% mgmt
Financing live
Cash to close
- Down payment
- $69,750
- Closing costs
- $8,370
- Reserves months
- —
- Total cash needed
- —
Loan-product check · same deal, 3 products live
Conventional
25% down · 7.5% · 30yr
- Down + closing
- —
- Monthly P&I
- —
- Monthly cashflow
- —
- DSCR
- —
- Eligible?
- —
Personal DTI + credit; lowest rate.
DSCR
20% down · 8.5% · 30yr
- Down + closing
- —
- Monthly P&I
- —
- Monthly cashflow
- —
- DSCR
- —
- Eligible?
- —
No personal income docs; deal must DSCR.
Hard money
10% down · 12.0% · 12mo
- Down + closing
- —
- Monthly P&I
- —
- Monthly cashflow
- —
- DSCR
- —
- Eligible?
- —
Short-term bridge; refi at stabilization.
Rent comps 37 comps
| Address | Beds | Baths | Sqft | Rent | $/sqft | DOM | Units | Dist |
|---|---|---|---|---|---|---|---|---|
| 4115 Morley Dr Colorado Springs, CO | 4.0 | 2.0 | 1739 | $2,095 | $1.20 | 25d | 1 | 0.28mi |
| 4575 Monica Dr Colorado Springs, CO | 4.0 | 2.0 | 1750 | $2,095 | $1.20 | 4d | 1 | 0.35mi |
| 2915 Monica Dr W Colorado Springs, CO | 5.0 | 3.0 | 2030 | $2,800 | $1.38 | 25d | 1 | 0.46mi |
| 4027 Charleston Dr Colorado Springs, CO | 3.0 | 2.0 | 1232 | $2,000 | $1.62 | 16d | 1 | 0.52mi |
| 2320 Bruno Cir Colorado Springs, CO | 4.0 | 2.0 | 1311 | $2,229 | $1.70 | 23d | 1 | 0.65mi |
| 3127 Moonbeam Cir S Colorado Springs, CO | 3.0 | 2.0 | 1482 | $2,099 | $1.42 | 4d | 1 | 0.67mi |
| 2702 Dickens Dr Colorado Springs, CO | 3.0 | 2.0 | 1300 | $2,093 | $1.61 | 16d | 1 | 0.67mi |
| 1810 Kaleidos Vw Colorado Springs, CO | 1.0–3.0 | 1.0–2.0 | 1023 | $2,200 | $2.15 | 4d | 6 | 0.84mi |
| 4919 Rusty Nail Pt Colorado Springs, CO | 3.0 | 1.5 | 1237 | $1,900 | $1.54 | 4d | 1 | 0.85mi |
| 3063 Harpy Grv Colorado Springs, CO | 3.0 | 2.5 | 1561 | $1,950 | $1.25 | 4d | 1 | 0.86mi |
| 3098 Shikra Vw Colorado Springs, CO | 3.0 | 2.5 | 1561 | $2,195 | $1.41 | 16d | 1 | 0.88mi |
| 4814 Hawk Meadow Dr Colorado Springs, CO | 3.0 | 2.5 | 1579 | $2,295 | $1.45 | 25d | 1 | 0.90mi |
| 2311 Sonoma Dr Colorado Springs, CO | 4.0 | 2.0 | 1836 | $2,280 | $1.24 | 23d | 1 | 0.92mi |
| 4960 Fountain Ford Vw Colorado Springs, CO | 1.0–3.0 | 1.0–2.0 | 973 | $2,311 | $2.38 | 4d | 28 | 0.93mi |
| 3965 Colony Hills Cir Colorado Springs, CO | 4.0 | 2.0 | 1616 | $2,250 | $1.39 | 4d | 1 | 1.00mi |
| 3459 Springnite Dr Colorado Springs, CO | 3.0 | 2.0 | 1351 | $1,700 | $1.26 | 25d | 1 | 1.01mi |
| 2458 Sonoma Dr Colorado Springs, CO | 3.0 | 2.0 | 1686 | $2,200 | $1.30 | 25d | 1 | 1.02mi |
| 3469 Hunterwood Dr Colorado Springs, CO | 3.0 | 3.0 | 2264 | $2,199 | $0.97 | 4d | 1 | 1.03mi |
| 2404 Monterey Rd Colorado Springs, CO | 3.0 | 2.0 | 1862 | $2,500 | $1.34 | 4d | 1 | 1.04mi |
| 4096 Colony Hills Cir Colorado Springs, CO | 3.0 | 2.0 | 1607 | $2,093 | $1.30 | 4d | 1 | 1.06mi |
| 4815 Tory Ridge Dr Colorado Springs, CO | 3.0 | 2.5 | 1415 | $2,850 | $2.01 | 4d | 1 | 1.06mi |
| 5150 Selby Ranch Pt Colorado Springs, CO | 3.0–4.0 | 2.5–3.5 | 1626 | $3,356 | $2.06 | 4d | 93 | 1.10mi |
| 1540 Sparton Grv Unit 102 Colorado Springs, CO | 3.0 | 3.0 | 1552 | $2,195 | $1.41 | 4d | 1 | 1.12mi |
| 1518 Tyram Grv Unit 102 Colorado Springs, CO | 3.0 | 3.0 | 1552 | $2,195 | $1.41 | 4d | 1 | 1.16mi |
| 4710 Jet Wing Cir W Colorado Springs, CO | 3.0 | 3.0 | 1700 | $2,099 | $1.23 | 25d | 1 | 1.17mi |
| 4535 Jet Wing Cir W Colorado Springs, CO | 3.0 | 2.0 | 1806 | $2,449 | $1.36 | 4d | 1 | 1.17mi |
| 1342 Firefly Cir Colorado Springs, CO | 3.0 | 1.5 | 1560 | $1,600 | $1.03 | 4d | 1 | 1.19mi |
| 1340 Inverness Dr Colorado Springs, CO | 1.0–3.0 | 1.0–2.0 | 936 | $2,026 | $2.16 | 4d | 17 | 1.30mi |
| 1071 Cana Grv Colorado Springs, CO | 3.0 | 2.5 | 1932 | $2,295 | $1.19 | 25d | 1 | 1.33mi |
| 2335 CoralBell Grv Colorado Springs, CO | 1.0–3.0 | 1.0–2.0 | 997 | $2,498 | $2.50 | 25d | 34 | 1.33mi |
| 2335 CoralBell Grv Colorado Springs, CO | 2.0–3.0 | 1.0–2.0 | 1004 | $2,195 | $2.19 | 4d | 7 | 1.33mi |
| 4275 Sanders Vw Colorado Springs, CO | 1.0–3.0 | 1.0–2.0 | 932 | $3,006 | $3.23 | 4d | 27 | 1.38mi |
| 1055 Petra Hts Colorado Springs, CO | 3.0 | 2.5 | 1702 | $2,200 | $1.29 | 25d | 1 | 1.38mi |
| 3241 Viero Dr Colorado Springs, CO | 4.0 | 3.5 | 2034 | $2,450 | $1.20 | 4d | 1 | 1.45mi |
| 2414 Sombrero Dr Colorado Springs, CO | 4.0 | 2.0 | 1800 | $2,200 | $1.22 | 16d | 1 | 1.45mi |
| 2046 Del Mar Dr Colorado Springs, CO | 5.0 | 2.0 | 1824 | $2,500 | $1.37 | 4d | 1 | 1.49mi |
| 894 Petra Hts Colorado Springs, CO | 3.0 | 2.5 | 1671 | $2,045 | $1.22 | 4d | 1 | 1.49mi |
Listing history 10 events
-
2026-06-21pricedays on market $279,000 Active 13 DOM
-
2026-06-18days on market $299,000 Active 10 DOM
-
2026-06-17days on market $299,000 Active 9 DOM
-
2026-06-16days on market $299,000 Active 8 DOM
-
2026-06-15days on market $299,000 Active 7 DOM
-
2026-06-14days on market $299,000 Active 5 DOM
-
2026-06-13days on market $299,000 Active 4 DOM
-
2026-06-10days on market $299,000 Active 2 DOM
-
2026-06-09remarks 699-char remark
-
2026-06-09$299,000 Active 1 DOM
ⓘ Source: listings_history table (triggers on properties + properties_extension) + one-shot
backfill from property_details.listing_events for pre-trigger history.
Tax reassessment forecast CO · Resets to sale price
- Current annual tax
- $1,233 · $103/mo
- Projected year-2 tax
- $1,534 · $128/mo
- Expected delta
- +$301/yr (+$25/mo · 24.4%)
ⓘ Screening estimate from a state-policy table — verify with the county assessor before closing.
Climate risk First Street
- Flood 1/10 Low FEMA zone X (unshaded) · 0% chance over 30 yrs
- Wildfire 5/10 Major
- Heat 3/10 Moderate 7 d/yr ≥90°F today · 18 d/yr by 30 yrs out
- Wind 2/10 Low
- Air quality 1/10 Low 0 unhealthy d/yr today · 0 by 30 yrs out
Nearby sold comps map
Loading sold comps map…
Walkable amenities ~0.75 mi
Loading nearby amenities…
Taxation est. · year 1
- Rental income
- $27,447
- − Mortgage interest
- −$15,628
- − Property taxes
- −$1,233
- − Insurance
- −$1,395
- − Repairs & maintenance
- −$2,196
- − Management
- −$2,196
- − Depreciation
- −$8,116
- Taxable loss
- −$3,317
- Est. tax savings @ 24.0%
- +$796
- After-tax cash flow
- $2,294/yr
For passive investors: Depreciation is non-cash, so a rental often shows a tax loss while cash-flowing — sheltering income. Rental losses are passive: they offset passive income freely, and up to $25,000/yr can offset ordinary (W-2) income if you actively participate and your MAGI is under $100k (phasing out to $0 by $150k); unused losses carry forward. On sale, claimed depreciation is recaptured at up to 25%, and gains may owe capital-gains tax (a 1031 exchange can defer both). Figures are a year-1 estimate at your 24.0% rate — not tax advice; consult a CPA.
Schools (NCES district)
- District
- Harrison School District No. 2 In The County Of El Paso An
- NCES district ID
- 0804530
- Math proficiency
- 16% ▼ -13.00%
- Reading proficiency
- 35% ▼ -7.00%
- Median HH income
- $40,242
- Composite
- 21.47/100
- National rank
- #8333
- State rank
- #67 of 86 in CO
Livability — Colorado Springs
- Score
- 78/100
- State rank
- #23
- US rank
- #2639
Category grades
Schools grade is shown separately in the Schools card above.
Census & demographics
- Census place
- Colorado Springs, CO
- County
- El Paso County · 689,348 people
- City population
- 555,783
- Metro
- Colorado Springs, CO
- Population (ZIP)
- 41,104
- Household income
- $67,127
- Rent vs Own
- Severe rent burden
- 2041.0
Population outlook (El Paso County) Hauer SSP2
- Today (2025)
- 768,926 people
- By 2030
- 815,739 · +6.1%
- By 2040
- 903,489 · +17.5%
- By 2050
- 981,204 · +27.6%
- By 2075
- 1,155,542 · +50.3%
- By 2100
- 1,202,070 · +56.3%
Race, ethnicity, and origin ACS 2023
- Neighborhood character
- Diverse neighborhood (Simpson 0.70)
- Race & ethnicity
- Hispanic / Latino 38% White 37% Two or more races 18% Black 15% Asian 3% Native American 2%
- Hispanic origin (detail)
- Mexican 28% Puerto Rican 2%
- Common ancestry
- Lithuanian 1% Romanian 1% Slovak 1%
- Foreign-born
- 13% · Canada, South Korea
- Languages at home
- 73% English-only · Spanish 22% French/Haitian/Cajun 1% Tagalog/Filipino 1%
Political lean MEDSL · El Paso
- 2024 margin
- Lean R (+9.8) · D 43.8% · R 53.5% · Other 2.7%
- 2008→2024 swing
- +9.0pp toward D · 2008: -18.8pp · 2024: -9.8pp
- All cycles
- 2024: R+9.8 2020: R+10.8 2016: R+22.6 2012: R+21.4 2008: R+18.8
Not yet ingested
- Civics
- —
Market trends
- HPI YoY
- ▼ -114.77%
- Current HPI
- 301.5415
- Rent YoY
- ▲ 2.36%
- Metro
- Colorado Springs, CO
- State GDP YoY
- ▲ 1.95%
- F500 in state
- 14
Industry mix (Fortune 500 HQ in CO)
| Industry | F500 HQs | Revenue |
|---|---|---|
| Technology Distribution | 1 | $31B |
|
||
| Food / Agriculture | 1 | $18B |
|
||
| Packaging | 1 | $14B |
|
||
| Healthcare | 1 | $13B |
|
||
| Energy | 1 | $10B |
|
||
| Technology | 1 | $4B |
|
||
Price history
+280.9% since first listed12 events — show timeline
- 2026-06-08 Price Changed $299,000 elevateMLS
- 2026-06-08 Listed $320,000 elevateMLS
- 2025-11-24 Price Changed $360,000 elevateMLS
- 2022-07-05 Sold (Public Records) $360,000 Public Records
- 2022-07-01 Sold (MLS) $360,000 IRES
- 2022-07-01 Sold (MLS) $360,000 REColorado as Distributed by MLS Grid
- 2022-05-28 Pending — REColorado as Distributed by MLS Grid
- 2022-05-25 Price Changed $354,999 REColorado as Distributed by MLS Grid
- 2022-05-25 Price Changed $354,999 elevateMLS
- 2022-05-20 Listed $354,999 IRES
- 2022-05-20 Listed $364,999 REColorado as Distributed by MLS Grid
- 1996-09-04 Sold (Public Records) $78,500 Public Records
Property tax history
+4.0%/yrLatest (2024): $1,233 · +28.4% YoY. Source: county tax records.
Cash-flow waterfall
monthlySold comps — $/sqft
last 12 mo · ≤1 miLoading sold comps…