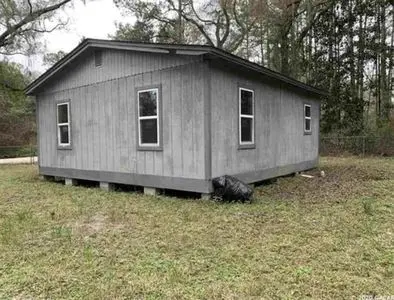
14426 NE 160th Ave · Waldo, FL
Flood risk 1/10 · Minimal
- FEMA flood zone
- X (unshaded)
- Chance of flooding over 30 yrs
- 0.0%
- Est. flood insurance / yr
- $507 – $1,088
Fire risk 8/10 · Major
- Est. fire insurance / yr
- $947 – $1,759
Heat risk 8/10 · Major
- Hot days now (above 107°F)
- 7 days/yr
- Hot days in 30 yrs
- 21 days/yr
Wind risk 9/10 · Severe
- Chance of severe wind over 30 yrs
- 99.0%
Air-quality risk 3/10 · Minor
- Unhealthy air days now
- 3 days/yr
- Unhealthy air days in 30 yrs
- 4 days/yr
Risk factors via First Street. Map © Google.
Why this score? — see what drove the B+ grade
The composite is a weighted blend of 9 inputs, each scored 0–100. Each bar is that input's sub-score; the figure is the points it added to the 100-point composite (weight × sub-score).
- Cash flow +30.0/30.0
- 1% rule +10.0/10.0
- DSCR +10.0/10.0
- Appreciation +9.0/10.0
- ARV discount +7.5/15.0
- Schools +4.3/10.0
- Livability +3.2/5.0
- Rent growth +2.5/5.0
- Condition / age +2.5/5.0
$75,000
🖨 Deal sheet (PDF) 📄 Offer letter ✓ Due diligence
Listing remarks MLS
This is a handyman''s dream investment property! This home is just waiting for the right investor and a few weeks of elbow grease. The painting is almost done, and the flooring has been started and the remaining flooring is already in the house. The home needs a new roof immediately and there is no central AC or heat, you will need to install a mini split or window units. This is the perfect low income rental property- it can easily pay itself off in 5-6 years! CASH OFFERS ONLY.
Key facts
- Built 1995
- Listed 26 days
Neighborhood map
What this means for you Summary
Snapshot
- This is a 2-bed/1.0-bath single-family listed at $75k.
Deal economics
- At list price, monthly cash flow is $642 ($8k/yr) — positive.
- The deal already cash-flows at list — no discount required.
- Meets the 1% rule at list price ($1k rent vs $75k).
- Recommended offer: $74k (1.5% below list) — sets the bar for market timing.
Location & tenants
- Location reads 63/100 on livability (#705 in FL) — a middle-class / working-renter tenant base. Strengths: cost of living A+, health & safety A+, housing B+; Watch: crime C-, amenities F, commute F.
- Alachua (urban): math 49% / reading 54% proficiency, ranked #30 of 73 in FL (top 41%) — acceptable for families but not a draw, mixed tenant base, ~2y average lease.
- Zoned schools: Chester Shell Elementary School (math 27% / reading 27%, grade F, #1,969 of 2,144 statewide, top 94%, 355 students, 82% FRL) — zoned schools average 82% FRL vs 48% district-wide (34 pts higher); higher-poverty schools than district average — tighter screening recommended.
- Zoned-school proficiency averages 27% at this address vs 52% district-wide (-24 pts) — the specific schools serving this property underperform the Alachua average; the district grade overstates school quality for this exact location.
- Market conditions: 36 active listings in the ZIP; 1,774 units permitted in Alachua County in 2024 (984 in 5+ unit buildings).
Forward outlook
- In year one you build about $7k of equity ($519 loan paydown + $6k appreciation (8.0% local appreciation)).
- Alachua County population projected at +26% by 2050 — long-run rental-demand tailwind backs the buy-and-hold thesis.
- At projected returns (8.0% appreciation + 3.0% rent growth), your $21k cash investment doubles in ~2 years — after that, you're playing with house money.
- By year 6, paydown + projected appreciation supports a ~$37k cash-out refi (75% LTV) — recoverable capital for the next deal without selling this one.
Negotiation context
- It's been on market 26 days — a 2% lower offer ($74k) is reasonable based on typical stale-listing flexibility.
- 3 sale attempts since 16y ago with the ask held roughly flat each time — persistent listings suggest the price (not the market) is what's stuck; bring a comps-based counter.
- Current owner paid $25k; list at $75k implies a 200% gain — meaningful room to come down on a strong offer.
Risks & watch-outs
- Climate carrying-cost: severe wind risk, 99% chance of damaging wind over 30y; severe wildfire risk; extreme-heat days projected 7→21/yr by 2055 (HVAC capex compounding) — expect insurance premiums to compound above CPI over the hold.
Questions for the listing agent
- Is there a deadline driving the sale (1031 exchange, divorce, estate, relocation)? That informs how much negotiation room exists.
- Schools are F-rated, which usually means shorter tenancies and higher turnover. Who's the typical renter profile here, and what's been the actual vacancy rate?
- What's the average days-on-market for RENTAL listings here right now (not sales)? A rising rental-DOM trend means longer vacancies and softer asking-rent achievability than the comps imply.
- What's the recent tenant-quality profile in this submarket — average credit score on applications, eviction rate, late-payment / NSF rate, and stable-employment percentage? A property-management company in the area should have these aggregated.
- How much new for-sale + rental construction is in the pipeline within 1–3 miles? Heavy new supply typically softens prices + rents 12–24 months out; constrained supply supports both.
Investment metrics
- 1% rule
- 1.95% ✓
- Cap rate
- 16.57%
- Cash-on-cash
- 36.69%
- DSCR
- 2.63
- GRM
- 4.3
CMA / ARV
No comps found within radius.
Projected returns pro-forma
8.01% appreciation · 3.0% rent growth · sell at horizon
- IRR
- 49.7%
- Equity multiple
- 4.42×
- Total profit
- $71,866
- Equity at exit
- $57,042
- IRR
- 44.9%
- Equity multiple
- 9.48×
- Total profit
- $178,168
- Equity at exit
- $113,288
Cash invested: $21,000 (down + closing). Projections, not guarantees.
Landlord ↔ Tenant lean methodology
- Overall (STATE)
- 87 Strongly Landlord-Friendly
- State Florida
- 87 Strongly Landlord-Friendly · R+3
- County
- — inherits STATE
- City
- — inherits STATE
ZIP-level market 32694
- Home prices YoY
- 3.7%
- Active inventory
- 36
- Price-to-rent
- 4.3×
Monthly cashflow live
- Estimated rent
- $1,461 medium interval (Pro) →
- Mortgage (P&I)
- −$393
- Tax from tax record
- −$87 /mo · $1,047/yr
- Insurance
- −$31
- HOA
- −$0
- Vacancy / Maint / Mgmt
- −$307
- Net cashflow
- $642
Break-even live
Sensitivity live
| Price | -10% $685 | -5% $663 | +0% $642 | +5% $621 | +10% $600 |
|---|---|---|---|---|---|
| Rent | -10% $527 | -5% $584 | +0% $642 | +5% $700 | +10% $757 |
| Rate | -1.0pp $680 | -0.5pp $661 | base $642 | +0.5pp $623 | +1.0pp $603 |
UW: 25.0% down · 7.5% · 30yr · 1.5% tax · 5.0% vac · 8.0% maint · 8.0% mgmt
Financing live
Cash to close
- Down payment
- $18,750
- Closing costs
- $2,250
- Reserves months
- —
- Total cash needed
- —
Loan-product check · same deal, 3 products live
Conventional
25% down · 7.5% · 30yr
- Down + closing
- —
- Monthly P&I
- —
- Monthly cashflow
- —
- DSCR
- —
- Eligible?
- —
Personal DTI + credit; lowest rate.
DSCR
20% down · 8.5% · 30yr
- Down + closing
- —
- Monthly P&I
- —
- Monthly cashflow
- —
- DSCR
- —
- Eligible?
- —
No personal income docs; deal must DSCR.
Hard money
10% down · 12.0% · 12mo
- Down + closing
- —
- Monthly P&I
- —
- Monthly cashflow
- —
- DSCR
- —
- Eligible?
- —
Short-term bridge; refi at stabilization.
Listing history 22 events
-
2026-06-21days on market $75,000 Active 26 DOM
-
2026-06-18days on market $75,000 Active 23 DOM
-
2026-06-17days on market $75,000 Active 22 DOM
-
2026-06-16days on market $75,000 Active 21 DOM
-
2026-06-15days on market $75,000 Active 20 DOM
-
2026-06-14days on market $75,000 Active 18 DOM
-
2026-06-13days on market $75,000 Active 17 DOM
-
2026-06-10days on market $75,000 Active 15 DOM
-
2026-06-09days on market $75,000 Active 14 DOM
-
2026-06-08days on market $75,000 Active 13 DOM
-
2026-06-07days on market $75,000 Active 12 DOM
-
2026-06-05days on market $75,000 Active 9 DOM
-
2026-06-03days on market $75,000 Active 8 DOM
-
2026-06-02days on market $75,000 Active 7 DOM
-
2026-06-01days on market $75,000 Active 6 DOM
-
2026-05-31days on market $75,000 Active 5 DOM
-
2026-05-30days on market $75,000 Active 4 DOM
-
2026-05-26$75,000 Active
-
2020-04-30soldstatus $25,000 483-char remark
Show marketing remark (483 chars)
This is a handyman''s dream investment property! This home is just waiting for the right investor and a few weeks of elbow grease. The painting is almost done, and the flooring has been started and the remaining flooring is already in the house. The home needs a new roof immediately and there is no central AC or heat, you will need to install a mini split or window units. This is the perfect low income rental property- it can easily pay itself off in 5-6 years! CASH OFFERS ONLY.
-
2020-03-02$27,500 483-char remark
Show marketing remark (483 chars)
This is a handyman''s dream investment property! This home is just waiting for the right investor and a few weeks of elbow grease. The painting is almost done, and the flooring has been started and the remaining flooring is already in the house. The home needs a new roof immediately and there is no central AC or heat, you will need to install a mini split or window units. This is the perfect low income rental property- it can easily pay itself off in 5-6 years! CASH OFFERS ONLY.
-
2011-03-07historical
-
2010-10-04$35,000
ⓘ Source: listings_history table (triggers on properties + properties_extension) + one-shot
backfill from property_details.listing_events for pre-trigger history.
Tax reassessment forecast FL · Resets to sale price
- Current annual tax
- $1,047 · $87/mo
- Projected year-2 tax
- $1,047 · $87/mo
- Expected delta
- $0/yr ($0/mo · 0.0%)
ⓘ Screening estimate from a state-policy table — verify with the county assessor before closing.
Climate risk First Street
- Flood 1/10 Low FEMA zone X (unshaded) · 0% chance over 30 yrs
- Wildfire 8/10 Severe
- Heat 8/10 Severe 7 d/yr ≥107°F today · 21 d/yr by 30 yrs out
- Wind 9/10 Extreme 99% chance of damaging wind over 30 yrs
- Air quality 3/10 Moderate 3 unhealthy d/yr today · 4 by 30 yrs out
Nearby sold comps map
Loading sold comps map…
Walkable amenities ~0.75 mi
Loading nearby amenities…
Taxation est. · year 1
- Rental income
- $17,527
- − Mortgage interest
- −$4,201
- − Property taxes
- −$1,047
- − Insurance
- −$375
- − Repairs & maintenance
- −$1,402
- − Management
- −$1,402
- − Depreciation
- −$2,182
- Taxable income
- $6,918
- Est. tax owed @ 24.0%
- −$1,660
- After-tax cash flow
- $6,045/yr
For passive investors: Depreciation is non-cash, so a rental often shows a tax loss while cash-flowing — sheltering income. Rental losses are passive: they offset passive income freely, and up to $25,000/yr can offset ordinary (W-2) income if you actively participate and your MAGI is under $100k (phasing out to $0 by $150k); unused losses carry forward. On sale, claimed depreciation is recaptured at up to 25%, and gains may owe capital-gains tax (a 1031 exchange can defer both). Figures are a year-1 estimate at your 24.0% rate — not tax advice; consult a CPA.
Schools (NCES district)
- District
- Alachua
- NCES district ID
- 1200030
- Math proficiency
- 49% ▼ -9.00%
- Reading proficiency
- 54% ▼ -3.00%
- Median HH income
- $42,683
- Composite
- 43.31/100
- National rank
- #3038
- State rank
- #30 of 73 in FL
Livability — Waldo
- Score
- 63/100
- State rank
- #705
- US rank
- #14963
Category grades
Schools grade is shown separately in the Schools card above.
Census & demographics
- Population (ZIP)
- 1,870
Population outlook (Alachua County) Hauer SSP2
- Today (2025)
- 289,834 people
- By 2030
- 305,873 · +5.5%
- By 2040
- 335,246 · +15.7%
- By 2050
- 364,719 · +25.8%
- By 2075
- 436,665 · +50.7%
- By 2100
- 482,920 · +66.6%
Race, ethnicity, and origin ACS 2023
- Neighborhood character
- Predominantly White (77%)
- Race & ethnicity
- White 77% Black 11% Hispanic / Latino 8% Two or more races 5% Asian 1%
- Hispanic origin (detail)
- Mexican 2% Puerto Rican 3% Cuban 3%
- Common ancestry
- Slovak 4% Italian 3% Iranian 2%
- Foreign-born
- 4% · Canada, South Korea
- Languages at home
- 92% English-only · Spanish 5% Russian/Polish/Slavic 2% Korean 1%
Political lean MEDSL · Alachua
- 2024 margin
- Strong D (+21.0) · D 59.7% · R 38.8% · Other 1.5%
- 2008→2024 swing
- -0.6pp no change · 2008: 21.6pp · 2024: 21.0pp
- All cycles
- 2024: D+21.0 2020: D+27.2 2016: D+22.5 2012: D+17.3 2008: D+21.6
Not yet ingested
- Civics
- —
Market trends
- HPI YoY
- ▲ 8.01%
- Current HPI
- 224.7473
- Rent YoY
- —
- Metro
- —
- State GDP YoY
- ▲ 3.28%
- F500 in state
- 36
Industry mix (Fortune 500 HQ in FL)
| Industry | F500 HQs | Revenue |
|---|---|---|
| Industrial Technology | 2 | $29B |
|
||
| Insurance | 2 | $17B |
|
||
| Retail | 1 | $60B |
|
||
| Technology Distribution | 1 | $58B |
|
||
| Homebuilding | 1 | $35B |
|
||
| Technology Manufacturing | 1 | $35B |
|
||
Price history
+114.3% since first listed5 events — show timeline
- 2026-05-26 Listed $75,000 FSBO.com
- 2020-04-30 Sold (MLS) $25,000 Stellar MLS as Distributed by MLS Grid
- 2020-03-02 Listed $27,500 Stellar MLS as Distributed by MLS Grid
- 2011-03-07 Listing Removed — Stellar MLS as Distributed by MLS Grid
- 2010-10-04 Listed $35,000 Stellar MLS as Distributed by MLS Grid
Property tax history
+13.3%/yrLatest (2025): $1,047 · +7.1% YoY. Source: county tax records.
Cash-flow waterfall
monthlySold comps — $/sqft
last 12 mo · ≤1 miLoading sold comps…