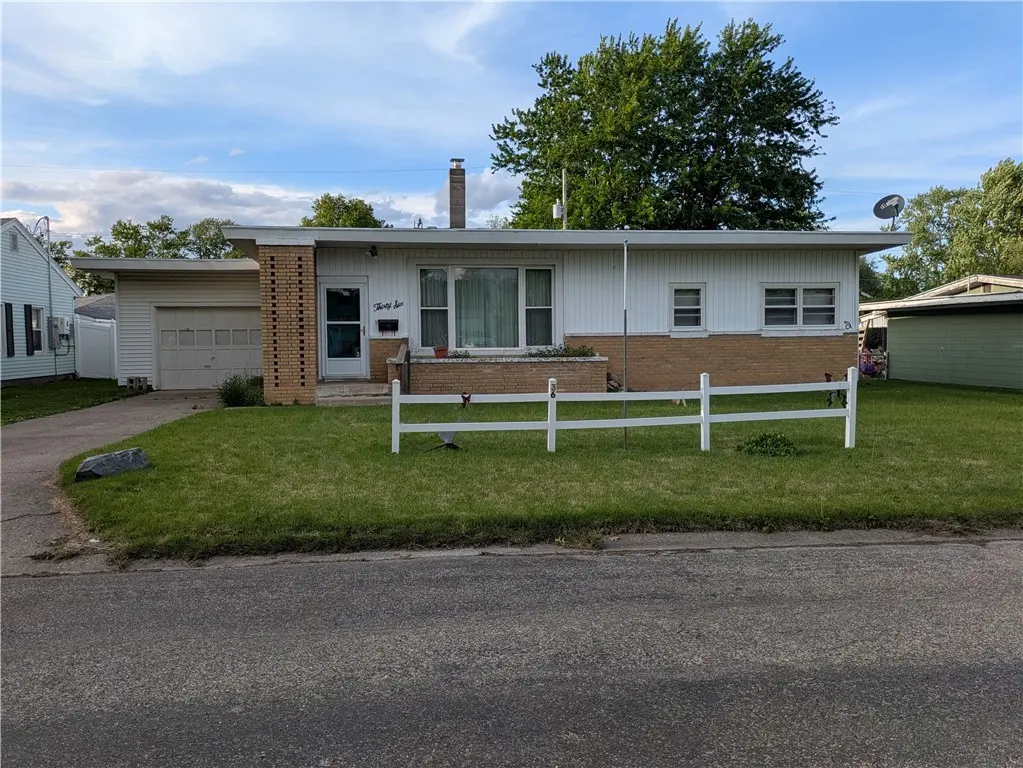
36 Helen Ave · Paris, IL
Flood risk 1/10 · Minimal
- FEMA flood zone
- X (unshaded)
- Chance of flooding over 30 yrs
- 0.0%
- Est. flood insurance / yr
- $473 – $860
Fire risk 3/10 · Minor
- Est. fire insurance / yr
- $804 – $1,492
Heat risk 4/10 · Minor
- Hot days now (above 105°F)
- 7 days/yr
- Hot days in 30 yrs
- 19 days/yr
Wind risk 2/10 · Minimal
- Chance of severe wind over 30 yrs
- 1.0%
Air-quality risk 4/10 · Minor
- Unhealthy air days now
- 3 days/yr
- Unhealthy air days in 30 yrs
- 5 days/yr
Risk factors via First Street. Map © Google.
Why this score? — see what drove the B- grade
The composite is a weighted blend of 9 inputs, each scored 0–100. Each bar is that input's sub-score; the figure is the points it added to the 100-point composite (weight × sub-score).
- Cash flow +25.1/30.0
- ARV discount +15.0/15.0
- DSCR +8.2/10.0
- 1% rule +5.6/10.0
- Livability +3.6/5.0
- Schools +2.8/10.0
- Rent growth +2.5/5.0
- Condition / age +2.5/5.0
- Appreciation +0.0/10.0
$99,900
🖨 Deal sheet 📄 Offer letter ✓ Due diligence
Listing remarks
Welcome Home. Come see this 2-3 bedroom, 1 bath one story home, on a quiet street, close to Walmart and the hospital. Cute little back yard, 1 car garage with a large extra shop area. Large rooms, lots of character, what more could you ask for??? Call today. Please NOTE: CH lists the home as 1728 Sqft, this appears high and should be verified.
Key facts
- Quiet street
- Back yard
- Extra shop area
Tags
Property features AI
Exterior
- Parking: Attached garage (1 car)
- Utilities: Public water; Public sewer
- Home design: Single-family residence; One level / 1 story
- Construction: Brick and vinyl siding with other materials; Slab foundation; Rubber/other roof
- Exterior features: Concrete road surface
Interior
- Kitchen: No kitchen appliance details provided
- Bedrooms: Total rooms: 6
- Bathrooms: 1 full bathroom
- Heating & cooling: Natural gas forced-air heating; Central air conditioning
- Interior features: Gas water heater; Fireplace (1)
- Laundry & utility: Laundry on main level
Neighborhood map
What this means for you Summary
Snapshot
- This is a 2-bed/1.0-bath single-family listed at $100k.
Deal economics
- At list price, monthly cash flow is $220 ($3k/yr) — positive.
- The deal already cash-flows at list — no discount required.
- Meets the 1% rule at list price ($1k rent vs $100k).
- Recommended offer: $97k (3.0% below list) — sets the bar for market timing.
Location & tenants
- Location reads 71/100 on livability (#342 in IL) — a middle-class / working-renter tenant base. Strengths: cost of living A+, housing A+, health & safety A+; Watch: employment D, crime F, amenities F.
- Paris-Union SD 95 (town): math 25% / reading 42% proficiency, ranked #227 of 620 in IL (top 37%) — families likely to look elsewhere, expect single-tenant / working-renter base with shorter leases.
- Market conditions: 82 active listings in the ZIP; 6 units permitted in Edgar County in 2024 (0 in 5+ unit buildings).
Forward outlook
- Local home prices are declining (-3.0%/yr); year-one equity from $691 of loan paydown is wiped out by about $3k of value loss. Plan a longer hold.
- Edgar County population projected at -30% by 2050 — secular population decline; favor cash flow + early exit over multi-decade hold.
Negotiation context
- It's been on market 47 days — a 3% lower offer ($97k) is reasonable based on typical stale-listing flexibility.
Risks & watch-outs
- Watch-outs: built in 1954 — expect roof / HVAC / electrical / plumbing capex.
Questions for the listing agent
- It's been on market 47 days. Have you received any prior offers? Is the seller open to a 3% concession, seller financing, or rate buy-down credit?
- Built in 1954 — when were the roof, HVAC, electrical panel, plumbing, and water heater last replaced?
- Is there a deadline driving the sale (1031 exchange, divorce, estate, relocation)? That informs how much negotiation room exists.
- Crime grade is F in this area — have there been break-ins, vandalism, or insurance claims at this property in the last 3 years? What carrier currently insures it and at what premium?
- What's the average days-on-market for RENTAL listings here right now (not sales)? A rising rental-DOM trend means longer vacancies and softer asking-rent achievability than the comps imply.
- What's the recent tenant-quality profile in this submarket — average credit score on applications, eviction rate, late-payment / NSF rate, and stable-employment percentage? A property-management company in the area should have these aggregated.
- How much new for-sale + rental construction is in the pipeline within 1–3 miles? Heavy new supply typically softens prices + rents 12–24 months out; constrained supply supports both.
Investment metrics
- 1% rule
- 1.06% ✓
- Cap rate
- 8.93%
- Cash-on-cash
- 9.42%
- DSCR
- 1.42
- GRM
- 7.9
CMA / ARV
- ARV (median comp)
- $145,646
- List price
- $99,900
- Delta
- -31.41%
- Verdict
- UNDERPRICED
- Comps
- 20 within 1.0 mi
Show comp detail 12 sales within ~0.75 mi
| Address | Dist | Beds/Ba | Sqft | Sold | Price | $/sf | Match |
|---|---|---|---|---|---|---|---|
| 112 S Eads Ave | 0.13mi | 3/2.0 (+1) | 1,648 (-5%) | 1mo | $212,000 | $129 | 77 |
| 628 E Wood St | 0.15mi | 3/1.5 (+1) | 1,824 (+6%) | 8mo | $190,000 | $104 | 70 |
| 104 N High St | 0.17mi | 3/1.5 (+1) | 1,624 (-6%) | 13mo | $137,500 | $85 | 64 |
| 523 E Court St | 0.23mi | 3/2.0 (+1) | 1,668 (-4%) | 14mo | $162,900 | $98 | 62 |
| 629 E Union St | 0.34mi | 3/1.5 (+1) | 1,680 (-3%) | 19mo | $167,000 | $99 | 56 |
| 226 E Washington St | 0.54mi | 2/1.0 | 1,630 (-6%) | 12mo | $100,000 | $61 | 55 |
| 5 Magnolia Mnr | 0.65mi | 3/2.0 (+1) | 1,646 (-5%) | 4mo | $136,000 | $83 | 50 |
| 8965 Terre Haute Rd | 0.51mi | 3/2.0 (+1) | 1,698 (-2%) | 18mo | $165,000 | $97 | 49 |
| 709 Hannah Ave | 0.56mi | 3/1.5 (+1) | 1,606 (-7%) | 14mo | $83,500 | $52 | 43 |
| 414 E Wood St | 0.41mi | 3/1.0 (+1) | 1,978 (+14%) | 14mo | $103,000 | $52 | 40 |
| 8 Briar Hill Rd | 0.73mi | 3/2.0 (+1) | 1,568 (-9%) | 2mo | $210,000 | $134 | 40 |
| 230 E Madison St | 0.50mi | 3/2.0 (+1) | 1,956 (+13%) | 11mo | $50,000 | $26 | 36 |
Match score weights: distance 35% · size 25% · config 20% · recency 20%. Top-matched comps best support the ARV.
Projected returns pro-forma
-3.0% appreciation · 3.0% rent growth · sell at horizon
- IRR
- -2.1%
- Equity multiple
- 0.92×
- Total profit
- $-2,230
- Equity at exit
- $14,895
- IRR
- 7.5%
- Equity multiple
- 1.57×
- Total profit
- $15,944
- Equity at exit
- $8,638
Cash invested: $27,972 (down + closing). Projections, not guarantees.
Landlord ↔ Tenant lean methodology
- Overall (STATE)
- 43 Moderately Tenant-Leaning
- State Illinois
- 43 Moderately Tenant-Leaning · D+7
- County
- — inherits STATE
- City
- — inherits STATE
ZIP-level market 61944
- Active inventory
- 82
- Price-to-rent
- 7.9×
Monthly cashflow live
- Estimated rent
- $1,054 medium interval (Pro) →
- Mortgage (P&I)
- −$524
- Tax from tax record
- −$48 /mo · $574/yr
- Insurance
- −$42
- HOA
- −$0
- Vacancy / Maint / Mgmt
- −$221
- Net cashflow
- $220
Break-even live
UW: 25.0% down · 7.5% · 30yr · 1.5% tax · 5.0% vac · 8.0% maint · 8.0% mgmt
Financing live
Cash to close
- Down payment
- $24,975
- Closing costs
- $2,997
- Reserves months
- —
- Total cash needed
- —
Loan-product check · same deal, 3 products live
Conventional
25% down · 7.5% · 30yr
- Down + closing
- —
- Monthly P&I
- —
- Monthly cashflow
- —
- DSCR
- —
- Eligible?
- —
Personal DTI + credit; lowest rate.
DSCR
20% down · 8.5% · 30yr
- Down + closing
- —
- Monthly P&I
- —
- Monthly cashflow
- —
- DSCR
- —
- Eligible?
- —
No personal income docs; deal must DSCR.
Hard money
10% down · 12.0% · 12mo
- Down + closing
- —
- Monthly P&I
- —
- Monthly cashflow
- —
- DSCR
- —
- Eligible?
- —
Short-term bridge; refi at stabilization.
Listing history 16 events
-
2026-06-17status $99,900 Pending 47 DOM
-
2026-06-17days on market $99,900 Active 47 DOM
-
2026-06-16days on market $99,900 Active 46 DOM
-
2026-06-15days on market $99,900 Active 45 DOM
-
2026-06-13days on market $99,900 Active 43 DOM
-
2026-06-12days on market $99,900 Active 42 DOM
-
2026-06-09days on market $99,900 Active 39 DOM
-
2026-06-08days on market $99,900 Active 38 DOM
-
2026-06-07days on market $99,900 Active 37 DOM
-
2026-06-07days on market $99,900 Active 36 DOM
-
2026-06-04days on market $99,900 Active 33 DOM
-
2026-06-02days on market $99,900 Active 32 DOM
-
2026-06-01days on market $99,900 Active 31 DOM
-
2026-05-31days on market $99,900 Active 30 DOM
-
2026-05-31days on market $99,900 Active 29 DOM
-
2026-04-30$99,900 Active 346-char remark
ⓘ Source: listings_history table (triggers on properties + properties_extension) + one-shot
backfill from property_details.listing_events for pre-trigger history.
Tax reassessment forecast IL · Partial reset (capped growth)
- Current annual tax
- $574 · $48/mo
- Projected year-2 tax
- $1,421 · $118/mo
- Expected delta
- +$847/yr (+$71/mo · 147.5%)
ⓘ Screening estimate from a state-policy table — verify with the county assessor before closing.
Climate risk First Street
- Flood 1/10 Low FEMA zone X (unshaded) · 0% chance over 30 yrs
- Wildfire 3/10 Moderate
- Heat 4/10 Moderate 7 d/yr ≥105°F today · 19 d/yr by 30 yrs out
- Wind 2/10 Low 100% chance of damaging wind over 30 yrs
- Air quality 4/10 Moderate 3 unhealthy d/yr today · 5 by 30 yrs out
Nearby sold comps map
Loading sold comps map…
Walkable amenities ~0.75 mi
Loading nearby amenities…
Taxation est. · year 1
- Rental income
- $12,653
- − Mortgage interest
- −$5,596
- − Property taxes
- −$574
- − Insurance
- −$500
- − Repairs & maintenance
- −$1,012
- − Management
- −$1,012
- − Depreciation
- −$2,906
- Taxable income
- $1,053
- Est. tax owed @ 24.0%
- −$253
- After-tax cash flow
- $2,383/yr
For passive investors: Depreciation is non-cash, so a rental often shows a tax loss while cash-flowing — sheltering income. Rental losses are passive: they offset passive income freely, and up to $25,000/yr can offset ordinary (W-2) income if you actively participate and your MAGI is under $100k (phasing out to $0 by $150k); unused losses carry forward. On sale, claimed depreciation is recaptured at up to 25%, and gains may owe capital-gains tax (a 1031 exchange can defer both). Figures are a year-1 estimate at your 24.0% rate — not tax advice; consult a CPA.
Schools (NCES district)
- District
- Paris-Union SD 95
- NCES district ID
- 1730750
- Math proficiency
- 25% ▼ -4.00%
- Reading proficiency
- 42% ▼ -7.00%
- Median HH income
- $36,294
- Composite
- 27.73/100
- National rank
- #6901
- State rank
- #227 of 620 in IL
Livability — Paris
- Score
- 71/100
- State rank
- #342
- US rank
- #6933
Category grades
Schools grade is shown separately in the Schools card above.
Census & demographics
- Census place
- Paris, IL
- City population
- 11,426
- Population (ZIP)
- 11,426
Population outlook (Edgar County) Hauer SSP2
- Today (2025)
- 15,960 people
- By 2030
- 14,978 · -6.2%
- By 2040
- 12,990 · -18.6%
- By 2050
- 11,087 · -30.5%
- By 2075
- 7,338 · -54.0%
- By 2100
- 4,526 · -71.6%
Race, ethnicity, and origin ACS 2023
- Neighborhood character
- Predominantly White (96%)
- Race & ethnicity
- White 96% Two or more races 3% Hispanic / Latino 1%
- Common ancestry
- Slovak 2% Serbian 2% Italian 1%
- Foreign-born
- 1%
- Languages at home
- 98% English-only · Spanish 1% Other Indo-European 1%
Political lean MEDSL · Edgar
- 2024 margin
- Solid R (+52.4) · D 23.0% · R 75.3% · Other 1.7%
- 2008→2024 swing
- -44.4pp toward R · 2008: -7.9pp · 2024: -52.4pp
- All cycles
- 2024: R+52.4 2020: R+52.5 2016: R+49.5 2012: R+32.8 2008: R+7.9
Not yet ingested
- Civics
- —
Market trends
- HPI YoY
- ▼ -66.48%
- Current HPI
- 108.1718
- Rent YoY
- —
- Metro
- —
- State GDP YoY
- ▲ 1.59%
- F500 in state
- 60
Industry mix (Fortune 500 HQ in IL)
| Industry | F500 HQs | Revenue |
|---|---|---|
| Insurance | 4 | $201B |
|
||
| Consumer Goods | 4 | $87B |
|
||
| Industrial Machinery | 3 | $64B |
|
||
| Healthcare | 2 | $55B |
|
||
| Retail / Pharmacy | 1 | $148B |
|
||
| Agriculture / Food | 1 | $86B |
|
||
Price history
2 events — show timeline
- 2026-06-17 Pending — CIBR
- 2026-04-30 Listed $99,900 CIBR
Property tax history
-0.5%/yrLatest (2024): $574 · -0.3% YoY. Source: county tax records.
Cash-flow waterfall
monthlySold comps — $/sqft
last 12 mo · ≤1 miLoading sold comps…