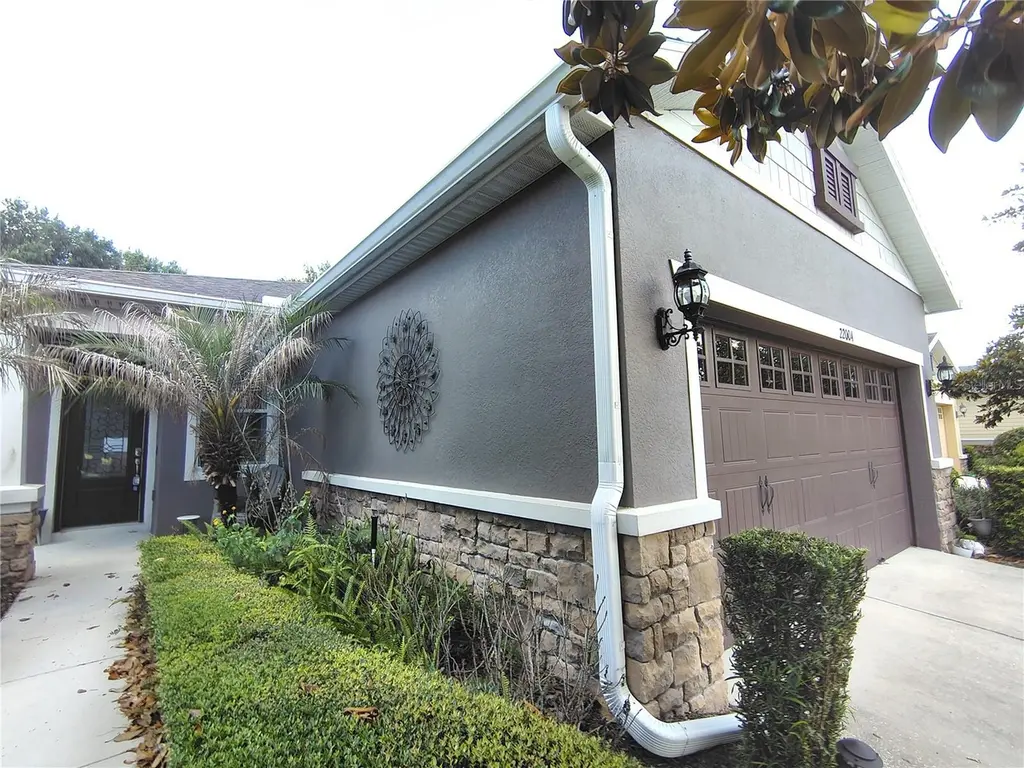
22004 Belgian Ct · Mount Dora, FL
Flood risk 1/10 · Minimal
- FEMA flood zone
- X (unshaded)
- Chance of flooding over 30 yrs
- 0.0%
- Est. flood insurance / yr
- $507 – $1,088
Fire risk 6/10 · Moderate
- Est. fire insurance / yr
- $947 – $1,759
Heat risk 9/10 · Severe
- Hot days now (above 108°F)
- 7 days/yr
- Hot days in 30 yrs
- 23 days/yr
Wind risk 10/10 · Severe
- Chance of severe wind over 30 yrs
- 99.0%
Air-quality risk 2/10 · Minimal
- Unhealthy air days now
- 1 days/yr
- Unhealthy air days in 30 yrs
- 1 days/yr
Risk factors via First Street. Map © Google.
Why this score? — see what drove the B grade
The composite is a weighted blend of 9 inputs, each scored 0–100. Each bar is that input's sub-score; the figure is the points it added to the 100-point composite (weight × sub-score).
- Cash flow +30.0/30.0
- 1% rule +10.0/10.0
- DSCR +10.0/10.0
- ARV discount +7.5/15.0
- Schools +4.2/10.0
- Livability +3.8/5.0
- Rent growth +2.6/5.0
- Condition / age +2.5/5.0
- Appreciation +0.0/10.0
$85,000
🖨 Deal sheet 📄 Offer letter ✓ Due diligence
Listing remarks
Auction Property. The LIST PRICE is not indicative of Seller's Final Reserve amount. This Property is part of an ONLINE BIDDING EVENT. INSPECTIONS of this property and CONTACT with Occupants are strictly prohibited. Property is Sold "As-Is" and No For Sale Sign allowed. All offers from interested buyers must be entered online at the Auction website for the duration of the time that this property is in auction. Registration to bid is now available on the property's listing page on the auction website. Online Bidding will begin on June14th and ends June 16th.
Key facts
- 4,609 sq ft lot
- 2 garage spots
- Community pool
Property features AI
Finance
- Other: Association handled by Access Management-Kristina Chatburn
- Financial info: Total annual fees reported as $5,484; Total monthly fees reported as $457
- HOA & community: Monthly HOA fee of $162 (association fee required); Additional monthly maintenance amount of $295; Association provides clubhouse, fitness center, and gated access; Community amenities include clubhouse, community mailbox, deed restrictions, dog park, fitness center, park, playground, pool, sidewalks, tennis courts, and golf-cart-friendly roads; Irrigation with reclaimed water; Pets allowed (cats and dogs; breed restrictions and number limits apply); Senior community
Exterior
- Parking: Attached 2-car garage
- Security: Gated community
- Utilities: Public sewer; Water connected; Electricity connected; Cable connected; Broadband/high-speed internet available; Public utilities
- Home design: Single family residence; One-story; Faces west; Living area listed as 1,437 sq ft
- Construction: Block construction; Shingle roof; Slab foundation; Building area total listed as 2,130 sq ft; Year built not provided
- Exterior features: Exterior lighting; Asphalt/paved road access; Lot about 0.11 acres (0 to less than 1/4 acre)
Interior
- Kitchen: Dishwasher; Disposal; Ice maker; Microwave; Range; Refrigerator; Electric water heater
- Bedrooms: 3 bedrooms
- Flooring: Carpet; Ceramic tile; Tile; Wood
- Bathrooms: 2 full bathrooms
- Heating & cooling: Central heating; Central air
- Interior features: Ceiling fans; High ceilings; Open floorplan with combined living and dining area; Solid wood cabinets; Stone counters; Thermostat; Walk-in closets; Window treatments
- Laundry & utility: Washer hookup; Dryer hookup (electric); Laundry closet
Neighborhood map
What this means for you Summary
Snapshot
- This is a 3-bed/2.0-bath single-family listed at $85k.
Deal economics
- At list price, monthly cash flow is $554 ($7k/yr) — positive.
- The deal already cash-flows at list — no discount required.
- Meets the 1% rule at list price ($2k rent vs $85k).
- Cap rate 14.1% vs local median 3.3% in Mount Dora — top-decile yield for the area; either an underpriced asset or a hidden risk that comps aren't pricing in. Stress-test before assuming the spread holds.
Location & tenants
- Location reads 75/100 on livability (#244 in FL, #3,860 nationally) — a middle-class / working-renter tenant base. Strengths: health & safety A+, crime A, housing A-; Watch: employment D+, amenities F, commute F.
- Lake (suburban): math 49% / reading 50% proficiency, ranked #37 of 73 in FL (top 51%) — families likely to look elsewhere, expect single-tenant / working-renter base with shorter leases.
- Market conditions: Rents flat; 639 active listings in the ZIP; 4 comparable units currently listed for rent nearby; rentals at typical pace (median 24d on market — plan ~3-4 weeks tenant-placement turnaround); solid renter incomes; 4,799 units permitted in Lake County in 2024 (814 in 5+ unit buildings).
- This rent runs 36% of the median local income ($77k/yr) — at the standard rent-burdened threshold; future hikes will face affordability resistance.
Forward outlook
- Local home prices are declining (-3.0%/yr); year-one equity from $588 of loan paydown is wiped out by about $3k of value loss. Plan a longer hold.
- Lake County population projected at +37% by 2050 — long-run rental-demand tailwind backs the buy-and-hold thesis.
- At projected returns (-3.0% appreciation + 0.6% rent growth), your $24k cash investment doubles in ~6 years — after that, you're playing with house money.
Negotiation context
- Only 7 days on market — expect competitive offers; lowballing is unlikely to land.
- 5 sale attempts since 5y ago; this cycle's ask has dropped $245k (74%) from the opening price — seller is motivated, your offer sets the floor, not the list.
Risks & watch-outs
- Watch-outs: property tax is 4.6% of price; HOA is 20% of rent.
- Climate carrying-cost: severe wind risk, 99% chance of damaging wind over 30y; major wildfire risk; extreme-heat days projected 7→23/yr by 2055 (HVAC capex compounding) — expect insurance premiums to compound above CPI over the hold.
Questions for the listing agent
- Property tax is high relative to price — has the assessment been appealed recently, and will the sale trigger a re-assessment?
- What does the HOA fee cover, when was the last increase, and are there any pending special assessments or reserve-fund shortfalls?
- Is there a deadline driving the sale (1031 exchange, divorce, estate, relocation)? That informs how much negotiation room exists.
- What's the average days-on-market for RENTAL listings here right now (not sales)? A rising rental-DOM trend means longer vacancies and softer asking-rent achievability than the comps imply.
- What's the recent tenant-quality profile in this submarket — average credit score on applications, eviction rate, late-payment / NSF rate, and stable-employment percentage? A property-management company in the area should have these aggregated.
- How much new for-sale + rental construction is in the pipeline within 1–3 miles? Heavy new supply typically softens prices + rents 12–24 months out; constrained supply supports both.
Investment metrics
- 1% rule
- 2.73% ✓
- Cap rate
- 14.11%
- Cash-on-cash
- 27.93%
- DSCR
- 2.24
- GRM
- 3.1
CMA / ARV
No comps found within radius.
Projected returns pro-forma
-3.0% appreciation · 0.55% rent growth · sell at horizon
- IRR
- 17.9%
- Equity multiple
- 1.69×
- Total profit
- $16,384
- Equity at exit
- $12,674
- IRR
- 23.5%
- Equity multiple
- 2.67×
- Total profit
- $39,746
- Equity at exit
- $7,349
Cash invested: $23,800 (down + closing). Projections, not guarantees.
Landlord ↔ Tenant lean methodology
- Overall (STATE)
- 87 Strongly Landlord-Friendly
- State Florida
- 87 Strongly Landlord-Friendly · R+3
- County
- — inherits STATE
- City
- — inherits STATE
ZIP-level market 32757
- Home prices YoY
- -34.5%
- Rents YoY
- 0.6%
- Active inventory
- 639
- Price-to-rent
- 3.1×
Monthly cashflow live
- Estimated rent
- $2,322 medium interval (Pro) →
- Mortgage (P&I)
- −$446
- Tax from tax record
- −$324 /mo · $3,886/yr
- Insurance
- −$35
- HOA
- −$475
- Vacancy / Maint / Mgmt
- −$488
- Net cashflow
- $554
Break-even live
UW: 25.0% down · 7.5% · 30yr · 1.5% tax · 5.0% vac · 8.0% maint · 8.0% mgmt
Financing live
Cash to close
- Down payment
- $21,250
- Closing costs
- $2,550
- Reserves months
- —
- Total cash needed
- —
Loan-product check · same deal, 3 products live
Conventional
25% down · 7.5% · 30yr
- Down + closing
- —
- Monthly P&I
- —
- Monthly cashflow
- —
- DSCR
- —
- Eligible?
- —
Personal DTI + credit; lowest rate.
DSCR
20% down · 8.5% · 30yr
- Down + closing
- —
- Monthly P&I
- —
- Monthly cashflow
- —
- DSCR
- —
- Eligible?
- —
No personal income docs; deal must DSCR.
Hard money
10% down · 12.0% · 12mo
- Down + closing
- —
- Monthly P&I
- —
- Monthly cashflow
- —
- DSCR
- —
- Eligible?
- —
Short-term bridge; refi at stabilization.
Rent comps 4 comps
| Address | Beds | Baths | Sqft | Rent | $/sqft | DOM | Units | Dist |
|---|---|---|---|---|---|---|---|---|
| 22011 Belgian Ct Mount Dora, FL | 3.0 | 2.0 | 1762 | $2,200 | $1.25 | 14d | 1 | 0.01mi |
| 5727 Rutherford Rd Mount Dora, FL | 4.0 | 2.0 | 1584 | $2,200 | $1.39 | 17d | 1 | 0.53mi |
| 22521 Coronado Somerset Dr Sorrento, FL | 3.0 | 2.0 | 1674 | $2,200 | $1.31 | 23d | 1 | 1.08mi |
| 4574 Boxwood Way Mount Dora, FL | 4.0 | 2.0 | 1846 | $2,395 | $1.30 | 23d | 1 | 1.44mi |
HOA detail
- Monthly dues
- $475 · $5,700/yr
Listing history 18 events
-
2026-06-10statusdays on market $85,000 Pending 7 DOM
-
2026-06-04days on market $85,000 Active 6 DOM
-
2026-06-03days on market $85,000 Active 5 DOM
-
2026-06-02days on market $85,000 Active 4 DOM
-
2026-06-01days on market $85,000 Active 3 DOM
-
2026-05-31days on market $85,000 Active 2 DOM
-
2026-03-25price $305,000
-
2025-11-21price $309,699
-
2025-10-27status Active
-
2025-10-23status Pending
-
2025-09-09price $309,700
-
2025-07-29status Active
-
2025-07-25status Pending
-
2025-07-11price $319,000
-
2025-02-27price $325,000
-
2025-02-19$330,000 Active
-
2024-04-25$360,000 Active
-
2021-06-11$248,500
ⓘ Source: listings_history table (triggers on properties + properties_extension) + one-shot
backfill from property_details.listing_events for pre-trigger history.
Tax reassessment forecast FL · Resets to sale price
- Current annual tax
- $3,886 · $324/mo
- Projected year-2 tax
- $3,886 · $324/mo
- Expected delta
- $0/yr ($0/mo · 0.0%)
ⓘ Screening estimate from a state-policy table — verify with the county assessor before closing.
Climate risk First Street
- Flood 1/10 Low FEMA zone X (unshaded) · 0% chance over 30 yrs
- Wildfire 6/10 Major
- Heat 9/10 Extreme 7 d/yr ≥108°F today · 23 d/yr by 30 yrs out
- Wind 10/10 Extreme 99% chance of damaging wind over 30 yrs
- Air quality 2/10 Low 1 unhealthy d/yr today · 1 by 30 yrs out
Nearby sold comps map
Loading sold comps map…
Walkable amenities ~0.75 mi
Loading nearby amenities…
Taxation est. · year 1
- Rental income
- $27,858
- − Mortgage interest
- −$4,761
- − Property taxes
- −$3,886
- − Insurance
- −$425
- − Repairs & maintenance
- −$2,229
- − Management
- −$2,229
- − HOA
- −$5,700
- − Depreciation
- −$2,473
- Taxable income
- $6,156
- Est. tax owed @ 24.0%
- −$1,477
- After-tax cash flow
- $5,170/yr
For passive investors: Depreciation is non-cash, so a rental often shows a tax loss while cash-flowing — sheltering income. Rental losses are passive: they offset passive income freely, and up to $25,000/yr can offset ordinary (W-2) income if you actively participate and your MAGI is under $100k (phasing out to $0 by $150k); unused losses carry forward. On sale, claimed depreciation is recaptured at up to 25%, and gains may owe capital-gains tax (a 1031 exchange can defer both). Figures are a year-1 estimate at your 24.0% rate — not tax advice; consult a CPA.
Schools (NCES district)
- District
- Lake
- NCES district ID
- 1201050
- Math proficiency
- 49% ▼ -7.00%
- Reading proficiency
- 50% ▼ -4.00%
- Median HH income
- $46,632
- Composite
- 42.05/100
- National rank
- #3327
- State rank
- #37 of 73 in FL
Livability — Mount Dora
- Score
- 75/100
- State rank
- #244
- US rank
- #3860
Category grades
Schools grade is shown separately in the Schools card above.
Census & demographics
- County
- Lake County · 364,602 people
- City population
- 34,121
- Metro
- Orlando-Kissimmee-Sanford, FL
- Population (ZIP)
- 34,121
- Household income
- $77,216
- Rent vs Own
- Severe rent burden
- 998.0
Population outlook (Lake County) Hauer SSP2
- Today (2025)
- 386,640 people
- By 2030
- 417,107 · +7.9%
- By 2040
- 476,676 · +23.3%
- By 2050
- 531,296 · +37.4%
- By 2075
- 648,303 · +67.7%
- By 2100
- 698,530 · +80.7%
Race, ethnicity, and origin ACS 2023
- Neighborhood character
- Majority White (64%)
- Race & ethnicity
- White 64% Hispanic / Latino 20% Black 12% Two or more races 11% Pacific Islander 1% Native American 1%
- Hispanic origin (detail)
- Mexican 5% Puerto Rican 7% Dominican 1%
- Common ancestry
- Romanian 3% Slovak 3% Lithuanian 2%
- Foreign-born
- 10% · Canada, Jamaica
- Languages at home
- 83% English-only · Spanish 14% Other Indo-European 1%
Political lean MEDSL · Lake
- 2024 margin
- Strong R (+24.7) · D 37.3% · R 62.0%
- 2008→2024 swing
- -11.2pp toward R · 2008: -13.5pp · 2024: -24.7pp
- All cycles
- 2024: R+24.7 2020: R+20.0 2016: R+23.1 2012: R+17.1 2008: R+13.5
Not yet ingested
- Civics
- —
Market trends
- HPI YoY
- ▼ -154.69%
- Current HPI
- 293.4759
- Rent YoY
- ▲ 0.55%
- Metro
- Orlando-Kissimmee-Sanford, FL
- State GDP YoY
- ▲ 3.28%
- F500 in state
- 36
Industry mix (Fortune 500 HQ in FL)
| Industry | F500 HQs | Revenue |
|---|---|---|
| Industrial Technology | 2 | $29B |
|
||
| Insurance | 2 | $17B |
|
||
| Retail | 1 | $60B |
|
||
| Technology Distribution | 1 | $58B |
|
||
| Homebuilding | 1 | $35B |
|
||
| Technology Manufacturing | 1 | $35B |
|
||
Price history
+22.7% since first listed12 events — show timeline
- 2026-03-25 Price Changed $305,000 Stellar MLS as Distributed by MLS Grid
- 2025-11-21 Price Changed $309,699 Stellar MLS as Distributed by MLS Grid
- 2025-10-27 Relisted — Stellar MLS as Distributed by MLS Grid
- 2025-10-23 Pending — Stellar MLS as Distributed by MLS Grid
- 2025-09-09 Price Changed $309,700 Stellar MLS as Distributed by MLS Grid
- 2025-07-29 Relisted — Stellar MLS as Distributed by MLS Grid
- 2025-07-25 Pending — Stellar MLS as Distributed by MLS Grid
- 2025-07-11 Price Changed $319,000 Stellar MLS as Distributed by MLS Grid
- 2025-02-27 Price Changed $325,000 Stellar MLS as Distributed by MLS Grid
- 2025-02-19 Listed $330,000 Stellar MLS as Distributed by MLS Grid
- 2024-04-25 Listed $360,000 Stellar MLS as Distributed by MLS Grid
- 2021-06-11 Listed $248,500 Stellar MLS as Distributed by MLS Grid
Property tax history
+25.5%/yrLatest (2025): $3,886 · +2.7% YoY. Source: county tax records.
Cash-flow waterfall
monthlySold comps — $/sqft
last 12 mo · ≤1 miLoading sold comps…