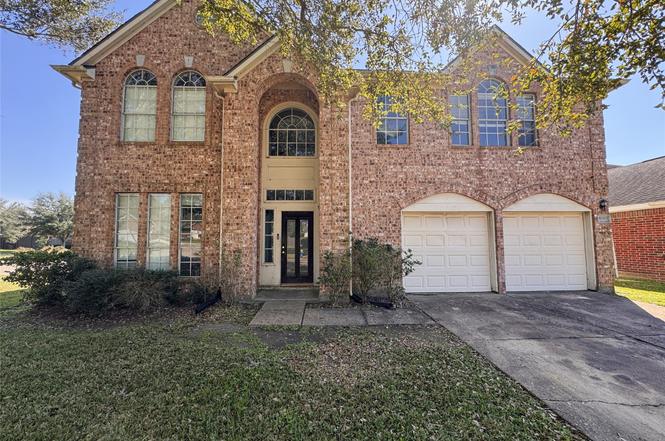
1803 Shadow Haven Ct · Fresno, TX
Flood risk 3/10 · Minor
- FEMA flood zone
- X (unshaded)
- Chance of flooding over 30 yrs
- 0.2%
- Est. flood insurance / yr
- $507 – $1,088
Fire risk 5/10 · Moderate
- Est. fire insurance / yr
- $1,222 – $2,270
Heat risk 9/10 · Severe
- Hot days now (above 110°F)
- 7 days/yr
- Hot days in 30 yrs
- 24 days/yr
Wind risk 9/10 · Severe
- Chance of severe wind over 30 yrs
- 99.0%
Air-quality risk 2/10 · Minimal
- Unhealthy air days now
- 2 days/yr
- Unhealthy air days in 30 yrs
- 2 days/yr
Risk factors via First Street. Map © Google.
Why this score? — see what drove the B- grade
The composite is a weighted blend of 9 inputs, each scored 0–100. Each bar is that input's sub-score; the figure is the points it added to the 100-point composite (weight × sub-score).
- Cash flow +21.6/30.0
- ARV discount +15.0/15.0
- 1% rule +7.6/10.0
- DSCR +6.9/10.0
- Schools +4.5/10.0
- Appreciation +4.0/10.0
- Livability +3.1/5.0
- Condition / age +2.5/5.0
- Rent growth +2.3/5.0
$230,000
🖨 Deal sheet (PDF) 📄 Offer letter ✓ Due diligence
Listing remarks
This spacious 5-bedroom, 3.5-bathroom home in the well-established Teal Run subdivision is a fantastic investment or design opportunity! With 3,046 sq. ft. , this property offers a generous layout featuring a large living area, formal dining, and a versatile upstairs game room The home is being sold AS IS, making it the perfect blank slate to create your ideal aesthetic. Whether you're looking to customize for personal use or take advantage of its potential as an investment property, the possibilities are endless. Situated in a convenient location near shopping, dining, and major highways, this home offers great value for those willing to bring their vision to life. Don't miss out—sc
Key facts
- Formal dining
- Large living area
- Near shopping
Tags
Neighborhood map
What this means for you Summary
Snapshot
- This is a 5-bed/4.0-bath single-family listed at $230k.
Deal economics
- At list price, monthly cash flow is $350 ($4k/yr) — positive.
- The deal already cash-flows at list — no discount required.
- Meets the 1% rule at list price ($3k rent vs $230k).
- Recommended offer: $227k (1.5% below list) — sets the bar for market timing.
- Cap rate 8.1% vs local median 5.3% in Fresno — top-decile yield for the area; either an underpriced asset or a hidden risk that comps aren't pricing in. Stress-test before assuming the spread holds.
Location & tenants
- Location reads 62/100 on livability (#943 in TX) — a middle-class / working-renter tenant base. Strengths: employment A+, housing A+, cost of living A; Watch: crime C-, amenities F, commute F.
- Fort Bend ISD (suburban): math 44% / reading 53% proficiency, ranked #140 of 826 in TX (top 17%) — families likely to look elsewhere, expect single-tenant / working-renter base with shorter leases.
- Zoned schools: Walter Moses Burton El (math 12% / reading 27%, grade F, #3,583 of 4,322 statewide, top 86%, 451 students, 81% FRL); Lake Olympia Middle (math 18% / reading 31%, grade F, #1,279 of 1,662 statewide, top 78%, 1,170 students, 71% FRL); Fort Bend Co Alter (26 students, 0% FRL) — zoned schools average 51% FRL vs 35% district-wide (16 pts higher); higher-poverty schools than district average — tighter screening recommended.
- Zoned-school proficiency averages 22% at this address vs 48% district-wide (-26 pts) — the specific schools serving this property underperform the Fort Bend ISD average; the district grade overstates school quality for this exact location.
- Market conditions: Rents soft (-0.9%/yr); 178 active listings in the ZIP; 4 comparable units currently listed for rent nearby; rentals lingering (median 46d on market — plan ~5-8 weeks vacancy on turnover, expect pricing pressure); 50% of comp listings sitting > 30 days — soft ceiling on asking rent; solid renter incomes; 12,093 units permitted in Fort Bend County in 2024 (815 in 5+ unit buildings).
- This rent runs 37% of the median local income ($94k/yr) — at the standard rent-burdened threshold; future hikes will face affordability resistance.
Forward outlook
- Local home prices are declining (-2.0%/yr); year-one equity from $2k of loan paydown is wiped out by about $5k of value loss. Plan a longer hold.
- Fort Bend County population projected at +75% by 2050 — long-run rental-demand tailwind backs the buy-and-hold thesis.
Negotiation context
- It's been on market 28 days — a 2% lower offer ($227k) is reasonable based on typical stale-listing flexibility.
- 10 sale attempts since 17y ago with the ask held roughly flat each time — persistent listings suggest the price (not the market) is what's stuck; bring a comps-based counter.
Risks & watch-outs
- Watch-outs: property tax is 3.1% of price.
- Climate carrying-cost: severe wind risk, 99% chance of damaging wind over 30y; moderate wildfire risk; extreme-heat days projected 7→24/yr by 2055 (HVAC capex compounding) — expect insurance premiums to compound above CPI over the hold.
Questions for the listing agent
- Property tax is high relative to price — has the assessment been appealed recently, and will the sale trigger a re-assessment?
- What does the HOA fee cover, when was the last increase, and are there any pending special assessments or reserve-fund shortfalls?
- Is there a deadline driving the sale (1031 exchange, divorce, estate, relocation)? That informs how much negotiation room exists.
- Schools are D-rated, which usually means shorter tenancies and higher turnover. Who's the typical renter profile here, and what's been the actual vacancy rate?
- What's the average days-on-market for RENTAL listings here right now (not sales)? A rising rental-DOM trend means longer vacancies and softer asking-rent achievability than the comps imply.
- What's the recent tenant-quality profile in this submarket — average credit score on applications, eviction rate, late-payment / NSF rate, and stable-employment percentage? A property-management company in the area should have these aggregated.
- How much new for-sale + rental construction is in the pipeline within 1–3 miles? Heavy new supply typically softens prices + rents 12–24 months out; constrained supply supports both.
Investment metrics
- 1% rule
- 1.26% ✓
- Cap rate
- 8.12%
- Cash-on-cash
- 6.53%
- DSCR
- 1.29
- GRM
- 6.6
CMA / ARV
- ARV (on-the-fly)
- $328,968
- Comps found
- 12
Show comp detail 12 sales within ~0.75 mi
| Address | Dist | Beds/Ba | Sqft | Sold | Price | $/sf | Match |
|---|---|---|---|---|---|---|---|
| 1803 Shadow Haven Ct | 0.00mi | 5/3.5 | 3,046 (0%) | 1mo | $230,000 | $76 | 97 |
| 1802 Coretta Ct | 0.02mi | 5/2.5 | 3,052 (+0%) | 7mo | $359,999 | $118 | 87 |
| 1806 Coretta Ct | 0.03mi | 4/2.5 (-1) | 2,680 (-12%) | 5mo | $264,999 | $99 | 63 |
| 4510 W Thunderwood Cir | 0.35mi | 4/2.5 (-1) | 3,155 (+4%) | 4mo | $260,000 | $82 | 63 |
| 1815 Teal Run Place Dr | 0.16mi | 4/2.5 (-1) | 2,692 (-12%) | 1mo | $199,950 | $74 | 62 |
| 1410 Noble Glen Dr | 0.55mi | 4/2.5 (-1) | 2,912 (-4%) | 2mo | $320,000 | $110 | 55 |
| 1907 N Thunderwood Cir | 0.18mi | 4/2.5 (-1) | 2,594 (-15%) | 6mo | $289,900 | $112 | 51 |
| 4610 Nealwood Ct | 0.73mi | 4/2.5 (-1) | 2,966 (-3%) | 2mo | $319,900 | $108 | 49 |
| 1819 Oxford Green Ct | 0.28mi | 4/2.5 (-1) | 2,638 (-13%) | 10mo | $285,000 | $108 | 45 |
| 3906 Highland Vale Ct | 0.38mi | 4/2.5 (-1) | 2,692 (-12%) | 8mo | $298,000 | $111 | 45 |
| 3931 Oak Plank Rd | 0.59mi | 4/2.5 (-1) | 2,680 (-12%) | 2mo | $279,900 | $104 | 40 |
| 3947 Oak Plank Rd | 0.58mi | 4/2.5 (-1) | 2,600 (-15%) | 3mo | $289,990 | $112 | 35 |
Match score weights: distance 35% · size 25% · config 20% · recency 20%. Top-matched comps best support the ARV.
Projected returns pro-forma
-1.98% appreciation · 0.0% rent growth · sell at horizon
- IRR
- -5.2%
- Equity multiple
- 0.79×
- Total profit
- $-13,225
- Equity at exit
- $44,875
- IRR
- -1.2%
- Equity multiple
- 0.91×
- Total profit
- $-5,579
- Equity at exit
- $38,545
Cash invested: $64,400 (down + closing). Projections, not guarantees.
Landlord ↔ Tenant lean methodology
- Overall (STATE)
- 87 Strongly Landlord-Friendly
- State Texas
- 87 Strongly Landlord-Friendly · R+5
- County
- — inherits STATE
- City
- — inherits STATE
ZIP-level market 77545
- Home prices YoY
- -0.8%
- Rents YoY
- -0.9%
- Active inventory
- 178
- Price-to-rent
- 6.6×
Monthly cashflow live
- Estimated rent
- $2,887 medium interval (Pro) →
- Mortgage (P&I)
- −$1,206
- Tax from tax record
- −$592 /mo · $7,106/yr
- Insurance
- −$96
- HOA
- −$36
- Lot rent
- −$0
- Vacancy / Maint / Mgmt
- −$606
- Net cashflow
- $350
Break-even live
Sensitivity live
| Price | -10% $480 | -5% $415 | +0% $350 | +5% $285 | +10% $220 |
|---|---|---|---|---|---|
| Rent | -10% $122 | -5% $236 | +0% $350 | +5% $464 | +10% $578 |
| Rate | -1.0pp $466 | -0.5pp $409 | base $350 | +0.5pp $291 | +1.0pp $230 |
UW: 25.0% down · 7.5% · 30yr · 1.5% tax · 5.0% vac · 8.0% maint · 8.0% mgmt
Financing live
Cash to close
- Down payment
- $57,500
- Closing costs
- $6,900
- Reserves months
- —
- Total cash needed
- —
Loan-product check · same deal, 3 products live
Conventional
25% down · 7.5% · 30yr
- Down + closing
- —
- Monthly P&I
- —
- Monthly cashflow
- —
- DSCR
- —
- Eligible?
- —
Personal DTI + credit; lowest rate.
DSCR
20% down · 8.5% · 30yr
- Down + closing
- —
- Monthly P&I
- —
- Monthly cashflow
- —
- DSCR
- —
- Eligible?
- —
No personal income docs; deal must DSCR.
Hard money
10% down · 12.0% · 12mo
- Down + closing
- —
- Monthly P&I
- —
- Monthly cashflow
- —
- DSCR
- —
- Eligible?
- —
Short-term bridge; refi at stabilization.
Rent comps 4 comps
| Address | Beds | Baths | Sqft | Rent | $/sqft | DOM | Units | Dist |
|---|---|---|---|---|---|---|---|---|
| 3806 Teal Maple Ct Fresno, TX | 4.0 | 3.5 | 2318 | $2,146 | $0.93 | 5d | 1 | 0.55mi |
| 3526 Cambridge Falls Dr Fresno, TX | 4.0 | 3.0 | 3136 | $2,624 | $0.84 | 23d | 1 | 0.84mi |
| 2123 Witham Park Ln Fresno, TX | 4.0 | 4.0 | 3026 | $2,850 | $0.94 | 46d | 1 | 0.88mi |
| 2644 Blue Abbot Dr Fresno, TX | 4.0 | 2.5 | 2435 | $2,450 | $1.01 | 46d | 1 | 0.97mi |
HOA detail
- Monthly dues
- $36 · $432/yr
Listing history 36 events
-
2025-12-31status Pending
-
2025-12-19status Pending
-
2025-12-02$230,000 Active
-
2025-09-30historical
-
2025-09-17price $294,900
-
2025-08-14$299,900 Active
-
2025-06-30historical
-
2025-06-06$299,900 Active
-
2025-05-30historical
-
2025-03-01$299,900 Active
-
2024-11-05historical
-
2024-10-29price $285,000
-
2024-10-25price $290,000
-
2024-10-16price $300,000
-
2024-09-29price $310,000
-
2024-09-09$320,000 New
-
2020-02-07soldstatus
-
2020-02-03soldstatus Sold
-
2019-10-31status Pending
-
2019-10-17price $227,000
-
2019-10-03price $230,000
-
2019-09-20price $234,000
-
2019-08-30status Active
-
2019-08-18status Pending
-
2019-08-01price $239,000
-
2019-07-25status Active
-
2019-07-02status Pending
-
2019-06-04$243,000 Active
-
2019-05-30soldstatus
-
2013-03-05soldstatus
-
2013-02-28soldstatus Sold
-
2013-02-22status Pending
-
2013-01-28status Pending, Continue to Show
-
2013-01-21$149,900 Active
-
2009-12-15historical
-
2009-04-24$179,999
ⓘ Source: listings_history table (triggers on properties + properties_extension) + one-shot
backfill from property_details.listing_events for pre-trigger history.
Tax reassessment forecast TX · Resets to sale price
- Current annual tax
- $7,106 · $592/mo
- Projected year-2 tax
- $7,106 · $592/mo
- Expected delta
- $0/yr ($0/mo · 0.0%)
ⓘ Screening estimate from a state-policy table — verify with the county assessor before closing.
Climate risk First Street
- Flood 3/10 Moderate FEMA zone X (unshaded) · 20% chance over 30 yrs
- Wildfire 5/10 Major
- Heat 9/10 Extreme 7 d/yr ≥110°F today · 24 d/yr by 30 yrs out
- Wind 9/10 Extreme 99% chance of damaging wind over 30 yrs
- Air quality 2/10 Low 2 unhealthy d/yr today · 2 by 30 yrs out
Nearby sold comps map
Loading sold comps map…
Walkable amenities ~0.75 mi
Loading nearby amenities…
Taxation est. · year 1
- Rental income
- $34,638
- − Mortgage interest
- −$12,884
- − Property taxes
- −$7,106
- − Insurance
- −$1,150
- − Repairs & maintenance
- −$2,771
- − Management
- −$2,771
- − HOA
- −$432
- − Depreciation
- −$6,691
- Taxable income
- $834
- Est. tax owed @ 24.0%
- −$200
- After-tax cash flow
- $4,003/yr
For passive investors: Depreciation is non-cash, so a rental often shows a tax loss while cash-flowing — sheltering income. Rental losses are passive: they offset passive income freely, and up to $25,000/yr can offset ordinary (W-2) income if you actively participate and your MAGI is under $100k (phasing out to $0 by $150k); unused losses carry forward. On sale, claimed depreciation is recaptured at up to 25%, and gains may owe capital-gains tax (a 1031 exchange can defer both). Figures are a year-1 estimate at your 24.0% rate — not tax advice; consult a CPA.
Schools (NCES district)
- District
- Fort Bend ISD
- NCES district ID
- 4819650
- Math proficiency
- 44% ▼ -15.00%
- Reading proficiency
- 53% ▼ -4.00%
- Median HH income
- $82,360
- Composite
- 44.61/100
- National rank
- #2779
- State rank
- #140 of 826 in TX
Livability — Fresno
- Score
- 62/100
- State rank
- #943
- US rank
- #16815
Category grades
Schools grade is shown separately in the Schools card above.
Census & demographics
- Census place
- Fresno, TX
- County
- Fort Bend County · 836,777 people
- City population
- 26,236
- Metro
- Houston-The Woodlands-Sugar Land, TX
- Population (ZIP)
- 26,236
- Household income
- $94,474
- Rent vs Own
- Severe rent burden
- 360.0
Population outlook (Fort Bend County) Hauer SSP2
- Today (2025)
- 1,004,526 people
- By 2030
- 1,153,104 · +14.8%
- By 2040
- 1,453,718 · +44.7%
- By 2050
- 1,753,781 · +74.6%
- By 2075
- 2,455,772 · +144.5%
- By 2100
- 2,930,528 · +191.7%
Race, ethnicity, and origin ACS 2023
- Neighborhood character
- Diverse neighborhood (Simpson 0.61)
- Race & ethnicity
- Black 51% Hispanic / Latino 34% Two or more races 12% White 8% Asian 2%
- Hispanic origin (detail)
- Mexican 29%
- Common ancestry
- Portuguese 1%
- Foreign-born
- 18% · Canada
- Languages at home
- 67% English-only · Spanish 29% Other Asian/Pacific 1% Other Indo-European 1%
Political lean MEDSL · Fort Bend
- 2024 margin
- Toss-up / Even · D 49.5% · R 47.9% · Other 2.6%
- 2008→2024 swing
- +4.0pp toward D · 2008: -2.4pp · 2024: 1.6pp
- All cycles
- 2024: D+1.6 2020: D+10.6 2016: D+6.6 2012: R+6.8 2008: R+2.4
Not yet ingested
- Civics
- —
Market trends
- HPI YoY
- ▼ -1.98%
- Current HPI
- 231.3921
- Rent YoY
- ▼ -0.95%
- Metro
- Houston-The Woodlands-Sugar Land, TX
- State GDP YoY
- ▲ 3.95%
- F500 in state
- 110
Industry mix (Fortune 500 HQ in TX)
| Industry | F500 HQs | Revenue |
|---|---|---|
| Energy | 16 | $1,198B |
|
||
| Technology | 5 | $198B |
|
||
| Engineering / Construction | 4 | $72B |
|
||
| Energy Services | 3 | $60B |
|
||
| Utilities | 3 | $41B |
|
||
| Healthcare | 2 | $330B |
|
||
Price history
+27.8% since first listed36 events — show timeline
- 2025-12-31 Pending — HARMLS
- 2025-12-19 Pending — HARMLS
- 2025-12-02 Listed $230,000 HARMLS
- 2025-09-30 Listing Removed — HARMLS
- 2025-09-17 Price Changed $294,900 HARMLS
- 2025-08-14 Listed $299,900 HARMLS
- 2025-06-30 Listing Removed — HARMLS
- 2025-06-06 Listed $299,900 HARMLS
- 2025-05-30 Listing Removed — HARMLS
- 2025-03-01 Listed $299,900 HARMLS
- 2024-11-05 Listing Removed — LERA
- 2024-10-29 Price Changed $285,000 LERA
- 2024-10-25 Price Changed $290,000 LERA
- 2024-10-16 Price Changed $300,000 LERA
- 2024-09-29 Price Changed $310,000 LERA
- 2024-09-09 Listed $320,000 LERA
- 2020-02-07 Sold (Public Records) — Public Records
- 2020-02-03 Sold (MLS) — HARMLS
- 2019-10-31 Pending — HARMLS
- 2019-10-17 Price Changed $227,000 HARMLS
- 2019-10-03 Price Changed $230,000 HARMLS
- 2019-09-20 Price Changed $234,000 HARMLS
- 2019-08-30 Relisted — HARMLS
- 2019-08-18 Pending — HARMLS
- 2019-08-01 Price Changed $239,000 HARMLS
- 2019-07-25 Relisted — HARMLS
- 2019-07-02 Pending — HARMLS
- 2019-06-04 Listed $243,000 HARMLS
- 2019-05-30 Sold (Public Records) — Public Records
- 2013-03-05 Sold (Public Records) — Public Records
- 2013-02-28 Sold (MLS) — HARMLS
- 2013-02-22 Pending — HARMLS
- 2013-01-28 Pending — HARMLS
- 2013-01-21 Listed $149,900 HARMLS
- 2009-12-15 Listing Removed — HARMLS
- 2009-04-24 Listed $179,999 HARMLS
Property tax history
+3.3%/yrLatest (2025): $7,106 · +11.4% YoY. Source: county tax records.
Cash-flow waterfall
monthlySold comps — $/sqft
last 12 mo · ≤1 miLoading sold comps…