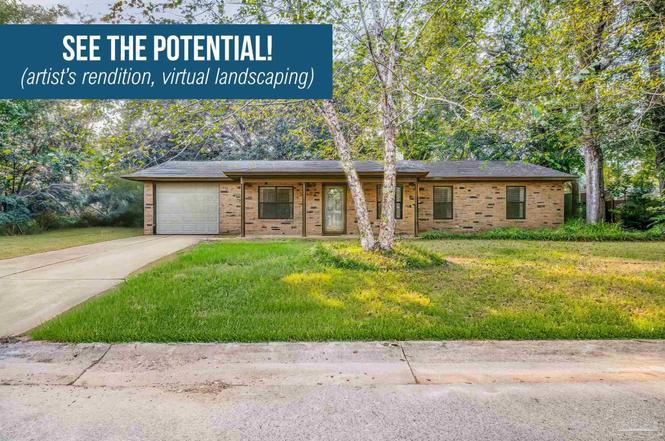
4699 Easter St · Pea Ridge, FL
Flood risk 1/10 · Minimal
- FEMA flood zone
- X (unshaded)
- Chance of flooding over 30 yrs
- 0.0%
- Est. flood insurance / yr
- $507 – $1,088
Fire risk 4/10 · Minor
- Est. fire insurance / yr
- $947 – $1,759
Heat risk 9/10 · Severe
- Hot days now (above 105°F)
- 7 days/yr
- Hot days in 30 yrs
- 20 days/yr
Wind risk 9/10 · Severe
- Chance of severe wind over 30 yrs
- 99.0%
Air-quality risk 1/10 · Minimal
- Unhealthy air days now
- 0 days/yr
- Unhealthy air days in 30 yrs
- 0 days/yr
Risk factors via First Street. Map © Google.
Why this score? — see what drove the C grade
The composite is a weighted blend of 9 inputs, each scored 0–100. Each bar is that input's sub-score; the figure is the points it added to the 100-point composite (weight × sub-score).
- Cash flow +18.1/30.0
- ARV discount +15.0/15.0
- DSCR +5.7/10.0
- Schools +5.3/10.0
- 1% rule +4.1/10.0
- Livability +3.5/5.0
- Rent growth +3.2/5.0
- Condition / age +2.5/5.0
- Appreciation +0.0/10.0
$225,000
🖨 Deal sheet 📄 Offer letter ✓ Due diligence
Listing remarks MLS
Best priced home in Pace! This home is the church's old parsonage and it is rock bottom priced! Garage door will be replaced and home pressure washed next week. Huge bedrooms, wonderful brick fireplace, big eat-in kitchen and inside laundry room!
Key facts
- Granite fireplace
- Stainless appliances
- Florida room
Tags
Property features AI
Finance
- HOA & community: No association
Exterior
- Parking: Attached 1-car garage; 1 covered parking space (total 1 parking space)
- Utilities: Public water; Copper electrical wiring
- Home design: One-story brick home; Resale property; Not attached to other properties; Homestead eligible
- Construction: Composition roof; Slab foundation; Brick construction; One level
- Exterior features: Paved, county-maintained road access; Central access lot feature
Interior
- Kitchen: Red oak cabinets; Updated within last 11–14 years; Electric water heater
- Bedrooms: Primary bedroom on the first floor; Additional bedrooms on the first floor
- Flooring: Vinyl flooring; Carpet
- Bathrooms: 2 full bathrooms
- Heating & cooling: Central heating; Central air; Ceiling fans
- Interior features: Living/dining combo; Updated kitchen
- Laundry & utility: Electric water heater
Neighborhood map
What this means for you Summary
Snapshot
- This is a 3-bed/2.0-bath single-family listed at $225k.
Deal economics
- At list price, monthly cash flow is $199 ($2k/yr) — positive.
- The deal already cash-flows at list — no discount required.
- To meet the 1% rule (rent ≥ 1% of price), the offer needs to be $205k (9.1% below list).
- Recommended offer: $205k (9.1% below list) — sets the bar for 1% rule.
- Cap rate 7.4% vs local median 4.5% in Pea Ridge — top-decile yield for the area; either an underpriced asset or a hidden risk that comps aren't pricing in. Stress-test before assuming the spread holds.
Location & tenants
- Location reads 69/100 on livability (#459 in FL) — a middle-class / working-renter tenant base. Strengths: cost of living A+, housing A+, crime A-; Watch: schools D-, amenities F, commute F.
- Santa Rosa (suburban): math 63% / reading 60% proficiency, ranked #8 of 73 in FL (top 11%) — acceptable for families but not a draw, mixed tenant base, ~2y average lease.
- Market conditions: Rents rising (+2.7%/yr); 665 active listings in the ZIP; 3 comparable units currently listed for rent nearby; rentals at typical pace (median 14d on market — plan ~3-4 weeks tenant-placement turnaround); solid renter incomes; 1,983 units permitted in Santa Rosa County in 2024 (128 in 5+ unit buildings).
Forward outlook
- Local home prices are declining (-3.0%/yr); year-one equity from $2k of loan paydown is wiped out by about $7k of value loss. Plan a longer hold.
- Santa Rosa County population projected at +31% by 2050 — long-run rental-demand tailwind backs the buy-and-hold thesis.
Negotiation context
- It's been on market 87 days — a 6% lower offer ($212k) is reasonable based on typical stale-listing flexibility.
- 4 sale attempts since 23y ago; this cycle's ask has dropped $15k (6%) from the opening price — seller is motivated, your offer sets the floor, not the list.
- Current owner paid $88k; list at $225k implies a 156% gain — meaningful room to come down on a strong offer.
Risks & watch-outs
- Climate carrying-cost: severe wind risk, 99% chance of damaging wind over 30y; extreme-heat days projected 7→20/yr by 2055 (HVAC capex compounding) — expect insurance premiums to compound above CPI over the hold.
Questions for the listing agent
- It's been on market 87 days. Have you received any prior offers? Is the seller open to a 9% concession, seller financing, or rate buy-down credit?
- Why hasn't it sold? Are there any deal-killer items the seller is aware of (foundation, flood, title, zoning, code violations)?
- Is there a deadline driving the sale (1031 exchange, divorce, estate, relocation)? That informs how much negotiation room exists.
- Schools are D-rated, which usually means shorter tenancies and higher turnover. Who's the typical renter profile here, and what's been the actual vacancy rate?
- What's the average days-on-market for RENTAL listings here right now (not sales)? A rising rental-DOM trend means longer vacancies and softer asking-rent achievability than the comps imply.
- What's the recent tenant-quality profile in this submarket — average credit score on applications, eviction rate, late-payment / NSF rate, and stable-employment percentage? A property-management company in the area should have these aggregated.
- How much new for-sale + rental construction is in the pipeline within 1–3 miles? Heavy new supply typically softens prices + rents 12–24 months out; constrained supply supports both.
Investment metrics
- 1% rule
- 0.91% ✗
- Cap rate
- 7.35%
- Cash-on-cash
- 3.78%
- DSCR
- 1.17
- GRM
- 9.2
CMA / ARV
- ARV (on-the-fly)
- $331,760
- Comps found
- 12
Show comp detail 12 sales within ~0.75 mi
| Address | Dist | Beds/Ba | Sqft | Sold | Price | $/sf | Match |
|---|---|---|---|---|---|---|---|
| 5143 Esterbrooke Blvd Unit 11-G (LOT ) | 0.40mi | 3/2.0 | 1,569 (-2%) | 0mo | $328,012 | $209 | 78 |
| 4854 Turtledove St Unit 21-E (LOT ) | 0.42mi | 3/2.0 | 1,569 (-2%) | 0mo | $327,750 | $209 | 78 |
| 4874 Turtledove St Unit 26-E (LOT ) | 0.45mi | 3/2.0 | 1,569 (-2%) | 0mo | $327,127 | $208 | 76 |
| 4889 Bonneville St Unit 2-E (LOT ) | 0.47mi | 3/2.0 | 1,569 (-2%) | 5mo | $326,805 | $208 | 71 |
| 4877 Bonneville St Unit 5-E (LOT ) | 0.47mi | 3/2.0 | 1,569 (-2%) | 6mo | $326,060 | $208 | 70 |
| 5224 Esterbrooke Blvd Unit 2-L (LOT ) | 0.53mi | 3/2.0 | 1,569 (-2%) | 4mo | $327,242 | $209 | 69 |
| 4870 Turtledove St Unit 25-E (LOT ) | 0.44mi | 3/2.0 | 1,710 (+7%) | 1mo | $340,522 | $199 | 66 |
| 5220 Esterbrooke Blvd Unit 3-L (LOT ) | 0.52mi | 3/2.0 | 1,710 (+7%) | 2mo | $339,341 | $198 | 62 |
| 4760 La Casa Cir | 0.28mi | 4/2.0 (+1) | 1,815 (+14%) | 0mo | $300,000 | $165 | 59 |
| 5337 Adeline Cir | 0.50mi | 3/2.0 | 1,820 (+14%) | 1mo | $380,000 | $209 | 53 |
| 5247 Catalina St | 0.63mi | 3/2.0 | 1,430 (-10%) | 3mo | $251,000 | $176 | 51 |
| 4460 Santa Villa Dr | 0.71mi | 3/1.5 | 1,400 (-12%) | 4mo | $215,000 | $154 | 42 |
Match score weights: distance 35% · size 25% · config 20% · recency 20%. Top-matched comps best support the ARV.
Projected returns pro-forma
-3.0% appreciation · 2.72% rent growth · sell at horizon
- IRR
- -10.7%
- Equity multiple
- 0.61×
- Total profit
- $-24,433
- Equity at exit
- $33,548
- IRR
- -1.8%
- Equity multiple
- 0.88×
- Total profit
- $-7,544
- Equity at exit
- $19,454
Cash invested: $63,000 (down + closing). Projections, not guarantees.
Landlord ↔ Tenant lean methodology
- Overall (STATE)
- 87 Strongly Landlord-Friendly
- State Florida
- 87 Strongly Landlord-Friendly · R+3
- County
- — inherits STATE
- City
- — inherits STATE
ZIP-level market 32571
- Home prices YoY
- -17.7%
- Rents YoY
- 2.7%
- Active inventory
- 665
- Price-to-rent
- 9.2×
Monthly cashflow live
- Estimated rent
- $2,045 medium interval (Pro) →
- Mortgage (P&I)
- −$1,180
- Tax from tax record
- −$143 /mo · $1,718/yr
- Insurance
- −$94
- HOA
- −$0
- Vacancy / Maint / Mgmt
- −$429
- Net cashflow
- $199
Break-even live
UW: 25.0% down · 7.5% · 30yr · 1.5% tax · 5.0% vac · 8.0% maint · 8.0% mgmt
Financing live
Cash to close
- Down payment
- $56,250
- Closing costs
- $6,750
- Reserves months
- —
- Total cash needed
- —
Loan-product check · same deal, 3 products live
Conventional
25% down · 7.5% · 30yr
- Down + closing
- —
- Monthly P&I
- —
- Monthly cashflow
- —
- DSCR
- —
- Eligible?
- —
Personal DTI + credit; lowest rate.
DSCR
20% down · 8.5% · 30yr
- Down + closing
- —
- Monthly P&I
- —
- Monthly cashflow
- —
- DSCR
- —
- Eligible?
- —
No personal income docs; deal must DSCR.
Hard money
10% down · 12.0% · 12mo
- Down + closing
- —
- Monthly P&I
- —
- Monthly cashflow
- —
- DSCR
- —
- Eligible?
- —
Short-term bridge; refi at stabilization.
Rent comps 3 comps
| Address | Beds | Baths | Sqft | Rent | $/sqft | DOM | Units | Dist |
|---|---|---|---|---|---|---|---|---|
| 4624 Malay Cir Milton, FL | 4.0 | 2.0 | 1787 | $2,085 | $1.17 | 14d | 1 | 0.43mi |
| 4933 Bell Ridge Ln Milton, FL | 1.0–3.0 | 1.0–2.0 | 865 | $1,437 | $1.66 | 14d | 8 | 0.67mi |
| 4496 Fiske St Milton, FL | 3.0 | 2.0 | 1418 | $1,850 | $1.30 | 14d | 1 | 0.99mi |
Listing history 16 events
-
2026-06-18days on market $225,000 Active 87 DOM
-
2026-06-17price $225,000 Active 86 DOM
-
2026-06-17days on market $230,000 Active 86 DOM
-
2026-06-16days on market $230,000 Active 85 DOM
-
2026-06-15days on market $230,000 Active 84 DOM
-
2026-06-14days on market $230,000 Active 82 DOM
-
2026-06-10days on market $230,000 Active 79 DOM
-
2026-06-09days on market $230,000 Active 78 DOM
-
2026-06-08days on market $230,000 Active 77 DOM
-
2026-06-07days on market $230,000 Active 76 DOM
-
2026-06-05days on market $230,000 Active 73 DOM
-
2026-06-03days on market $230,000 Active 72 DOM
-
2026-06-02days on market $230,000 Active 71 DOM
-
2026-06-01days on market $230,000 Active 70 DOM
-
2026-05-31days on market $230,000 Active 69 DOM
-
2026-05-31days on market $230,000 Active 68 DOM
ⓘ Source: listings_history table (triggers on properties + properties_extension) + one-shot
backfill from property_details.listing_events for pre-trigger history.
Tax reassessment forecast FL · Resets to sale price
- Current annual tax
- $1,718 · $143/mo
- Projected year-2 tax
- $1,868 · $156/mo
- Expected delta
- +$149/yr (+$12/mo · 8.7%)
ⓘ Screening estimate from a state-policy table — verify with the county assessor before closing.
Climate risk First Street
- Flood 1/10 Low FEMA zone X (unshaded) · 0% chance over 30 yrs
- Wildfire 4/10 Moderate
- Heat 9/10 Extreme 7 d/yr ≥105°F today · 20 d/yr by 30 yrs out
- Wind 9/10 Extreme 99% chance of damaging wind over 30 yrs
- Air quality 1/10 Low 0 unhealthy d/yr today · 0 by 30 yrs out
Nearby sold comps map
Loading sold comps map…
Walkable amenities ~0.75 mi
Loading nearby amenities…
Taxation est. · year 1
- Rental income
- $24,540
- − Mortgage interest
- −$12,603
- − Property taxes
- −$1,718
- − Insurance
- −$1,125
- − Repairs & maintenance
- −$1,963
- − Management
- −$1,963
- − Depreciation
- −$6,545
- Taxable loss
- −$1,379
- Est. tax savings @ 24.0%
- +$331
- After-tax cash flow
- $2,715/yr
For passive investors: Depreciation is non-cash, so a rental often shows a tax loss while cash-flowing — sheltering income. Rental losses are passive: they offset passive income freely, and up to $25,000/yr can offset ordinary (W-2) income if you actively participate and your MAGI is under $100k (phasing out to $0 by $150k); unused losses carry forward. On sale, claimed depreciation is recaptured at up to 25%, and gains may owe capital-gains tax (a 1031 exchange can defer both). Figures are a year-1 estimate at your 24.0% rate — not tax advice; consult a CPA.
Schools (NCES district)
- District
- Santa Rosa
- NCES district ID
- 1201650
- Math proficiency
- 63% ▼ -6.00%
- Reading proficiency
- 60% ▼ -5.00%
- Median HH income
- $58,161
- Composite
- 53.12/100
- National rank
- #1511
- State rank
- #8 of 73 in FL
Livability — Pea Ridge
- Score
- 69/100
- State rank
- #459
- US rank
- #8316
Category grades
Schools grade is shown separately in the Schools card above.
Census & demographics
- Census place
- Pea Ridge, FL
- County
- Santa Rosa County · 194,764 people
- Metro
- Pensacola-Ferry Pass-Brent, FL
- Population (ZIP)
- 42,171
- Household income
- $87,617
- Rent vs Own
- Severe rent burden
- 301.0
Population outlook (Santa Rosa County) Hauer SSP2
- Today (2025)
- 195,978 people
- By 2030
- 209,782 · +7.0%
- By 2040
- 235,293 · +20.1%
- By 2050
- 256,408 · +30.8%
- By 2075
- 298,074 · +52.1%
- By 2100
- 303,216 · +54.7%
Race, ethnicity, and origin ACS 2023
- Neighborhood character
- Predominantly White (80%)
- Race & ethnicity
- White 80% Two or more races 9% Hispanic / Latino 6% Black 4% Asian 2%
- Hispanic origin (detail)
- Mexican 3%
- Common ancestry
- Lithuanian 4% Italian 3% Slovak 2%
- Foreign-born
- 6% · Canada, South Korea
- Languages at home
- 93% English-only · Spanish 2% Other Indo-European 1% Russian/Polish/Slavic 1%
Political lean MEDSL · Santa Rosa
- 2024 margin
- Solid R (+51.0) · D 24.1% · R 75.0%
- 2008→2024 swing
- -3.0pp toward R · 2008: -47.9pp · 2024: -51.0pp
- All cycles
- 2024: R+51.0 2020: R+46.5 2016: R+53.5 2012: R+52.6 2008: R+47.9
Not yet ingested
- Civics
- —
Market trends
- HPI YoY
- ▼ -62.39%
- Current HPI
- 290.2953
- Rent YoY
- ▲ 2.72%
- Metro
- Pensacola-Ferry Pass-Brent, FL
- State GDP YoY
- ▲ 3.28%
- F500 in state
- 36
Industry mix (Fortune 500 HQ in FL)
| Industry | F500 HQs | Revenue |
|---|---|---|
| Industrial Technology | 2 | $29B |
|
||
| Insurance | 2 | $17B |
|
||
| Retail | 1 | $60B |
|
||
| Technology Distribution | 1 | $58B |
|
||
| Homebuilding | 1 | $35B |
|
||
| Technology Manufacturing | 1 | $35B |
|
||
Price history
+318.2% since first listed10 events — show timeline
- 2026-05-27 Relisted — PARMLS
- 2026-01-25 Listing Removed — PARMLS
- 2026-01-16 Relisted — PARMLS
- 2025-12-27 Listing Removed — PARMLS
- 2025-11-14 Price Changed $230,000 PARMLS
- 2025-10-30 Listed $240,000 PARMLS
- 2003-05-14 Sold (Public Records) $87,900 Public Records
- 2003-05-07 Sold (MLS) $87,900 PARMLS
- 2003-03-10 Listed $89,900 PARMLS
- 1987-09-01 Sold (Public Records) $55,000 Public Records
Property tax history
+8.8%/yrLatest (2025): $1,718 · +55.6% YoY. Source: county tax records.
Cash-flow waterfall
monthlySold comps — $/sqft
last 12 mo · ≤1 miLoading sold comps…