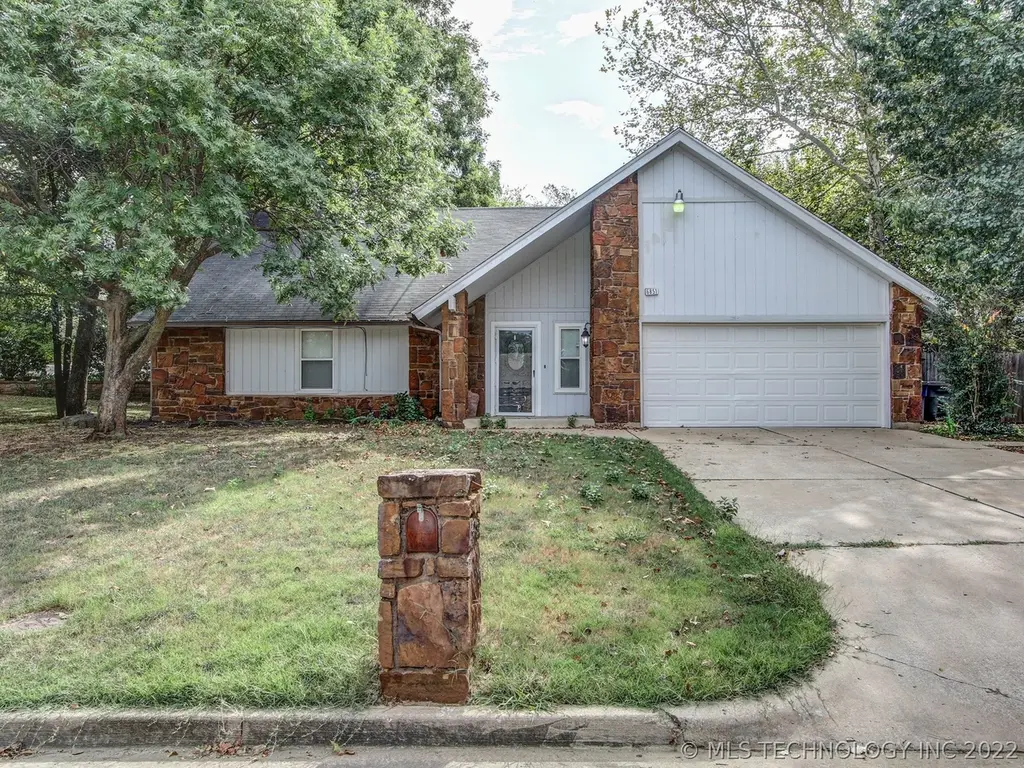
6851 S 32nd WestAvenue · Tulsa, OK
Flood risk 1/10 · Minimal
- FEMA flood zone
- X (unshaded)
- Chance of flooding over 30 yrs
- 0.0%
- Est. flood insurance / yr
- $473 – $860
Fire risk 3/10 · Minor
- Est. fire insurance / yr
- $2,463 – $4,575
Heat risk 6/10 · Moderate
- Hot days now (above 112°F)
- 7 days/yr
- Hot days in 30 yrs
- 18 days/yr
Wind risk 3/10 · Minor
- Chance of severe wind over 30 yrs
- 6.0%
Air-quality risk 3/10 · Minor
- Unhealthy air days now
- 2 days/yr
- Unhealthy air days in 30 yrs
- 3 days/yr
Risk factors via First Street. Map © Google.
Why this score? — see what drove the D+ grade
The composite is a weighted blend of 9 inputs, each scored 0–100. Each bar is that input's sub-score; the figure is the points it added to the 100-point composite (weight × sub-score).
- ARV discount +15.0/15.0
- Cash flow +13.6/30.0
- 1% rule +4.1/10.0
- DSCR +4.1/10.0
- Livability +3.8/5.0
- Schools +3.2/10.0
- Rent growth +2.5/5.0
- Condition / age +2.5/5.0
- Appreciation +0.0/10.0
$265,000
🖨 Deal sheet (PDF) 📄 Offer letter ✓ Due diligence
Listing remarks
PRICED TO SELL in Jenks Schools! This generous 4-bedroom, 3-bath home offers exceptional space and flexibility on a desirable corner lot. The main level includes a large living room anchored by a stone fireplace, a kitchen with a breakfast nook, a formal dining room, a full guest bath, a guest bedroom, and a private primary suite with a private bath and a walk-in closet. Upstairs, two additional bedrooms, a full bath, and a spacious bonus room provide ideal options for a game room, media room, or additional living space. Minutes from Tulsa Hills, Page Belcher Golf Course, and The Oaks Country Club, this location puts recreation, shopping, and dining right at your fingertips.
Key facts
- Breakfast nook
- Formal dining room
- Walk-in closet
Tags
Property features AI
Finance
- HOA & community: Gutters and sidewalks in the community
Exterior
- Parking: Attached garage with workshop area; 2 garage spaces
- Security: Owned security system; No safety shelter
- Utilities: Public water; Public sewer; Electricity available; Natural gas available; Cable available
- Home design: Two-story home; Faces west; Slab foundation
- Construction: Built per public records; Stone and wood siding on wood frame; Asphalt/fiberglass roof
- Exterior features: Covered patio; Concrete driveway; Rain gutters; Partial fencing; Mature trees; Corner lot
Interior
- Kitchen: Built-in oven; Cooktop; Range/oven; Microwave; Dishwasher; Disposal; Pantry; Plumbed for ice maker
- Bedrooms: Master bedroom with private bath and walk-in closet (First floor); Second master/primary bedroom with private bath (First floor); Bedroom with walk-in closet (Second floor); Additional bedrooms (First and Second floors)
- Flooring: Carpet; Tile
- Bathrooms: Master bath with shower (First floor); Full hall bath with bathtub (First floor); Three full bathrooms total
- Heating & cooling: Central heating (Electric and Gas); Central air conditioning
- Interior features: Ceiling fans; Cable TV available; Laminate countertops; Programmable thermostat; Insulated windows with aluminum and vinyl frames
- Laundry & utility: Inside utility room (separate); Washer hookup; Electric dryer hookup; Gas dryer hookup; Gas water heater
Neighborhood map
What this means for you Summary
Snapshot
- This is a 4-bed/3.0-bath single-family listed at $265k.
Deal economics
- At list price, monthly cash flow is $14 ($165/yr) — positive.
- The deal already cash-flows at list — no discount required.
- To meet the 1% rule (rent ≥ 1% of price), the offer needs to be $240k (9.4% below list).
- Recommended offer: $240k (9.4% below list) — sets the bar for 1% rule.
- Cap rate 6.4% vs local median 3.9% in Tulsa — top-decile yield for the area; either an underpriced asset or a hidden risk that comps aren't pricing in. Stress-test before assuming the spread holds.
Location & tenants
- Location reads 75/100 on livability (#13 in OK, #4,058 nationally) — a middle-class / working-renter tenant base. Strengths: amenities A+, commute A+, cost of living A+; Watch: schools F, crime F, employment D-.
- Jenks (suburban): math 34% / reading 35% proficiency, ranked #27 of 270 in OK (top 10%) — families likely to look elsewhere, expect single-tenant / working-renter base with shorter leases.
- Market conditions: 96 active listings in the ZIP; 1 comparable units currently listed for rent nearby; 2,818 units permitted in Tulsa County in 2024 (518 in 5+ unit buildings).
Forward outlook
- Local home prices are declining (-3.0%/yr); year-one equity from $2k of loan paydown is wiped out by about $8k of value loss. Plan a longer hold.
- Tulsa County population projected at +30% by 2050 — long-run rental-demand tailwind backs the buy-and-hold thesis.
Negotiation context
- Only 13 days on market — expect competitive offers; lowballing is unlikely to land.
- 10 sale attempts since 23y ago with the ask held roughly flat each time — persistent listings suggest the price (not the market) is what's stuck; bring a comps-based counter.
Risks & watch-outs
- Climate carrying-cost: extreme-heat days projected 7→18/yr by 2055 (HVAC capex compounding) — expect insurance premiums to compound above CPI over the hold.
Questions for the listing agent
- Is there a deadline driving the sale (1031 exchange, divorce, estate, relocation)? That informs how much negotiation room exists.
- Schools are F-rated, which usually means shorter tenancies and higher turnover. Who's the typical renter profile here, and what's been the actual vacancy rate?
- Crime grade is F in this area — have there been break-ins, vandalism, or insurance claims at this property in the last 3 years? What carrier currently insures it and at what premium?
- The area grade is low — what's the realistic commute time and amenity access for the typical tenant pool here? Any planned neighborhood developments (good or bad) we should know about?
- What's the average days-on-market for RENTAL listings here right now (not sales)? A rising rental-DOM trend means longer vacancies and softer asking-rent achievability than the comps imply.
- What's the recent tenant-quality profile in this submarket — average credit score on applications, eviction rate, late-payment / NSF rate, and stable-employment percentage? A property-management company in the area should have these aggregated.
- How much new for-sale + rental construction is in the pipeline within 1–3 miles? Heavy new supply typically softens prices + rents 12–24 months out; constrained supply supports both.
Investment metrics
- 1% rule
- 0.91% ✗
- Cap rate
- 6.36%
- Cash-on-cash
- 0.22%
- DSCR
- 1.01
- GRM
- 9.2
CMA / ARV
- ARV (on-the-fly)
- $350,280
- Comps found
- 11
Show comp detail 11 sales within ~0.75 mi
| Address | Dist | Beds/Ba | Sqft | Sold | Price | $/sf | Match |
|---|---|---|---|---|---|---|---|
| 2629 W 68th Pl S | 0.32mi | 4/2.0 | 2,458 (-2%) | 0mo | $350,000 | $142 | 78 |
| 2729 W 68th Pl S | 0.25mi | 4/2.5 | 2,565 (+2%) | 14mo | $338,000 | $132 | 71 |
| 6924 S 32nd WestAvenue | 0.09mi | 4/2.5 | 2,602 (+4%) | 20mo | $325,000 | $125 | 70 |
| 2527 W 68th Pl S | 0.44mi | 3/2.5 (-1) | 2,433 (-3%) | 1mo | $349,000 | $143 | 67 |
| 3321 Aspen Ridge Rd | 0.29mi | 4/4.0 | 2,751 (+10%) | 2mo | $680,000 | $247 | 64 |
| 3039 W 69th Pl | 0.08mi | 4/3.0 | 2,132 (-15%) | 10mo | $315,000 | $148 | 64 |
| 2728 W 66th Pl | 0.41mi | 5/2.5 (+1) | 2,682 (+7%) | 1mo | $375,000 | $140 | 61 |
| 2917 W 65th St | 0.42mi | 4/3.0 | 2,215 (-12%) | 4mo | $285,000 | $129 | 58 |
| 3232 W 72nd St | 0.34mi | 4/2.5 | 2,261 (-10%) | 14mo | $430,000 | $190 | 54 |
| 2631 W 68th St | 0.31mi | 4/2.5 | 2,768 (+11%) | 18mo | $315,000 | $114 | 50 |
| 2736 W 67th St | 0.34mi | 3/2.0 (-1) | 2,227 (-11%) | 12mo | $300,000 | $135 | 47 |
Match score weights: distance 35% · size 25% · config 20% · recency 20%. Top-matched comps best support the ARV.
Projected returns pro-forma
-3.0% appreciation · 3.0% rent growth · sell at horizon
- IRR
- -15.9%
- Equity multiple
- 0.43×
- Total profit
- $-42,000
- Equity at exit
- $39,512
- IRR
- -7.5%
- Equity multiple
- 0.53×
- Total profit
- $-35,172
- Equity at exit
- $22,912
Cash invested: $74,200 (down + closing). Projections, not guarantees.
Landlord ↔ Tenant lean methodology
- Overall (STATE)
- 83 Strongly Landlord-Friendly
- State Oklahoma
- 83 Strongly Landlord-Friendly · R+20
- County
- — inherits STATE
- City
- — inherits STATE
ZIP-level market 74132
- Home prices YoY
- -34.7%
- Active inventory
- 96
- Price-to-rent
- 9.2×
Monthly cashflow live
- Estimated rent
- $2,400 medium interval (Pro) →
- Mortgage (P&I)
- −$1,390
- Tax from tax record
- −$382 /mo · $4,586/yr
- Insurance
- −$110
- HOA
- −$0
- Vacancy / Maint / Mgmt
- −$504
- Net cashflow
- $14
Break-even live
Sensitivity live
| Price | -10% $164 | -5% $89 | +0% $14 | +5% $-61 | +10% $-136 |
|---|---|---|---|---|---|
| Rent | -10% $-176 | -5% $-81 | +0% $14 | +5% $109 | +10% $203 |
| Rate | -1.0pp $147 | -0.5pp $81 | base $14 | +0.5pp $-55 | +1.0pp $-125 |
UW: 25.0% down · 7.5% · 30yr · 1.5% tax · 5.0% vac · 8.0% maint · 8.0% mgmt
Financing live
Cash to close
- Down payment
- $66,250
- Closing costs
- $7,950
- Reserves months
- —
- Total cash needed
- —
Loan-product check · same deal, 3 products live
Conventional
25% down · 7.5% · 30yr
- Down + closing
- —
- Monthly P&I
- —
- Monthly cashflow
- —
- DSCR
- —
- Eligible?
- —
Personal DTI + credit; lowest rate.
DSCR
20% down · 8.5% · 30yr
- Down + closing
- —
- Monthly P&I
- —
- Monthly cashflow
- —
- DSCR
- —
- Eligible?
- —
No personal income docs; deal must DSCR.
Hard money
10% down · 12.0% · 12mo
- Down + closing
- —
- Monthly P&I
- —
- Monthly cashflow
- —
- DSCR
- —
- Eligible?
- —
Short-term bridge; refi at stabilization.
Rent comps 1 comps
| Address | Beds | Baths | Sqft | Rent | $/sqft | DOM | Units | Dist |
|---|---|---|---|---|---|---|---|---|
| 2542 W 66th Pl Tulsa, OK | 4.0 | 2.0 | 2200 | $2,400 | $1.09 | 24d | 1 | 0.49mi |
Listing history 36 events
-
2026-06-05statusdays on market $265,000 Pending 13 DOM
-
2026-06-03days on market $265,000 Active 12 DOM
-
2026-06-02days on market $265,000 Active 11 DOM
-
2026-06-01days on market $265,000 Active 10 DOM
-
2026-05-31days on market $265,000 Active 9 DOM
-
2026-05-22$265,000 Active
-
2025-07-31historical
-
2025-07-28status Active
-
2025-07-28historical
-
2025-07-09status Active
-
2025-07-07status Pending
-
2025-05-01$280,000 Active
-
2024-11-19historical
-
2024-10-24price $280,000
-
2024-09-26$290,000 Active
-
2024-09-26historical $2,600
-
2024-09-17$2,600
-
2024-01-20historical
-
2023-11-27price $285,000
-
2023-10-25$290,000 Active
-
2022-02-09soldstatus $235,000
-
2022-01-31soldstatus $235,000 Closed
-
2021-12-27status Pending
-
2021-11-09price $239,999
-
2021-10-25status Active
-
2021-10-01status Pending
-
2021-10-01historical
-
2021-09-17price $240,000
-
2021-09-17$230,000 Active
-
2018-09-28soldstatus $125,000
-
2004-07-28soldstatus $139,000
-
2004-02-24soldstatus $90,000
-
2004-02-23soldstatus $90,000
-
2004-02-04historical
-
2003-12-04$104,900
-
1993-05-05soldstatus $90,000
ⓘ Source: listings_history table (triggers on properties + properties_extension) + one-shot
backfill from property_details.listing_events for pre-trigger history.
Tax reassessment forecast OK · Resets to sale price
- Current annual tax
- $4,586 · $382/mo
- Projected year-2 tax
- $4,586 · $382/mo
- Expected delta
- $0/yr ($0/mo · 0.0%)
ⓘ Screening estimate from a state-policy table — verify with the county assessor before closing.
Climate risk First Street
- Flood 1/10 Low FEMA zone X (unshaded) · 0% chance over 30 yrs
- Wildfire 3/10 Moderate
- Heat 6/10 Major 7 d/yr ≥112°F today · 18 d/yr by 30 yrs out
- Wind 3/10 Moderate 6% chance of damaging wind over 30 yrs
- Air quality 3/10 Moderate 2 unhealthy d/yr today · 3 by 30 yrs out
Nearby sold comps map
Loading sold comps map…
Walkable amenities ~0.75 mi
Loading nearby amenities…
Taxation est. · year 1
- Rental income
- $28,800
- − Mortgage interest
- −$14,844
- − Property taxes
- −$4,586
- − Insurance
- −$1,325
- − Repairs & maintenance
- −$2,304
- − Management
- −$2,304
- − Depreciation
- −$7,709
- Taxable loss
- −$4,272
- Est. tax savings @ 24.0%
- +$1,025
- After-tax cash flow
- $1,190/yr
For passive investors: Depreciation is non-cash, so a rental often shows a tax loss while cash-flowing — sheltering income. Rental losses are passive: they offset passive income freely, and up to $25,000/yr can offset ordinary (W-2) income if you actively participate and your MAGI is under $100k (phasing out to $0 by $150k); unused losses carry forward. On sale, claimed depreciation is recaptured at up to 25%, and gains may owe capital-gains tax (a 1031 exchange can defer both). Figures are a year-1 estimate at your 24.0% rate — not tax advice; consult a CPA.
Schools (NCES district)
- District
- Jenks
- NCES district ID
- 4015720
- Math proficiency
- 34% ▼ -9.00%
- Reading proficiency
- 35% ▼ -8.00%
- Median HH income
- $66,291
- Composite
- 31.5/100
- National rank
- #5973
- State rank
- #27 of 270 in OK
Livability — Tulsa
- Score
- 75/100
- State rank
- #13
- US rank
- #4058
Category grades
Schools grade is shown separately in the Schools card above.
Census & demographics
- Census place
- Tulsa, OK
- City population
- 389,418
- Population (ZIP)
- 10,629
Population outlook (Tulsa County) Hauer SSP2
- Today (2025)
- 723,846 people
- By 2030
- 766,033 · +5.8%
- By 2040
- 851,386 · +17.6%
- By 2050
- 938,389 · +29.6%
- By 2075
- 1,166,011 · +61.1%
- By 2100
- 1,350,277 · +86.5%
Race, ethnicity, and origin ACS 2023
- Neighborhood character
- Predominantly White (69%)
- Race & ethnicity
- White 69% Two or more races 12% Hispanic / Latino 8% Native American 6% Asian 5% Black 3%
- Hispanic origin (detail)
- Mexican 5%
- Common ancestry
- Slovak 2% Lithuanian 2% Italian 2%
- Foreign-born
- 6% · Canada, Philippines, China
- Languages at home
- 94% English-only · Other Asian/Pacific 2% Spanish 2% Chinese 1%
Political lean MEDSL · Tulsa
- 2024 margin
- R (+15.2) · D 41.3% · R 56.5% · Other 2.2%
- 2008→2024 swing
- +9.2pp toward D · 2008: -24.5pp · 2024: -15.2pp
- All cycles
- 2024: R+15.2 2020: R+15.6 2016: R+22.9 2012: R+27.4 2008: R+24.5
Not yet ingested
- Civics
- —
Market trends
- HPI YoY
- ▼ -129.74%
- Current HPI
- 244.1502
- Rent YoY
- —
- Metro
- —
- State GDP YoY
- ▲ 1.55%
- F500 in state
- 6
Industry mix (Fortune 500 HQ in OK)
| Industry | F500 HQs | Revenue |
|---|---|---|
| Energy | 3 | $48B |
|
||
Price history
+194.4% since first listed31 events — show timeline
- 2026-05-22 Listed $265,000 MLS Technology, Inc.
- 2025-07-31 Listing Removed — MLS Technology, Inc.
- 2025-07-28 Relisted — MLS Technology, Inc.
- 2025-07-28 Listing Removed — MLS Technology, Inc.
- 2025-07-09 Relisted — MLS Technology, Inc.
- 2025-07-07 Pending — MLS Technology, Inc.
- 2025-05-01 Listed $280,000 MLS Technology, Inc.
- 2024-11-19 Listing Removed — MLS Technology, Inc.
- 2024-10-24 Price Changed $280,000 MLS Technology, Inc.
- 2024-09-26 Listed $290,000 MLS Technology, Inc.
- 2024-09-26 Rental Removed $2,600 APPFOLIO
- 2024-09-17 Listed for Rent $2,600 APPFOLIO
- 2024-01-20 Listing Removed — MLS Technology, Inc.
- 2023-11-27 Price Changed $285,000 MLS Technology, Inc.
- 2023-10-25 Listed $290,000 MLS Technology, Inc.
- 2022-02-09 Sold (Public Records) $235,000 Public Records
- 2022-01-31 Sold (MLS) $235,000 MLS Technology, Inc.
- 2021-12-27 Pending — MLS Technology, Inc.
- 2021-11-09 Price Changed $239,999 MLS Technology, Inc.
- 2021-10-25 Relisted — MLS Technology, Inc.
- 2021-10-01 Pending — MLS Technology, Inc.
- 2021-10-01 Listing Removed — MLS Technology, Inc.
- 2021-09-17 Price Changed $240,000 MLS Technology, Inc.
- 2021-09-17 Listed $230,000 MLS Technology, Inc.
- 2018-09-28 Sold (Public Records) $125,000 Public Records
- 2004-07-28 Sold (Public Records) $139,000 Public Records
- 2004-02-24 Sold (Public Records) $90,000 Public Records
- 2004-02-23 Sold (MLS) $90,000 MLS Technology, Inc.
- 2004-02-04 Listing Removed — MLS Technology, Inc.
- 2003-12-04 Listed $104,900 MLS Technology, Inc.
- 1993-05-05 Sold (Public Records) $90,000 Public Records
Property tax history
+7.2%/yrLatest (2025): $4,586 · +7.6% YoY. Source: county tax records.
Cash-flow waterfall
monthlySold comps — $/sqft
last 12 mo · ≤1 miLoading sold comps…