 Triplex
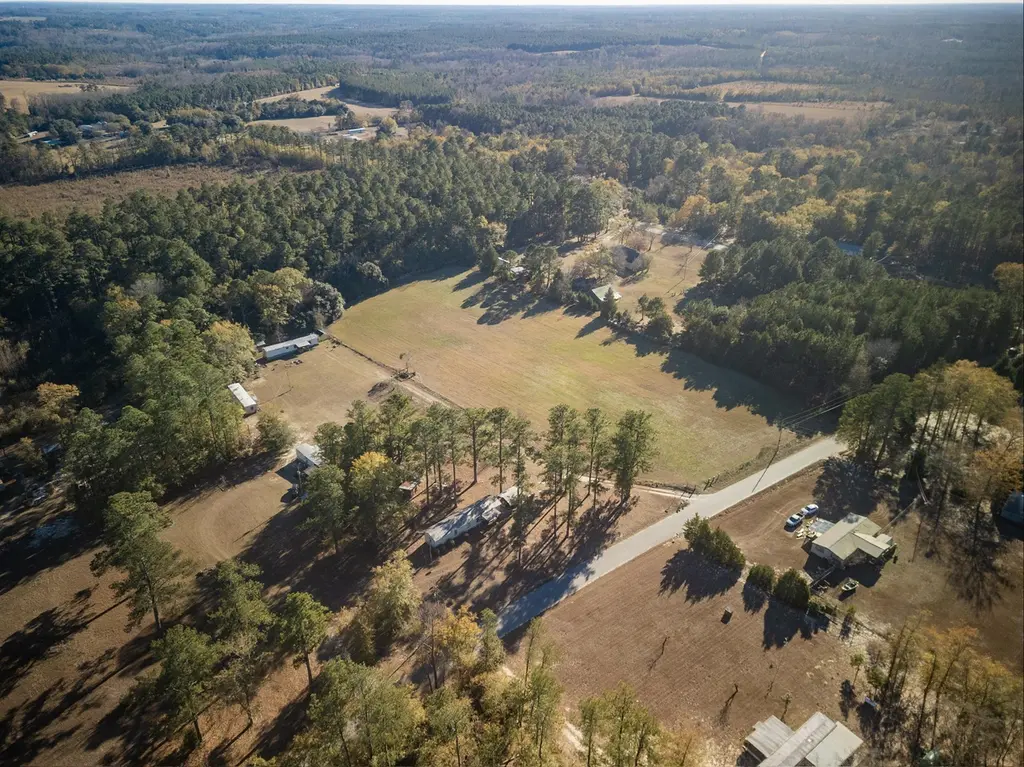
40 Hillview Rd · St. Matthews, SC
Flood risk 1/10 · Minimal
- FEMA flood zone
- X (unshaded)
- Chance of flooding over 30 yrs
- 0.0%
- Est. flood insurance / yr
- $507 – $1,088
Fire risk 3/10 · Minor
- Est. fire insurance / yr
- $783 – $1,453
Heat risk 7/10 · Major
- Hot days now (above 108°F)
- 7 days/yr
- Hot days in 30 yrs
- 16 days/yr
Wind risk 7/10 · Major
- Chance of severe wind over 30 yrs
- 78.0%
Air-quality risk 3/10 · Minor
- Unhealthy air days now
- 3 days/yr
- Unhealthy air days in 30 yrs
- 3 days/yr
Risk factors via First Street. Map © Google.
Why this score? — see what drove the B grade
The composite is a weighted blend of 9 inputs, each scored 0–100. Each bar is that input's sub-score; the figure is the points it added to the 100-point composite (weight × sub-score).
- Cash flow +30.0/30.0
- 1% rule +10.0/10.0
- DSCR +10.0/10.0
- Appreciation +10.0/10.0
- ARV discount +3.0/15.0
- Rent growth +2.5/5.0
- Schools +2.5/10.0
- Livability +2.5/5.0
- Condition / age +2.2/5.0
$275,000
🖨 Deal sheet (PDF) 📄 Offer letter ✓ Due diligence
Multi-family units
County records classify this as Multi-Family (2-4 Unit). Listing-text estimate: 3 units. confirmed
Listing remarks
This multi-family property offers an investment opportunity featuring 4 separate mobile homes on a spacious parcel of land with additional acreage available for future expansion. The current homes occupy around 2 acres leaving around 5 acres to expand. Each residence is currently rented on a month-to-month basis. Each home has privacy and ample parking. The generous acreage surrounding the homes presents significant potential offering versatile expansion possibilities. This property is perfect for investors seeking steady rental income, families looking to live close together with privacy or someone looking to capitalize on the available land. Don't pass on this chance to own a versatile pr
Key facts
- Additional acreage
- Ample parking
- Generous acreage
Tags
Property features AI
Finance
- Financial info: Four total units (income property); Tenants responsible for all utilities
Exterior
- Parking: Open parking available
- Utilities: Septic tank
- Home design: House (multi-unit residential income)
- Construction: Structure type: House
- Exterior features: Metal roof; No additional outbuildings or other structures
Interior
- Bedrooms: 9 bedrooms total
- Bathrooms: 7 bathrooms total
- Heating & cooling: Propane heating; Window unit cooling
- Interior features: Residential income property configured as a multi-unit house; Total of 4 rental units
- Laundry & utility: Tenants pay all utilities
Neighborhood map
What this means for you Summary
Snapshot
- This is a 3 × 3-bed/?-bath units multifamily listed at $275k. Condition is rated fair.
Deal economics
- At list price, monthly cash flow is $1k ($18k/yr) — positive. Per door: $490/mo.
- The deal already cash-flows at list — no discount required.
- Meets the 1% rule at list price ($4k rent vs $275k).
- Recommended offer: $267k (3.0% below list) — sets the bar for market timing.
Location & tenants
- Location reads: area grade B — affects rentability + tenant quality, not the cash-flow math above.
- Calhoun 01 (rural): math 22% / reading 37% proficiency, ranked #57 of 80 in SC (top 71%) — low school quality limits family demand, transient renter base, plan for 1-2y turnover; 78% free/reduced lunch — lower-income household profile, screen leases tightly.
- Zoned schools: Sandy Run School (math 29% / reading 35%, grade F, #369 of 597 statewide, top 64%, 570 students, 100% FRL); Calhoun County High (math 27% / reading 82%, grade C-, #130 of 196 statewide, top 69%, 423 students, 99% FRL) — zoned schools average 100% FRL vs 78% district-wide (21 pts higher); higher-poverty schools than district average — tighter screening recommended.
- Zoned-school proficiency averages 43% at this address vs 30% district-wide (+14 pts) — the actual schools serving this property are materially stronger than the Calhoun 01 average implies; a family-tenant draw the district grade alone would hide.
- Market conditions: 40 active listings in the ZIP; 48 units permitted in Calhoun County in 2024 (0 in 5+ unit buildings).
Forward outlook
- In year one you build about $29k of equity ($2k loan paydown + $28k appreciation (10.0% local appreciation)).
- Calhoun County population projected at -21% by 2050 — secular population decline; favor cash flow + early exit over multi-decade hold.
- At projected returns (10.0% appreciation + 3.0% rent growth), your $77k cash investment doubles in ~2 years — after that, you're playing with house money.
- By year 2, paydown + projected appreciation supports a ~$47k cash-out refi (75% LTV) — recoverable capital for the next deal without selling this one.
Negotiation context
- It's been on market 57 days — a 3% lower offer ($267k) is reasonable based on typical stale-listing flexibility.
- 4 sale attempts with the ask held roughly flat each time — persistent listings suggest the price (not the market) is what's stuck; bring a comps-based counter.
Risks & watch-outs
- Climate carrying-cost: major wind risk, 78% chance of damaging wind over 30y; extreme-heat days projected 7→16/yr by 2055 (HVAC capex compounding) — expect insurance premiums to compound above CPI over the hold.
Questions for the listing agent
- It's been on market 57 days. Have you received any prior offers? Is the seller open to a 3% concession, seller financing, or rate buy-down credit?
- Can we see the unit-by-unit rent roll, current vacancy, and any below-market leases? What's the average tenancy length?
- What capital expenditures (roof, boiler, parking lot, exteriors) have been made in the last 5 years, and what's planned in the next 2?
- Have any recent inspections been done? Can we get a copy of the seller's disclosures and any deferred-maintenance estimates?
- Built in 1975 — when were the roof, HVAC, electrical panel, plumbing, and water heater last replaced?
- Is there a deadline driving the sale (1031 exchange, divorce, estate, relocation)? That informs how much negotiation room exists.
- What's the average days-on-market for RENTAL listings here right now (not sales)? A rising rental-DOM trend means longer vacancies and softer asking-rent achievability than the comps imply.
- What's the recent tenant-quality profile in this submarket — average credit score on applications, eviction rate, late-payment / NSF rate, and stable-employment percentage? A property-management company in the area should have these aggregated.
- How much new apartment / multifamily construction is in the pipeline within 1–3 miles? Heavy new supply (>2% of stock underway) typically softens rents 12–24 months out; light construction supports rent growth.
Investment metrics
- 1% rule
- 1.55% ✓
- Cap rate
- 12.71%
- Cash-on-cash
- 22.93%
- DSCR
- 2.02
- GRM
- 5.4
CMA / ARV
- ARV (on-the-fly)
- $249,760
- Comps found
- 1
Show comp detail 1 sale within ~0.75 mi
| Address | Dist | Beds/Ba | Sqft | Sold | Price | $/sf | Match |
|---|---|---|---|---|---|---|---|
| 40 Hillview Rd | 0.00mi | 9/7.5 | 3,568 (0%) | 0mo | $250,000 | $70 | 100 |
Match score weights: distance 35% · size 25% · config 20% · recency 20%. Top-matched comps best support the ARV.
Projected returns pro-forma
10.0% appreciation · 3.0% rent growth · sell at horizon
- IRR
- 41.5%
- Equity multiple
- 4.16×
- Total profit
- $243,542
- Equity at exit
- $247,742
- IRR
- 35.8%
- Equity multiple
- 9.36×
- Total profit
- $643,629
- Equity at exit
- $534,265
Cash invested: $77,000 (down + closing). Projections, not guarantees.
Landlord ↔ Tenant lean methodology
- Overall (STATE)
- 90 Strongly Landlord-Friendly
- State South Carolina
- 90 Strongly Landlord-Friendly · R+6
- County
- — inherits STATE
- City
- — inherits STATE
ZIP-level market 29135
- Home prices YoY
- 17.2%
- Active inventory
- 40
- Price-to-rent
- 16.1×
Monthly cashflow live
- Estimated rent
- $4,268 medium interval (Pro) →
- Mortgage (P&I)
- −$1,442
- Tax est. 1.5%
- −$344 /mo · $4,125/yr
- Insurance
- −$115
- HOA
- −$0
- Lot rent
- −$0
- Vacancy / Maint / Mgmt
- −$896
- Net cashflow
- $1,471
Break-even live
Sensitivity live
| Price | -10% $1,661 | -5% $1,566 | +0% $1,471 | +5% $1,376 | +10% $1,281 |
|---|---|---|---|---|---|
| Rent | -10% $1,134 | -5% $1,303 | +0% $1,471 | +5% $1,640 | +10% $1,808 |
| Rate | -1.0pp $1,610 | -0.5pp $1,541 | base $1,471 | +0.5pp $1,400 | +1.0pp $1,328 |
3-unit breakdown (identical units grouped — click to expand)
| Units | Beds | Baths | Est. rent |
|---|---|---|---|
| 3× units | 3 | — | $4,269 |
| #1 | 3 | — | $1,423 |
| #2 | 3 | — | $1,423 |
| #3 | 3 | — | $1,423 |
| Total (3 units) | $4,268 | ||
UW: 25.0% down · 7.5% · 30yr · 1.5% tax · 5.0% vac · 8.0% maint · 8.0% mgmt
Financing live
Cash to close
- Down payment
- $68,750
- Closing costs
- $8,250
- Reserves months
- —
- Total cash needed
- —
Loan-product check · same deal, 3 products live
Conventional
25% down · 7.5% · 30yr
- Down + closing
- —
- Monthly P&I
- —
- Monthly cashflow
- —
- DSCR
- —
- Eligible?
- —
Personal DTI + credit; lowest rate.
DSCR
20% down · 8.5% · 30yr
- Down + closing
- —
- Monthly P&I
- —
- Monthly cashflow
- —
- DSCR
- —
- Eligible?
- —
No personal income docs; deal must DSCR.
Hard money
10% down · 12.0% · 12mo
- Down + closing
- —
- Monthly P&I
- —
- Monthly cashflow
- —
- DSCR
- —
- Eligible?
- —
Short-term bridge; refi at stabilization.
Listing history 14 events
-
2026-05-21status Pending
-
2026-04-29historical Active Under Contract
-
2026-03-24$275,000 Active
-
2026-03-12historical
-
2025-12-18$275,000 Active
-
2025-11-16historical
-
2025-08-13status Active
-
2025-08-13price $275,000
-
2025-08-01historical
-
2025-06-17price $325,000
-
2025-06-17price $325,000
-
2025-05-19price $340,000
-
2025-05-19price $340,000
-
2025-01-29$350,000 Active
ⓘ Source: listings_history table (triggers on properties + properties_extension) + one-shot
backfill from property_details.listing_events for pre-trigger history.
Climate risk First Street
- Flood 1/10 Low FEMA zone X (unshaded) · 0% chance over 30 yrs
- Wildfire 3/10 Moderate
- Heat 7/10 Severe 7 d/yr ≥108°F today · 16 d/yr by 30 yrs out
- Wind 7/10 Severe 78% chance of damaging wind over 30 yrs
- Air quality 3/10 Moderate 3 unhealthy d/yr today · 3 by 30 yrs out
Nearby sold comps map
Loading sold comps map…
Walkable amenities ~0.75 mi
Loading nearby amenities…
Taxation est. · year 1
- Rental income
- $51,216
- − Mortgage interest
- −$15,404
- − Property taxes
- −$4,125
- − Insurance
- −$1,375
- − Repairs & maintenance
- −$4,097
- − Management
- −$4,097
- − Depreciation
- −$8,000
- Taxable income
- $14,117
- Est. tax owed @ 24.0%
- −$3,388
- After-tax cash flow
- $14,267/yr
For passive investors: Depreciation is non-cash, so a rental often shows a tax loss while cash-flowing — sheltering income. Rental losses are passive: they offset passive income freely, and up to $25,000/yr can offset ordinary (W-2) income if you actively participate and your MAGI is under $100k (phasing out to $0 by $150k); unused losses carry forward. On sale, claimed depreciation is recaptured at up to 25%, and gains may owe capital-gains tax (a 1031 exchange can defer both). Figures are a year-1 estimate at your 24.0% rate — not tax advice; consult a CPA.
Condition & rehab AI · 12 photos
This multi-family property requires extensive repairs and maintenance to improve its condition and increase its value. The roof, exterior siding, flooring, interior walls, HVAC, and foundation all require major repairs. Painting the exterior siding and repairing the roof will improve the property's curb appeal and increase its value.
Repairs flagged
- Major roof — The roof appears to be in poor condition, with visible wear and tear.
- Major exterior siding — The exterior siding shows signs of wear and tear, with some sections appearing loose or damaged.
- Major flooring — The flooring in the visible areas appears to be in poor condition, with visible wear and tear.
- Major interior walls/paint — The interior walls and paint appear to be in poor condition, with visible wear and tear.
- Major HVAC/mechanicals — The HVAC and mechanical systems appear to be in poor condition, with visible wear and tear.
- Major foundation/structure — The foundation and structure appear to be in poor condition, with visible wear and tear. The mobile homes are elevated on stilts, which may indicate some structural issues.
Value-add opportunities
- Both paint the exterior siding — Painting the exterior siding will improve the curb appeal and increase the property's value.
- Both repair the roof — Repairing the roof will improve the property's structural integrity and increase its value.
- Both replace the flooring — Replacing the flooring will improve the property's condition and increase its value.
- Both paint the interior walls and trim — Painting the interior walls and trim will improve the property's condition and increase its value.
- Both repair the HVAC and mechanical systems — Repairing the HVAC and mechanical systems will improve the property's condition and increase its value.
- Both repair the foundation and structure — Repairing the foundation and structure will improve the property's structural integrity and increase its value.
Renovation cost estimate screening
| Repair item | Severity | Est. cost |
|---|---|---|
| roof · The roof appears to be in poor condition, with visible wear and tear. | Major | $15,000–50,000 |
| exterior siding · The exterior siding shows signs of wear and tear, with some sections appearing loose or damaged. | Major | $15,000–50,000 |
| flooring · The flooring in the visible areas appears to be in poor condition, with visible wear and tear. | Major | $15,000–50,000 |
| interior walls/paint · The interior walls and paint appear to be in poor condition, with visible wear and tear. | Major | $15,000–50,000 |
| HVAC/mechanicals · The HVAC and mechanical systems appear to be in poor condition, with visible wear and tear. | Major | $15,000–50,000 |
| foundation/structure · The foundation and structure appear to be in poor condition, with visible wear and tear. The mobile homes are elevated on stilts, which may indicate some structural issues. | Major | $15,000–50,000 |
| Total estimated repair cost · 6 items | $90,000–300,000 |
Value-add ROI direction
- Both paint the exterior siding — Painting the exterior siding will improve the curb appeal and increase the property's value. ↑
- Both repair the roof — Repairing the roof will improve the property's structural integrity and increase its value. ↑
- Both replace the flooring — Replacing the flooring will improve the property's condition and increase its value. ↑
- Both paint the interior walls and trim — Painting the interior walls and trim will improve the property's condition and increase its value. ↑
- Both repair the HVAC and mechanical systems — Repairing the HVAC and mechanical systems will improve the property's condition and increase its value. ↑
- Both repair the foundation and structure — Repairing the foundation and structure will improve the property's structural integrity and increase its value. ↑
ⓘ Cost ranges are severity-bucket heuristics (US national rule-of-thumb). Get contractor quotes + a written scope before underwriting a rehab budget.
Schools (NCES district)
- District
- Calhoun 01
- NCES district ID
- 4501250
- Math proficiency
- 22% ▼ -17.00%
- Reading proficiency
- 37% ▼ -2.00%
- Median HH income
- $40,577
- Composite
- 24.83/100
- National rank
- #7594
- State rank
- #57 of 80 in SC
Livability — St. Matthews
No livability data for this city. (Only ~50 U.S. cities are tracked.)
Census & demographics
- Population (ZIP)
- 7,940
Population outlook (Calhoun County) Hauer SSP2
- Today (2025)
- 14,194 people
- By 2030
- 13,723 · -3.3%
- By 2040
- 12,516 · -11.8%
- By 2050
- 11,220 · -21.0%
- By 2075
- 8,607 · -39.4%
- By 2100
- 6,477 · -54.4%
Race, ethnicity, and origin ACS 2023
- Neighborhood character
- Diverse neighborhood (Simpson 0.57)
- Race & ethnicity
- White 47% Black 45% Hispanic / Latino 5% Two or more races 2%
- Hispanic origin (detail)
- Mexican 5%
- Common ancestry
- Slovak 2% Serbian 2% Portuguese 1%
- Foreign-born
- 3% · Canada
- Languages at home
- 94% English-only · Spanish 5%
Political lean MEDSL · Calhoun
- 2024 margin
- R (+14.3) · D 42.2% · R 56.5% · Other 1.3%
- 2008→2024 swing
- -17.9pp toward R · 2008: 3.6pp · 2024: -14.3pp
- All cycles
- 2024: R+14.3 2020: R+4.8 2016: R+2.9 2012: D+4.3 2008: D+3.6
Not yet ingested
- Civics
- —
Market trends
- HPI YoY
- ▲ 35.59%
- Current HPI
- 241.9299
- Rent YoY
- —
- Metro
- —
- State GDP YoY
- ▲ 4.51%
- F500 in state
- 2
Industry mix (Fortune 500 HQ in SC)
| Industry | F500 HQs | Revenue |
|---|---|---|
| Packaging | 1 | $7B |
|
||
Price history
-21.4% since first listed14 events — show timeline
- 2026-05-21 Pending — Charleston Trident MLS
- 2026-04-29 Contingent — Charleston Trident MLS
- 2026-03-24 Listed $275,000 Charleston Trident MLS
- 2026-03-12 Listing Removed — Charleston Trident MLS
- 2025-12-18 Listed $275,000 Charleston Trident MLS
- 2025-11-16 Listing Removed — Charleston Trident MLS
- 2025-08-13 Relisted — Charleston Trident MLS
- 2025-08-13 Price Changed $275,000 Charleston Trident MLS
- 2025-08-01 Listing Removed — Charleston Trident MLS
- 2025-06-17 Price Changed $325,000 SBOR
- 2025-06-17 Price Changed $325,000 Charleston Trident MLS
- 2025-05-19 Price Changed $340,000 SBOR
- 2025-05-19 Price Changed $340,000 Charleston Trident MLS
- 2025-01-29 Listed $350,000 Charleston Trident MLS
Cash-flow waterfall
monthlySold comps — $/sqft
last 12 mo · ≤1 miLoading sold comps…