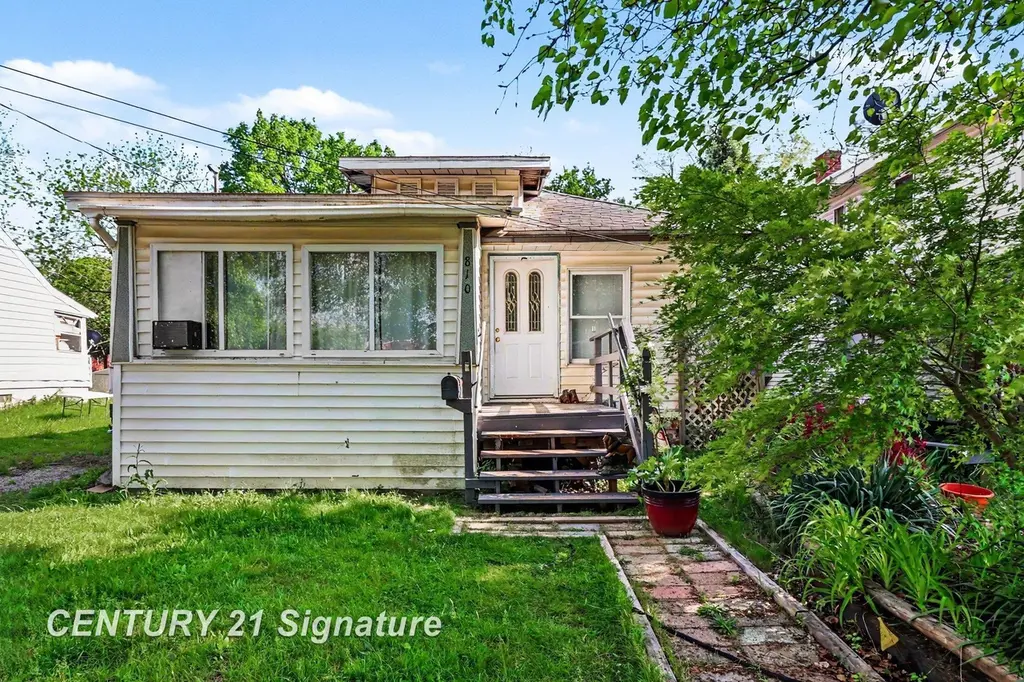
810 Mckinley St · Lansing, MI
Flood risk 4/10 · Minor
- FEMA flood zone
- X (unshaded)
- Chance of flooding over 30 yrs
- 0.22%
- Est. flood insurance / yr
- $473 – $860
Fire risk 1/10 · Minimal
- Est. fire insurance / yr
- $784 – $1,456
Heat risk 3/10 · Minor
- Hot days now (above 97°F)
- 7 days/yr
- Hot days in 30 yrs
- 16 days/yr
Wind risk 2/10 · Minimal
- Chance of severe wind over 30 yrs
- —
Air-quality risk 2/10 · Minimal
- Unhealthy air days now
- 1 days/yr
- Unhealthy air days in 30 yrs
- 2 days/yr
Risk factors via First Street. Map © Google.
Why this score? — see what drove the B+ grade
The composite is a weighted blend of 9 inputs, each scored 0–100. Each bar is that input's sub-score; the figure is the points it added to the 100-point composite (weight × sub-score).
- Cash flow +30.0/30.0
- ARV discount +15.0/15.0
- 1% rule +10.0/10.0
- DSCR +10.0/10.0
- Rent growth +5.0/5.0
- Livability +4.0/5.0
- Condition / age +2.5/5.0
- Schools +1.9/10.0
- Appreciation +0.0/10.0
$57,900
🖨 Deal sheet 📄 Offer letter ✓ Due diligence
Listing remarks
Opportunity knocks on this quiet dead-end street in Lansing's northside. This 2 beds, 1 bath, 818 sq ft bungalow sits on a deep 0.19-acre lot and is the perfect chance to build equity while you live in it. The home is move in ready, with a classic Michigan basement, a very solid furnace, and a layout that gives you a functional starting point as you update and improve. Yes the home needs work, and it's priced exactly to reflect that. But the potential is undeniable: great lot, low traffic location, simple footprint, and a property you can transform at your own pace. Investors, DIY buyers, and anyone looking for an affordable home with upside will see the value here.
Key facts
- Deep lot
- Solid furnace
- Low traffic location
Tags
Neighborhood map
What this means for you Summary
Snapshot
- This is a 2-bed/1.0-bath single-family listed at $58k.
Deal economics
- At list price, monthly cash flow is $410 ($5k/yr) — positive.
- The deal already cash-flows at list — no discount required.
- Meets the 1% rule at list price ($1k rent vs $58k).
- Recommended offer: $57k (1.5% below list) — sets the bar for market timing.
- Cap rate 14.8% vs local median 6.0% in Lansing — top-decile yield for the area; either an underpriced asset or a hidden risk that comps aren't pricing in. Stress-test before assuming the spread holds.
Location & tenants
- Location reads 79/100 on livability (#94 in MI, #2,182 nationally) — a middle-class / working-renter tenant base. Strengths: amenities A+, commute A+, cost of living A+; Watch: employment D, schools F, crime F.
- Lansing Public School District (urban): math 14% / reading 23% proficiency, ranked #650 of 760 in MI (top 86%) — low school quality limits family demand, transient renter base, plan for 1-2y turnover; 68% free/reduced lunch — lower-income household profile, screen leases tightly.
- Market conditions: Rents rising fast (+10.5%/yr); 138 active listings in the ZIP; 39 comparable units currently listed for rent nearby; rentals lingering (median 44d on market — plan ~5-8 weeks vacancy on turnover, expect pricing pressure); 67% of comp listings sitting > 30 days — soft ceiling on asking rent; 350 units permitted in Ingham County in 2024 (186 in 5+ unit buildings).
Forward outlook
- Local home prices are declining (-3.0%/yr); year-one equity from $400 of loan paydown is wiped out by about $2k of value loss. Plan a longer hold.
- Ingham County population projected at +11% by 2050 — modest demand growth; plan on rents tracking national, not racing it.
- At projected returns (-3.0% appreciation + 8.0% rent growth), your $16k cash investment doubles in ~4 years — after that, you're playing with house money.
Negotiation context
- It's been on market 28 days — a 2% lower offer ($57k) is reasonable based on typical stale-listing flexibility.
- 2 sale attempts; this cycle's ask has dropped $27k (32%) from the opening price — seller is motivated, your offer sets the floor, not the list.
Risks & watch-outs
- Watch-outs: property tax is 4.3% of price; built in 1916 — expect roof / HVAC / electrical / plumbing capex.
Questions for the listing agent
- Built in 1916 — when were the roof, HVAC, electrical panel, plumbing, and water heater last replaced?
- Property tax is high relative to price — has the assessment been appealed recently, and will the sale trigger a re-assessment?
- Is there a deadline driving the sale (1031 exchange, divorce, estate, relocation)? That informs how much negotiation room exists.
- Schools are F-rated, which usually means shorter tenancies and higher turnover. Who's the typical renter profile here, and what's been the actual vacancy rate?
- Crime grade is F in this area — have there been break-ins, vandalism, or insurance claims at this property in the last 3 years? What carrier currently insures it and at what premium?
- What's the average days-on-market for RENTAL listings here right now (not sales)? A rising rental-DOM trend means longer vacancies and softer asking-rent achievability than the comps imply.
- What's the recent tenant-quality profile in this submarket — average credit score on applications, eviction rate, late-payment / NSF rate, and stable-employment percentage? A property-management company in the area should have these aggregated.
- How much new for-sale + rental construction is in the pipeline within 1–3 miles? Heavy new supply typically softens prices + rents 12–24 months out; constrained supply supports both.
Investment metrics
- 1% rule
- 2.07% ✓
- Cap rate
- 14.79%
- Cash-on-cash
- 30.35%
- DSCR
- 2.35
- GRM
- 4.0
CMA / ARV
- ARV (on-the-fly)
- $77,710
- Comps found
- 12
Show comp detail 12 sales within ~0.75 mi
| Address | Dist | Beds/Ba | Sqft | Sold | Price | $/sf | Match |
|---|---|---|---|---|---|---|---|
| 1624 N High St | 0.09mi | 2/1.0 | 832 (+2%) | 4mo | $78,700 | $95 | 90 |
| 1530 Ballard St | 0.14mi | 2/1.0 | 864 (+6%) | 2mo | $40,000 | $46 | 82 |
| 331 Douglas Ave | 0.47mi | 2/1.0 | 804 (-2%) | 2mo | $105,000 | $131 | 74 |
| 1022 Persons Ct | 0.48mi | 2/1.0 | 714 (-13%) | 0mo | $66,000 | $92 | 56 |
| 1318 Massachusetts Ave | 0.35mi | 3/1.0 (+1) | 913 (+12%) | 7mo | $86,000 | $94 | 53 |
| 1035 May St | 0.74mi | 3/1.0 (+1) | 786 (-4%) | 2mo | $55,000 | $70 | 52 |
| 928 Porter St | 0.52mi | 2/1.0 | 915 (+12%) | 8mo | $95,000 | $104 | 49 |
| 1102 Persons Ct | 0.49mi | 3/1.0 (+1) | 720 (-12%) | 5mo | $67,500 | $94 | 48 |
| 801 Banghart St | 0.54mi | 2/1.5 | 720 (-12%) | 6mo | $60,000 | $83 | 48 |
| 205 E Thomas St | 0.68mi | 2/1.0 | 916 (+12%) | 2mo | $129,900 | $142 | 46 |
| 717 E Bates St | 0.67mi | 2/1.5 | 912 (+12%) | 7mo | $160,000 | $175 | 41 |
| 1101 May St | 0.75mi | 3/1.0 (+1) | 920 (+12%) | 1mo | $115,388 | $125 | 38 |
Match score weights: distance 35% · size 25% · config 20% · recency 20%. Top-matched comps best support the ARV.
Projected returns pro-forma
-3.0% appreciation · 8.0% rent growth · sell at horizon
- IRR
- 31.5%
- Equity multiple
- 2.43×
- Total profit
- $23,168
- Equity at exit
- $8,633
- IRR
- 41.7%
- Equity multiple
- 6.12×
- Total profit
- $83,033
- Equity at exit
- $5,006
Cash invested: $16,212 (down + closing). Projections, not guarantees.
Landlord ↔ Tenant lean methodology
- Overall (STATE)
- 62 Landlord-Friendly
- State Michigan
- 62 Landlord-Friendly · EVEN
- County
- — inherits STATE
- City
- — inherits STATE
ZIP-level market 48906
- Rents YoY
- 10.5%
- Active inventory
- 138
- Price-to-rent
- 4.0×
Monthly cashflow live
- Estimated rent
- $1,198 high interval (Pro) →
- Mortgage (P&I)
- −$304
- Tax from tax record
- −$209 /mo · $2,503/yr
- Insurance
- −$24
- HOA
- −$0
- Vacancy / Maint / Mgmt
- −$252
- Net cashflow
- $410
Break-even live
UW: 25.0% down · 7.5% · 30yr · 1.5% tax · 5.0% vac · 8.0% maint · 8.0% mgmt
Financing live
Cash to close
- Down payment
- $14,475
- Closing costs
- $1,737
- Reserves months
- —
- Total cash needed
- —
Loan-product check · same deal, 3 products live
Conventional
25% down · 7.5% · 30yr
- Down + closing
- —
- Monthly P&I
- —
- Monthly cashflow
- —
- DSCR
- —
- Eligible?
- —
Personal DTI + credit; lowest rate.
DSCR
20% down · 8.5% · 30yr
- Down + closing
- —
- Monthly P&I
- —
- Monthly cashflow
- —
- DSCR
- —
- Eligible?
- —
No personal income docs; deal must DSCR.
Hard money
10% down · 12.0% · 12mo
- Down + closing
- —
- Monthly P&I
- —
- Monthly cashflow
- —
- DSCR
- —
- Eligible?
- —
Short-term bridge; refi at stabilization.
Rent comps 39 comps
| Address | Beds | Baths | Sqft | Rent | $/sqft | DOM | Units | Dist |
|---|---|---|---|---|---|---|---|---|
| 1561 Massachusetts Ave Lansing, MI | 3.0 | 2.0 | 1100 | $1,400 | $1.27 | 44d | 1 | 0.22mi |
| 117 E North St Unit A Lansing, MI | 2.0 | 1.0 | 812 | $1,050 | $1.29 | 14d | 1 | 0.61mi |
| 832 N Larch St Apt 3 Lansing, MI | 2.0 | 1.0 | 890 | $1,095 | $1.23 | 44d | 1 | 0.70mi |
| 824 Cleveland St Lansing, MI | 2.0 | 1.0 | 839 | $1,150 | $1.37 | 21d | 1 | 0.77mi |
| 620 May St Lansing, MI | 1.0–2.0 | 1.0–2.0 | 1126 | $1,578 | $1.40 | 14d | 12 | 0.78mi |
| 1715 Peppertree Ln Lansing, MI | 2.0–3.0 | 1.5 | 1120 | $1,495 | $1.33 | 44d | 2 | 0.78mi |
| 730 Johnson Ave Lansing, MI | 2.0 | 1.0 | 840 | $1,225 | $1.46 | 44d | 1 | 0.79mi |
| 1025 N Washington Ave Unit 9 Lansing, MI | 1.0 | 1.0 | 670 | $1,000 | $1.49 | 44d | 1 | 0.82mi |
| 1016 N Capitol Ave Unit 1 Lansing, MI | 1.0 | 1.0 | 700 | $850 | $1.21 | 44d | 1 | 0.86mi |
| 732 Maryland Ave Lansing, MI | 1.0 | 1.0 | 771 | $1,550 | $2.01 | 21d | 1 | 0.93mi |
| 1216 N Chestnut St Lansing, MI | 1.0 | 1.0 | 562 | $900 | $1.60 | 14d | 1 | 0.97mi |
| 801 N Capitol Ave Unit 4 Lansing, MI | 1.0 | 1.0 | 600 | $1,000 | $1.67 | 44d | 1 | 1.02mi |
| 801 N Capitol Ave Unit 1 Lansing, MI | 1.0 | 1.0 | 550 | $950 | $1.73 | 44d | 1 | 1.03mi |
| 1228 N Fairview Ave Lansing, MI | 3.0 | 2.0 | 1100 | $1,700 | $1.55 | 44d | 1 | 1.05mi |
| 905 E Shiawassee St Unit 837-01 Lansing, MI | 2.0 | 1.0 | 800 | $850 | $1.06 | 44d | 1 | 1.08mi |
| 905 E Shiawassee St Unit 837-02 Lansing, MI | 2.0 | 1.0 | 800 | $750 | $0.94 | 44d | 1 | 1.08mi |
| 826 N Walnut St Lansing, MI | 1.0 | 1.0 | 700 | $700 | $1.00 | 44d | 2 | 1.08mi |
| 1010 N Pine St Unit B Lansing, MI | 2.0 | 1.0 | 750 | $1,100 | $1.47 | 44d | 1 | 1.13mi |
| 316 W Saginaw St Unit 318 Lansing, MI | 1.0 | 1.0 | 750 | $950 | $1.27 | 44d | 1 | 1.16mi |
| 936 N Fairview Ave Lansing, MI | 1.0–2.0 | 1.0 | 825 | $1,245 | $1.51 | 44d | 2 | 1.18mi |
| 323 W Saginaw St Unit 1 Lansing, MI | 1.0 | 1.0 | 1000 | $1,000 | $1.00 | 44d | 1 | 1.19mi |
| 1245 Weber Dr Unit 2 Lansing, MI | 2.0 | 1.0 | 700 | $1,250 | $1.79 | 44d | 1 | 1.23mi |
| 524 N Walnut St Lansing, MI | 2.0 | 1.0 | 1000 | $1,150 | $1.15 | 44d | 1 | 1.26mi |
| 410 W Lapeer St Unit 1 Lansing, MI | 2.0 | 1.0 | 800 | $1,050 | $1.31 | 21d | 1 | 1.26mi |
| 427 Seymour Ave Unit 315 Lansing, MI | 2.0 | 1.0 | 550 | $1,300 | $2.36 | 21d | 1 | 1.30mi |
| 427 Seymour Ave Unit 315 Lansing, MI | 2.0 | 1.0 | 550 | $1,300 | $2.36 | 44d | 1 | 1.30mi |
| 427 Seymour Ave Unit 205 Lansing, MI | 1.0 | 1.0 | 570 | $1,100 | $1.93 | 44d | 1 | 1.30mi |
| 427 Seymour Ave Unit 102 Lansing, MI | 1.0 | 1.0 | 540 | $850 | $1.57 | 21d | 1 | 1.30mi |
| 504 W Lapeer St Apt A Lansing, MI | 2.0 | 1.0 | 600 | $895 | $1.49 | 44d | 1 | 1.30mi |
| 113 Pere Marquette Dr Lansing, MI | 1.0–2.0 | 1.0–2.0 | 1065 | $2,250 | $2.11 | 14d | 9 | 1.32mi |
| 712 N Sycamore St Lansing, MI | 3.0 | 1.0 | 1100 | $1,650 | $1.50 | 21d | 1 | 1.35mi |
| 731 N Sycamore St Unit 1 Lansing, MI | 2.0 | 1.0 | 950 | $945 | $0.99 | 44d | 1 | 1.35mi |
| 2520 Lake Lansing Rd Lansing, MI | 2.0 | 2.0 | 1049 | $1,668 | $1.59 | 14d | 13 | 1.36mi |
| 610 N Sycamore St Unit 1 Lansing, MI | 1.0 | 1.0 | 900 | $875 | $0.97 | 14d | 1 | 1.39mi |
| 2417 Kerry St Unit 11 Lansing, MI | 2.0 | 1.0 | 900 | $1,000 | $1.11 | 44d | 1 | 1.43mi |
| 2620 Senate Dr Lansing, MI | 1.0–2.0 | 1.0–2.0 | 950 | $1,800 | $1.89 | 44d | 1 | 1.44mi |
| 307 N Walnut St Unit 307 Lansing, MI | 1.0 | 1.0 | 550 | $1,100 | $2.00 | 44d | 1 | 1.45mi |
| 919 Princeton Ave Lansing, MI | 3.0 | 1.5 | 1119 | $1,475 | $1.32 | 21d | 1 | 1.46mi |
| 1629 E Michigan Ave Unit 306 Lansing, MI | 2.0 | 1.0 | 901 | $1,550 | $1.72 | 44d | 1 | 1.50mi |
Listing history 24 events
-
2026-06-18days on market $57,900 Active 28 DOM
-
2026-06-17days on market $57,900 Active 27 DOM
-
2026-06-16days on market $57,900 Active 26 DOM
-
2026-06-15days on market $57,900 Active 25 DOM
-
2026-06-14days on market $57,900 Active 23 DOM
-
2026-06-13days on market $57,900 Active 22 DOM
-
2026-06-10days on market $57,900 Active 20 DOM
-
2026-06-09days on market $57,900 Active 19 DOM
-
2026-06-08days on market $57,900 Active 18 DOM
-
2026-06-07days on market $57,900 Active 17 DOM
-
2026-06-05days on market $57,900 Active 14 DOM
-
2026-06-03days on market $57,900 Active 13 DOM
-
2026-06-02days on market $57,900 Active 12 DOM
-
2026-06-01days on market $57,900 Active 11 DOM
-
2026-05-31days on market $57,900 Active 10 DOM
-
2026-05-30days on market $57,900 Active 9 DOM
-
2026-05-07historical
-
2026-05-07historical
-
2026-04-06price $70,000
-
2026-04-06price $70,000
-
2026-03-24price $75,000
-
2026-03-23price $75,000
-
2026-03-10$85,000 Active
-
2026-03-10$85,000 Active
ⓘ Source: listings_history table (triggers on properties + properties_extension) + one-shot
backfill from property_details.listing_events for pre-trigger history.
Tax reassessment forecast MI · Partial reset (capped growth)
- Current annual tax
- $2,503 · $209/mo
- Projected year-2 tax
- $2,503 · $209/mo
- Expected delta
- $0/yr ($0/mo · 0.0%)
ⓘ Screening estimate from a state-policy table — verify with the county assessor before closing.
Climate risk First Street
- Flood 4/10 Moderate FEMA zone X (unshaded) · 22% chance over 30 yrs
- Wildfire 1/10 Low
- Heat 3/10 Moderate 7 d/yr ≥97°F today · 16 d/yr by 30 yrs out
- Wind 2/10 Low
- Air quality 2/10 Low 1 unhealthy d/yr today · 2 by 30 yrs out
Nearby sold comps map
Loading sold comps map…
Walkable amenities ~0.75 mi
Loading nearby amenities…
Taxation est. · year 1
- Rental income
- $14,376
- − Mortgage interest
- −$3,243
- − Property taxes
- −$2,503
- − Insurance
- −$290
- − Repairs & maintenance
- −$1,150
- − Management
- −$1,150
- − Depreciation
- −$1,684
- Taxable income
- $4,356
- Est. tax owed @ 24.0%
- −$1,045
- After-tax cash flow
- $3,875/yr
For passive investors: Depreciation is non-cash, so a rental often shows a tax loss while cash-flowing — sheltering income. Rental losses are passive: they offset passive income freely, and up to $25,000/yr can offset ordinary (W-2) income if you actively participate and your MAGI is under $100k (phasing out to $0 by $150k); unused losses carry forward. On sale, claimed depreciation is recaptured at up to 25%, and gains may owe capital-gains tax (a 1031 exchange can defer both). Figures are a year-1 estimate at your 24.0% rate — not tax advice; consult a CPA.
Schools (NCES district)
- District
- Lansing Public School District
- NCES district ID
- 2621150
- Math proficiency
- 14% ▲ 1.00%
- Reading proficiency
- 23% ▲ 3.00%
- Median HH income
- $37,453
- Composite
- 18.76/100
- National rank
- #14002
- State rank
- #650 of 760 in MI
Livability — Lansing
- Score
- 79/100
- State rank
- #94
- US rank
- #2182
Category grades
Schools grade is shown separately in the Schools card above.
Census & demographics
- Census place
- Lansing, MI
- County
- Ingham County · 237,052 people
- City population
- 161,269
- Metro
- Lansing-East Lansing, MI
- Population (ZIP)
- 25,901
- Household income
- $64,315
- Rent vs Own
- Severe rent burden
- 851.0
Population outlook (Ingham County) Hauer SSP2
- Today (2025)
- 300,362 people
- By 2030
- 307,808 · +2.5%
- By 2040
- 320,492 · +6.7%
- By 2050
- 333,223 · +10.9%
- By 2075
- 373,693 · +24.4%
- By 2100
- 392,021 · +30.5%
Race, ethnicity, and origin ACS 2023
- Neighborhood character
- Diverse neighborhood (Simpson 0.56)
- Race & ethnicity
- White 64% Black 15% Two or more races 12% Hispanic / Latino 12% Asian 2%
- Hispanic origin (detail)
- Mexican 9%
- Common ancestry
- Romanian 3% Lithuanian 2% Iranian 2%
- Foreign-born
- 6% · Canada, China
- Languages at home
- 88% English-only · Spanish 5% Other Asian/Pacific 1% French/Haitian/Cajun 1%
Political lean MEDSL · Ingham
- 2024 margin
- Strong D (+29.7) · D 63.9% · R 34.2% · Other 2.0%
- 2008→2024 swing
- -3.6pp toward R · 2008: 33.3pp · 2024: 29.7pp
- All cycles
- 2024: D+29.7 2020: D+32.2 2016: D+27.6 2012: D+27.9 2008: D+33.3
Not yet ingested
- Civics
- —
Market trends
- HPI YoY
- ▼ -135.54%
- Current HPI
- 228.7023
- Rent YoY
- ▲ 10.50%
- Metro
- Lansing-East Lansing, MI
- State GDP YoY
- ▲ 1.37%
- F500 in state
- 28
Industry mix (Fortune 500 HQ in MI)
| Industry | F500 HQs | Revenue |
|---|---|---|
| Automotive Parts | 3 | $48B |
|
||
| Automotive | 2 | $372B |
|
||
| Chemicals | 1 | $45B |
|
||
| Automotive Retail | 1 | $29B |
|
||
| Healthcare / Medical Devices | 1 | $23B |
|
||
| Automotive Technology | 1 | $20B |
|
||
Price history
-17.6% since first listed8 events — show timeline
- 2026-05-07 Listing Removed — REALCOMP
- 2026-05-07 Listing Removed — MiRealSource-MiMLS
- 2026-04-06 Price Changed $70,000 MiRealSource-MiMLS
- 2026-04-06 Price Changed $70,000 REALCOMP
- 2026-03-24 Price Changed $75,000 MiRealSource-MiMLS
- 2026-03-23 Price Changed $75,000 REALCOMP
- 2026-03-10 Listed $85,000 REALCOMP
- 2026-03-10 Listed $85,000 MiRealSource-MiMLS
Property tax history
+6.4%/yrLatest (2025): $2,503 · -31.5% YoY. Source: county tax records.
Cash-flow waterfall
monthlySold comps — $/sqft
last 12 mo · ≤1 miLoading sold comps…