 🏗️ New Construction
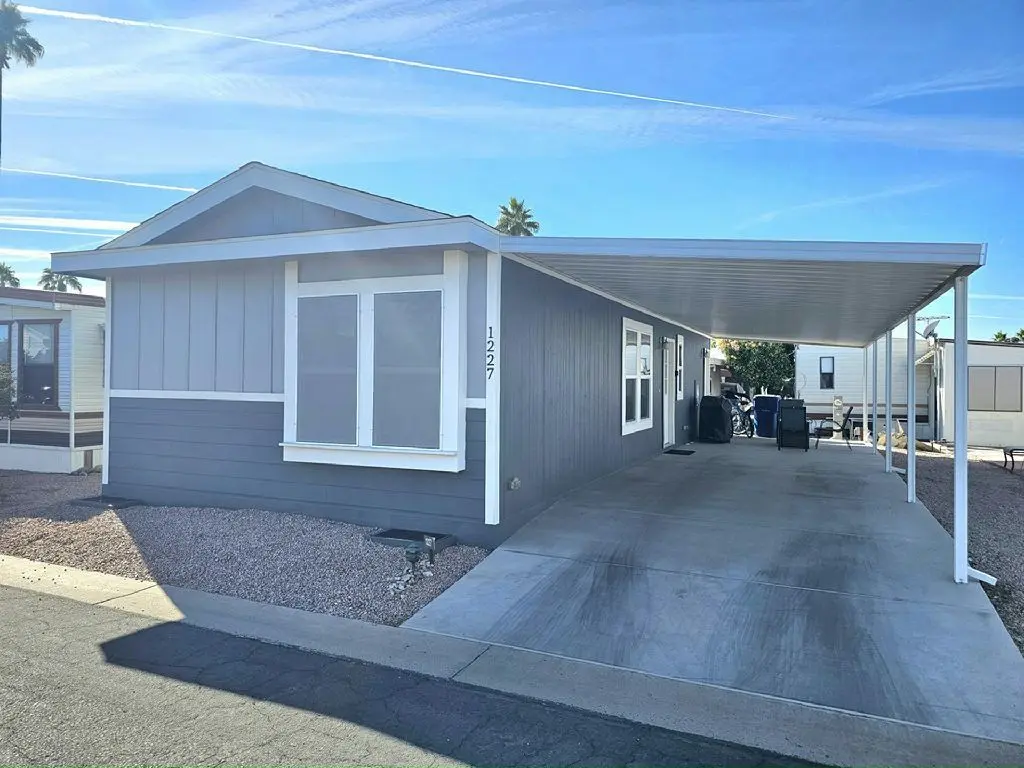
CANYON VILLA B Plan · Mesa, AZ
Flood risk 1/10 · Minimal
- FEMA flood zone
- X (shaded)
- Chance of flooding over 30 yrs
- 0.0%
- Est. flood insurance / yr
- $507 – $1,088
Fire risk 4/10 · Minor
- Est. fire insurance / yr
- $610 – $1,132
Heat risk 9/10 · Severe
- Hot days now (above 111°F)
- 7 days/yr
- Hot days in 30 yrs
- 20 days/yr
Wind risk 1/10 · Minimal
- Chance of severe wind over 30 yrs
- —
Air-quality risk 3/10 · Minor
- Unhealthy air days now
- 2 days/yr
- Unhealthy air days in 30 yrs
- 3 days/yr
Risk factors via First Street. Map © Google.
Why this score? — see what drove the B+ grade
The composite is a weighted blend of 9 inputs, each scored 0–100. Each bar is that input's sub-score; the figure is the points it added to the 100-point composite (weight × sub-score).
- Cash flow +30.0/30.0
- 1% rule +10.0/10.0
- DSCR +10.0/10.0
- ARV discount +7.5/15.0
- Appreciation +5.7/10.0
- Schools +4.6/10.0
- Livability +4.0/5.0
- Condition / age +4.0/5.0
- Rent growth +2.6/5.0
$104,900
🖨 Deal sheet 📄 Offer letter ✓ Due diligence
Key facts
- Resort style pools
- Tennis
- Pickleball
Tags
Neighborhood map
What this means for you Summary
Snapshot
- This is a 2-bed/2.0-bath manufactured listed at $105k. Condition is rated good.
Deal economics
- At list price, monthly cash flow is $1k ($17k/yr) — positive.
- The deal already cash-flows at list — no discount required.
- Meets the 1% rule at list price ($2k rent vs $105k).
- Recommended offer: $92k (12.0% below list) — sets the bar for market timing.
- Cap rate 32.8% vs local median 3.4% in Mesa — top-decile yield for the area; either an underpriced asset or a hidden risk that comps aren't pricing in. Stress-test before assuming the spread holds.
Location & tenants
- Location reads 79/100 on livability (#6 in AZ, #2,034 nationally) — a middle-class / working-renter tenant base. Strengths: amenities A+, commute A+, housing A+; Watch: health & safety C-, crime D.
- Gilbert Unified District (4239) (suburban): math 49% / reading 52% proficiency, ranked #38 of 249 in AZ (top 15%) — acceptable for families but not a draw, mixed tenant base, ~2y average lease; only 14% free/reduced lunch — higher-income household profile.
- Market conditions: Rents flat; 165 active listings in the ZIP; 4 comparable units currently listed for rent nearby; rentals lingering (median 44d on market — plan ~5-8 weeks vacancy on turnover, expect pricing pressure); 50% of comp listings sitting > 30 days — soft ceiling on asking rent; solid renter incomes; 36,011 units permitted in Maricopa County in 2024 (12,801 in 5+ unit buildings).
- This rent runs 33% of the median local income ($84k/yr) — at the standard rent-burdened threshold; future hikes will face affordability resistance.
Forward outlook
- In year one you build about $1k of equity ($431 loan paydown + $899 appreciation (1.4% local appreciation)).
- Maricopa County population projected at +38% by 2050 — long-run rental-demand tailwind backs the buy-and-hold thesis.
- At projected returns (1.4% appreciation + 0.5% rent growth), your $17k cash investment doubles in ~1 year — after that, you're playing with house money.
Negotiation context
- It's been on market 464 days — a 12% lower offer ($92k) is reasonable based on typical stale-listing flexibility.
Risks & watch-outs
- Climate carrying-cost: extreme-heat days projected 7→20/yr by 2055 (HVAC capex compounding) — expect insurance premiums to compound above CPI over the hold.
Questions for the listing agent
- It's been on market 464 days. Have you received any prior offers? Is the seller open to a 12% concession, seller financing, or rate buy-down credit?
- Why hasn't it sold? Are there any deal-killer items the seller is aware of (foundation, flood, title, zoning, code violations)?
- Is there a deadline driving the sale (1031 exchange, divorce, estate, relocation)? That informs how much negotiation room exists.
- Crime grade is D in this area — have there been break-ins, vandalism, or insurance claims at this property in the last 3 years? What carrier currently insures it and at what premium?
- What's the average days-on-market for RENTAL listings here right now (not sales)? A rising rental-DOM trend means longer vacancies and softer asking-rent achievability than the comps imply.
- What's the recent tenant-quality profile in this submarket — average credit score on applications, eviction rate, late-payment / NSF rate, and stable-employment percentage? A property-management company in the area should have these aggregated.
- How much new for-sale + rental construction is in the pipeline within 1–3 miles? Heavy new supply typically softens prices + rents 12–24 months out; constrained supply supports both.
Investment metrics
- 1% rule
- 3.67% ✓
- Cap rate
- 32.76%
- Cash-on-cash
- 94.53%
- DSCR
- 5.21
- GRM
- 2.3
CMA / ARV
- ARV (median comp)
- $62,423
- List price
- $104,900
- Delta
- 68.05%
- Verdict
- OVERPRICED
- Comps
- 2 within 1.0 mi
Show comp detail 3 sales within ~0.75 mi
| Address | Dist | Beds/Ba | Sqft | Sold | Price | $/sf | Match |
|---|---|---|---|---|---|---|---|
| 8865 E Baseline Rd #1232 | 0.32mi | 2/2.0 | 748 (0%) | 1mo | $96,000 | $128 | 84 |
| 8865 E Baseline Rd #1218 | 0.32mi | 2/2.0 | 748 (0%) | 16mo | $135,000 | $180 | 72 |
| 8865 E Baseline Rd #441 | 0.31mi | 1/1.0 (-1) | 656 (-12%) | 6mo | $29,950 | $46 | 51 |
Match score weights: distance 35% · size 25% · config 20% · recency 20%. Top-matched comps best support the ARV.
Projected returns pro-forma
1.44% appreciation · 0.54% rent growth · sell at horizon
- IRR
- 95.2%
- Equity multiple
- 5.85×
- Total profit
- $84,718
- Equity at exit
- $22,752
- IRR
- 95.1%
- Equity multiple
- 11.22×
- Total profit
- $178,649
- Equity at exit
- $31,384
Cash invested: $17,478 (down + closing). Projections, not guarantees.
Landlord ↔ Tenant lean methodology
- Overall (STATE)
- 87 Strongly Landlord-Friendly
- State Arizona
- 87 Strongly Landlord-Friendly · R+3
- County
- — inherits STATE
- City
- — inherits STATE
ZIP-level market 85209
- Home prices YoY
- 0.5%
- Rents YoY
- 0.5%
- Active inventory
- 165
- Price-to-rent
- 3.8×
Monthly cashflow live
- Estimated rent
- $2,289 medium interval (Pro) →
- Mortgage (P&I)
- −$327
- Tax est. 1.5%
- −$78 /mo · $936/yr
- Insurance
- −$26
- HOA
- −$0
- Vacancy / Maint / Mgmt
- −$481
- Net cashflow
- $1,377
Break-even live
UW: 25.0% down · 7.5% · 30yr · 1.5% tax · 5.0% vac · 8.0% maint · 8.0% mgmt
Financing live
Cash to close
- Down payment
- $15,606
- Closing costs
- $1,873
- Reserves months
- —
- Total cash needed
- —
Loan-product check · same deal, 3 products live
Conventional
25% down · 7.5% · 30yr
- Down + closing
- —
- Monthly P&I
- —
- Monthly cashflow
- —
- DSCR
- —
- Eligible?
- —
Personal DTI + credit; lowest rate.
DSCR
20% down · 8.5% · 30yr
- Down + closing
- —
- Monthly P&I
- —
- Monthly cashflow
- —
- DSCR
- —
- Eligible?
- —
No personal income docs; deal must DSCR.
Hard money
10% down · 12.0% · 12mo
- Down + closing
- —
- Monthly P&I
- —
- Monthly cashflow
- —
- DSCR
- —
- Eligible?
- —
Short-term bridge; refi at stabilization.
Rent comps 4 comps
| Address | Beds | Baths | Sqft | Rent | $/sqft | DOM | Units | Dist |
|---|---|---|---|---|---|---|---|---|
| 8865 E Baseline Rd #405 Mesa, AZ | 2.0 | 1.5 | 619 | $1,900 | $3.07 | 44d | 1 | 0.34mi |
| 8865 E Baseline Rd #1129 Mesa, AZ | 2.0 | 2.0 | 748 | $3,200 | $4.28 | 5d | 1 | 0.34mi |
| 8915 E Guadalupe Rd Mesa, AZ | 1.0 | 1.0 | 616 | $1,164 | $1.89 | 44d | 1 | 0.80mi |
| 8433 E Guadalupe Rd Mesa, AZ | 1.0–3.0 | 1.0–2.0 | 936 | $2,772 | $2.96 | 1d | 1 | 1.15mi |
Listing history 13 events
-
2026-06-18days on market $104,900 Active 464 DOM
-
2026-06-17days on market $104,900 Active 463 DOM
-
2026-06-16days on market $104,900 Active 462 DOM
-
2026-06-15days on market $104,900 Active 461 DOM
-
2026-06-13days on market $104,900 Active 459 DOM
-
2026-06-09days on market $104,900 Active 455 DOM
-
2026-06-08days on market $104,900 Active 454 DOM
-
2026-06-07days on market $104,900 Active 453 DOM
-
2026-06-04days on market $104,900 Active 450 DOM
-
2026-06-03days on market $104,900 Active 449 DOM
-
2026-06-02days on market $104,900 Active 448 DOM
-
2026-06-01days on market $104,900 Active 447 DOM
-
2026-05-31days on market $104,900 Active 446 DOM
ⓘ Source: listings_history table (triggers on properties + properties_extension) + one-shot
backfill from property_details.listing_events for pre-trigger history.
Climate risk First Street
- Flood 1/10 Low FEMA zone X (shaded) · 0% chance over 30 yrs
- Wildfire 4/10 Moderate
- Heat 9/10 Extreme 7 d/yr ≥111°F today · 20 d/yr by 30 yrs out
- Wind 1/10 Low
- Air quality 3/10 Moderate 2 unhealthy d/yr today · 3 by 30 yrs out
Nearby sold comps map
Loading sold comps map…
Walkable amenities ~0.75 mi
Loading nearby amenities…
Taxation est. · year 1
- Rental income
- $27,466
- − Mortgage interest
- −$3,497
- − Property taxes
- −$936
- − Insurance
- −$312
- − Repairs & maintenance
- −$2,197
- − Management
- −$2,197
- − Depreciation
- −$1,816
- Taxable income
- $16,511
- Est. tax owed @ 24.0%
- −$3,963
- After-tax cash flow
- $12,559/yr
For passive investors: Depreciation is non-cash, so a rental often shows a tax loss while cash-flowing — sheltering income. Rental losses are passive: they offset passive income freely, and up to $25,000/yr can offset ordinary (W-2) income if you actively participate and your MAGI is under $100k (phasing out to $0 by $150k); unused losses carry forward. On sale, claimed depreciation is recaptured at up to 25%, and gains may owe capital-gains tax (a 1031 exchange can defer both). Figures are a year-1 estimate at your 24.0% rate — not tax advice; consult a CPA.
Condition & rehab AI · 5 photos
This manufactured home is in good condition with minimal repairs needed. Painting and landscaping improvements can significantly enhance its resale and rental value.
Value-add opportunities
- Both Painting exterior and interior walls — Fresh paint can enhance curb appeal and interior aesthetics
- Both Landscaping improvements — Enhanced landscaping can increase curb appeal and property value
- Both New flooring in bathrooms — Fresh flooring can improve the look and feel of the bathrooms
Renovation cost estimate screening
Value-add ROI direction
- Both Painting exterior and interior walls — Fresh paint can enhance curb appeal and interior aesthetics ↑
- Both Landscaping improvements — Enhanced landscaping can increase curb appeal and property value ↑
- Both New flooring in bathrooms — Fresh flooring can improve the look and feel of the bathrooms ↑
ⓘ Cost ranges are severity-bucket heuristics (US national rule-of-thumb). Get contractor quotes + a written scope before underwriting a rehab budget.
Schools (NCES district)
- District
- Gilbert Unified District (4239)
- NCES district ID
- 0403400
- Math proficiency
- 49% ▼ -8.00%
- Reading proficiency
- 52% ▼ -7.00%
- Median HH income
- $74,715
- Composite
- 45.55/100
- National rank
- #2600
- State rank
- #38 of 249 in AZ
Livability — Mesa
- Score
- 79/100
- State rank
- #6
- US rank
- #2034
Category grades
Schools grade is shown separately in the Schools card above.
Census & demographics
- Census place
- Mesa, AZ
- County
- Maricopa County · 4,537,380 people
- City population
- 555,266
- Metro
- Phoenix-Mesa-Chandler, AZ
- Population (ZIP)
- 43,150
- Household income
- $84,432
- Rent vs Own
- Severe rent burden
- 972.0
Population outlook (Maricopa County) Hauer SSP2
- Today (2025)
- 4,979,203 people
- By 2030
- 5,378,229 · +8.0%
- By 2040
- 6,156,598 · +23.6%
- By 2050
- 6,872,376 · +38.0%
- By 2075
- 8,401,270 · +68.7%
- By 2100
- 9,247,439 · +85.7%
Race, ethnicity, and origin ACS 2023
- Neighborhood character
- Predominantly White (72%)
- Race & ethnicity
- White 72% Hispanic / Latino 15% Two or more races 9% Black 4% Asian 3%
- Hispanic origin (detail)
- Mexican 11%
- Common ancestry
- Portuguese 4% Romanian 3% Lithuanian 3%
- Foreign-born
- 9% · Canada, China, Vietnam
- Languages at home
- 87% English-only · Spanish 9% Tagalog/Filipino 1% Chinese 1%
Political lean MEDSL · Maricopa
- 2024 margin
- Toss-up / Even · D 47.7% · R 51.2% · Other 1.1%
- 2008→2024 swing
- +7.1pp toward D · 2008: -10.6pp · 2024: -3.5pp
- All cycles
- 2024: R+3.5 2020: D+2.2 2016: R+3.5 2012: R+12.0 2008: R+10.6
Not yet ingested
- Civics
- —
Market trends
- HPI YoY
- ▲ 1.44%
- Current HPI
- 277.6198
- Rent YoY
- ▲ 0.54%
- Metro
- Phoenix-Mesa-Chandler, AZ
- State GDP YoY
- ▲ 4.54%
- F500 in state
- 20
Industry mix (Fortune 500 HQ in AZ)
| Industry | F500 HQs | Revenue |
|---|---|---|
| Technology | 2 | $13B |
|
||
| Mining / Metals | 1 | $23B |
|
||
| Environmental Services | 1 | $16B |
|
||
| Metals / Steel | 1 | $14B |
|
||
| Technology Distribution | 1 | $9B |
|
||
| Homebuilding | 1 | $8B |
|
||
Cash-flow waterfall
monthlySold comps — $/sqft
last 12 mo · ≤1 miLoading sold comps…