2809 Butler Manor Dr · Augusta-Richmond County consolidated government (balance), GA
Flood risk 1/10 · Minimal
- FEMA flood zone
- X (unshaded)
- Chance of flooding over 30 yrs
- 0.0%
- Est. flood insurance / yr
- $507 – $1,088
Fire risk 4/10 · Minor
- Est. fire insurance / yr
- $963 – $1,789
Heat risk 7/10 · Major
- Hot days now (above 106°F)
- 7 days/yr
- Hot days in 30 yrs
- 18 days/yr
Wind risk 6/10 · Moderate
- Chance of severe wind over 30 yrs
- 66.0%
Air-quality risk 3/10 · Minor
- Unhealthy air days now
- 3 days/yr
- Unhealthy air days in 30 yrs
- 3 days/yr
Risk factors via First Street. Map © Google.
Why this score? — see what drove the C grade
The composite is a weighted blend of 9 inputs, each scored 0–100. Each bar is that input's sub-score; the figure is the points it added to the 100-point composite (weight × sub-score).
- Cash flow +22.1/30.0
- ARV discount +13.0/15.0
- DSCR +7.1/10.0
- 1% rule +5.6/10.0
- Livability +2.5/5.0
- Condition / age +2.5/5.0
- Rent growth +2.3/5.0
- Schools +1.3/10.0
- Appreciation +0.0/10.0
$144,900
🖨 Deal sheet 📄 Offer letter ✓ Due diligence
Listing remarks MLS
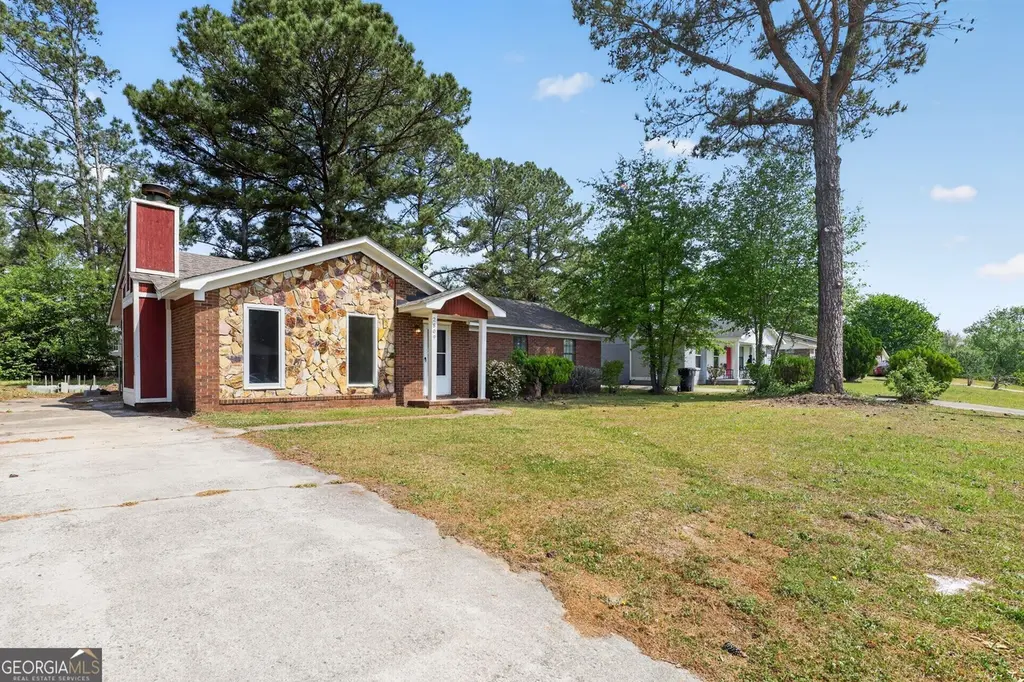
Don't miss out on this spacious, 4-bedroom 2 bath home! You will enjoy a cook-friendly kitchen, dining area and living room. Outside you will find a fenced in yard perfect for entertaining. Make this house your home today!
Key facts
- Fenced in yard
- 9,583 sq ft lot
- Built 1984
Tags
Neighborhood map
What this means for you Summary
Snapshot
- This is a 3-bed/2.0-bath single-family listed at $145k.
Deal economics
- At list price, monthly cash flow is $233 ($3k/yr) — positive.
- The deal already cash-flows at list — no discount required.
- Meets the 1% rule at list price ($2k rent vs $145k).
- Recommended offer: $136k (6.0% below list) — sets the bar for market timing.
- Cap rate 8.2% vs local median 5.3% in Augusta-Richmond County consolidated government (balance) — top-decile yield for the area; either an underpriced asset or a hidden risk that comps aren't pricing in. Stress-test before assuming the spread holds.
Location & tenants
- Location reads: area grade C — affects rentability + tenant quality, not the cash-flow math above.
- Richmond County (urban): math 12% / reading 20% proficiency, ranked #154 of 174 in GA (top 88%) — low school quality limits family demand, transient renter base, plan for 1-2y turnover; 72% free/reduced lunch — lower-income household profile, screen leases tightly.
- Market conditions: Rents soft (-0.7%/yr); 359 active listings in the ZIP; 31 comparable units currently listed for rent nearby; rentals at typical pace (median 23d on market — plan ~3-4 weeks tenant-placement turnaround); 45% of comp listings sitting > 30 days — soft ceiling on asking rent; 561 units permitted in Richmond County in 2024 (0 in 5+ unit buildings).
Forward outlook
- Local home prices are declining (-3.0%/yr); year-one equity from $1k of loan paydown is wiped out by about $4k of value loss. Plan a longer hold.
- Richmond County population projected to shrink 5% by 2050 — rents likely to lag national; underwrite the cash flow, not the appreciation.
Negotiation context
- It's been on market 62 days — a 6% lower offer ($136k) is reasonable based on typical stale-listing flexibility.
- Current owner paid $50k; list at $145k implies a 190% gain — meaningful room to come down on a strong offer.
Risks & watch-outs
- Climate carrying-cost: major wind risk, 66% chance of damaging wind over 30y; extreme-heat days projected 7→18/yr by 2055 (HVAC capex compounding) — expect insurance premiums to compound above CPI over the hold.
Questions for the listing agent
- It's been on market 62 days. Have you received any prior offers? Is the seller open to a 6% concession, seller financing, or rate buy-down credit?
- Why hasn't it sold? Are there any deal-killer items the seller is aware of (foundation, flood, title, zoning, code violations)?
- Is there a deadline driving the sale (1031 exchange, divorce, estate, relocation)? That informs how much negotiation room exists.
- What's the average days-on-market for RENTAL listings here right now (not sales)? A rising rental-DOM trend means longer vacancies and softer asking-rent achievability than the comps imply.
- What's the recent tenant-quality profile in this submarket — average credit score on applications, eviction rate, late-payment / NSF rate, and stable-employment percentage? A property-management company in the area should have these aggregated.
- How much new for-sale + rental construction is in the pipeline within 1–3 miles? Heavy new supply typically softens prices + rents 12–24 months out; constrained supply supports both.
Investment metrics
- 1% rule
- 1.06% ✓
- Cap rate
- 8.22%
- Cash-on-cash
- 6.89%
- DSCR
- 1.31
- GRM
- 7.8
CMA / ARV
- ARV (median comp)
- $164,989
- List price
- $144,900
- Delta
- -12.18%
- Verdict
- UNDERPRICED
- Comps
- 20 within 1.0 mi
Show comp detail 12 sales within ~0.75 mi
| Address | Dist | Beds/Ba | Sqft | Sold | Price | $/sf | Match |
|---|---|---|---|---|---|---|---|
| 2902 Postell Ct | 0.08mi | 3/2.0 | 1,573 (+0%) | 1mo | $203,000 | $129 | 95 |
| 3439 Gebhart Ct | 0.23mi | 3/2.0 | 1,529 (-2%) | 6mo | $135,000 | $88 | 80 |
| 2940 Dahlia Dr | 0.28mi | 3/2.0 | 1,431 (-9%) | 2mo | $170,000 | $119 | 71 |
| 2816 Leawood Court Ct | 0.16mi | 3/2.0 | 1,377 (-12%) | 5mo | $195,000 | $142 | 68 |
| 3406 Pine Hill Rd | 0.56mi | 3/2.0 | 1,623 (+3%) | 1mo | $179,000 | $110 | 67 |
| 3526 Spring Glen Ln | 0.34mi | 4/2.0 (+1) | 1,444 (-8%) | 3mo | $175,000 | $121 | 64 |
| 3005 Griffis Ct | 0.61mi | 3/2.0 | 1,500 (-4%) | 3mo | $125,000 | $83 | 61 |
| 2942 Dahlia Dr | 0.29mi | 4/2.0 (+1) | 1,392 (-11%) | 6mo | $174,000 | $125 | 58 |
| 3007 Meadowbrook Dr | 0.59mi | 4/2.0 (+1) | 1,672 (+7%) | 3mo | $218,000 | $130 | 54 |
| 2804 Sturnidae Ct | 0.66mi | 4/2.0 (+1) | 1,649 (+5%) | 4mo | $189,900 | $115 | 52 |
| 2655 Cranbrook Dr | 0.61mi | 3/2.0 | 1,377 (-12%) | 3mo | $189,900 | $138 | 48 |
| 3042 Johnny Ct | 0.52mi | 3/1.5 | 1,344 (-14%) | 3mo | $165,000 | $123 | 48 |
Match score weights: distance 35% · size 25% · config 20% · recency 20%. Top-matched comps best support the ARV.
Projected returns pro-forma
-3.0% appreciation · 0.0% rent growth · sell at horizon
- IRR
- -9.1%
- Equity multiple
- 0.68×
- Total profit
- $-13,150
- Equity at exit
- $21,605
- IRR
- -4.2%
- Equity multiple
- 0.76×
- Total profit
- $-9,738
- Equity at exit
- $12,528
Cash invested: $40,572 (down + closing). Projections, not guarantees.
Landlord ↔ Tenant lean methodology
- Overall (STATE)
- 90 Strongly Landlord-Friendly
- State Georgia
- 90 Strongly Landlord-Friendly · R+3
- County
- — inherits STATE
- City
- — inherits STATE
ZIP-level market 30815
- Home prices YoY
- -24.2%
- Rents YoY
- -0.7%
- Active inventory
- 359
- Price-to-rent
- 7.8×
Monthly cashflow live
- Estimated rent
- $1,539 high interval (Pro) →
- Mortgage (P&I)
- −$760
- Tax from tax record
- −$163 /mo · $1,953/yr
- Insurance
- −$60
- HOA
- −$0
- Vacancy / Maint / Mgmt
- −$323
- Net cashflow
- $233
Break-even live
UW: 25.0% down · 7.5% · 30yr · 1.5% tax · 5.0% vac · 8.0% maint · 8.0% mgmt
Financing live
Cash to close
- Down payment
- $36,225
- Closing costs
- $4,347
- Reserves months
- —
- Total cash needed
- —
Loan-product check · same deal, 3 products live
Conventional
25% down · 7.5% · 30yr
- Down + closing
- —
- Monthly P&I
- —
- Monthly cashflow
- —
- DSCR
- —
- Eligible?
- —
Personal DTI + credit; lowest rate.
DSCR
20% down · 8.5% · 30yr
- Down + closing
- —
- Monthly P&I
- —
- Monthly cashflow
- —
- DSCR
- —
- Eligible?
- —
No personal income docs; deal must DSCR.
Hard money
10% down · 12.0% · 12mo
- Down + closing
- —
- Monthly P&I
- —
- Monthly cashflow
- —
- DSCR
- —
- Eligible?
- —
Short-term bridge; refi at stabilization.
Rent comps 31 comps
| Address | Beds | Baths | Sqft | Rent | $/sqft | DOM | Units | Dist |
|---|---|---|---|---|---|---|---|---|
| 2813 Leawood Ct Hephzibah, GA | 3.0 | 2.0 | 1377 | $1,250 | $0.91 | 43d | 1 | 0.13mi |
| 3613 Alene Cir Augusta, GA | 3.0 | 2.0 | 1260 | $1,325 | $1.05 | 13d | 1 | 0.37mi |
| 3001 Alene Ct Augusta, GA | 4.0 | 2.0 | 1288 | $1,631 | $1.27 | 23d | 1 | 0.42mi |
| 2727 Barclay St Hephzibah, GA | 4.0 | 2.0 | 1430 | $1,234 | $0.86 | 43d | 1 | 0.57mi |
| 2704 Cranbrook Dr Hephzibah, GA | 3.0 | 2.0 | 1377 | $1,650 | $1.20 | 43d | 1 | 0.67mi |
| 2808 Nighthawk Dr Augusta, GA | 3.0 | 2.0 | 1314 | $1,450 | $1.10 | 43d | 1 | 0.67mi |
| 2914 Cumberland Dr Augusta, GA | 4.0 | 1.5 | 1650 | $1,400 | $0.85 | 21d | 1 | 0.70mi |
| 2941 Rollingwood Dr Augusta, GA | 3.0 | 2.0 | 1297 | $1,750 | $1.35 | 23d | 1 | 0.79mi |
| 2604 Edmonton Ct Hephzibah, GA | 3.0 | 2.0 | 1343 | $1,190 | $0.89 | 13d | 1 | 0.86mi |
| 2834 Brentway Dr Hephzibah, GA | 3.0 | 2.0 | 1475 | $1,600 | $1.08 | 43d | 1 | 0.88mi |
| 3200 Deans Bridge Rd Augusta, GA | 1.0–4.0 | 1.0–1.5 | 1075 | $970 | $0.90 | 23d | 6 | 0.92mi |
| 3504 Osage Ct Augusta, GA | 4.0 | 1.5 | 1425 | $1,556 | $1.09 | 13d | 1 | 0.93mi |
| 3524 Edgeworth Dr Hephzibah, GA | 3.0 | 2.0 | 1200 | $1,295 | $1.08 | 23d | 1 | 0.96mi |
| 3532 Edmonton St Hephzibah, GA | 3.0 | 2.0 | 1377 | $1,425 | $1.03 | 23d | 1 | 0.97mi |
| 3532 Edmonton St Hephzibah, GA | 3.0 | 2.0 | 1377 | $1,425 | $1.03 | 43d | 1 | 0.97mi |
| 3519 Evangeline Dr Augusta, GA | 4.0 | 1.5 | 1800 | $1,595 | $0.89 | 43d | 1 | 0.97mi |
| 2707 Gardenbrook Ct Augusta, GA | 3.0 | 2.0 | 1728 | $1,606 | $0.93 | 43d | 1 | 1.04mi |
| 2631 Drayton Dr Augusta, GA | 3.0 | 2.0 | 1404 | $1,430 | $1.02 | 13d | 1 | 1.04mi |
| 3412 Kensington Dr N Augusta, GA | 3.0 | 2.0 | 1225 | $1,350 | $1.10 | 23d | 1 | 1.11mi |
| 3543 Windermere Dr Hephzibah, GA | 4.0 | 2.0 | 1394 | $1,550 | $1.11 | 23d | 1 | 1.14mi |
| 3543 Windermere Dr Hephzibah, GA | 4.0 | 2.0 | 1394 | $1,550 | $1.11 | 43d | 1 | 1.14mi |
| 2609 Dublin Dr Augusta, GA | 3.0 | 2.0 | 1400 | $1,395 | $1.00 | 13d | 1 | 1.18mi |
| 3528 Woodlake Rd Hephzibah, GA | 3.0 | 2.0 | 1276 | $1,400 | $1.10 | 13d | 1 | 1.26mi |
| 2531 Crosscreek Rd Hephzibah, GA | 3.0 | 2.0 | 1400 | $1,400 | $1.00 | 23d | 1 | 1.28mi |
| 2531 Crosscreek Rd Hephzibah, GA | 3.0 | 2.0 | 1400 | $1,400 | $1.00 | 43d | 1 | 1.28mi |
| 2524 Drayton Dr Augusta, GA | 3.0 | 2.0 | 1404 | $1,700 | $1.21 | 43d | 1 | 1.28mi |
| 2817 Ridgecrest Dr Hephzibah, GA | 4.0 | 2.0 | 1257 | $1,495 | $1.19 | 43d | 1 | 1.30mi |
| 2803 Ptarmigan Rd Hephzibah, GA | 3.0 | 2.0 | 1377 | $1,600 | $1.16 | 23d | 1 | 1.36mi |
| 2803 Ptarmigan Rd Hephzibah, GA | 3.0 | 2.0 | 1400 | $1,600 | $1.14 | 43d | 1 | 1.36mi |
| 3320 Hillis Rd Augusta, GA | 4.0 | 3.0 | 1788 | $1,850 | $1.03 | 13d | 1 | 1.43mi |
| 3517 Byron Pl Augusta, GA | 3.0 | 2.0 | 1300 | $1,350 | $1.04 | 43d | 1 | 1.43mi |
Listing history 17 events
-
2026-06-18days on market $144,900 Active 62 DOM
-
2026-06-17days on market $144,900 Active 61 DOM
-
2026-06-16days on market $144,900 Active 60 DOM
-
2026-06-15days on market $144,900 Active 59 DOM
-
2026-06-14days on market $144,900 Active 57 DOM
-
2026-06-10days on market $144,900 Active 54 DOM
-
2026-06-09statusdays on market $144,900 Active 53 DOM
-
2026-06-08days on market $144,900 Price Change 52 DOM
-
2026-06-07pricestatusdays on market $144,900 Price Change 51 DOM
-
2026-06-03days on market $159,900 Active 47 DOM
-
2026-06-02days on market $159,900 Active 46 DOM
-
2026-06-01days on market $159,900 Active 45 DOM
-
2026-05-31days on market $159,900 Active 44 DOM
-
2026-05-30days on market $159,900 Active 43 DOM
-
2026-04-17$159,900 New 222-char remark
Show marketing remark (222 chars)
Don't miss out on this spacious, 4-bedroom 2 bath home! You will enjoy a cook-friendly kitchen, dining area and living room. Outside you will find a fenced in yard perfect for entertaining. Make this house your home today!
-
2018-02-22soldstatus $50,000
-
1984-11-01soldstatus $57,900
ⓘ Source: listings_history table (triggers on properties + properties_extension) + one-shot
backfill from property_details.listing_events for pre-trigger history.
Tax reassessment forecast GA · Resets to sale price
- Current annual tax
- $1,953 · $163/mo
- Projected year-2 tax
- $1,953 · $163/mo
- Expected delta
- $0/yr ($0/mo · 0.0%)
ⓘ Screening estimate from a state-policy table — verify with the county assessor before closing.
Climate risk First Street
- Flood 1/10 Low FEMA zone X (unshaded) · 0% chance over 30 yrs
- Wildfire 4/10 Moderate
- Heat 7/10 Severe 7 d/yr ≥106°F today · 18 d/yr by 30 yrs out
- Wind 6/10 Major 66% chance of damaging wind over 30 yrs
- Air quality 3/10 Moderate 3 unhealthy d/yr today · 3 by 30 yrs out
Nearby sold comps map
Loading sold comps map…
Walkable amenities ~0.75 mi
Loading nearby amenities…
Taxation est. · year 1
- Rental income
- $18,468
- − Mortgage interest
- −$8,117
- − Property taxes
- −$1,953
- − Insurance
- −$724
- − Repairs & maintenance
- −$1,477
- − Management
- −$1,477
- − Depreciation
- −$4,215
- Taxable income
- $504
- Est. tax owed @ 24.0%
- −$121
- After-tax cash flow
- $2,673/yr
For passive investors: Depreciation is non-cash, so a rental often shows a tax loss while cash-flowing — sheltering income. Rental losses are passive: they offset passive income freely, and up to $25,000/yr can offset ordinary (W-2) income if you actively participate and your MAGI is under $100k (phasing out to $0 by $150k); unused losses carry forward. On sale, claimed depreciation is recaptured at up to 25%, and gains may owe capital-gains tax (a 1031 exchange can defer both). Figures are a year-1 estimate at your 24.0% rate — not tax advice; consult a CPA.
Schools (NCES district)
- District
- Richmond County
- NCES district ID
- 1304380
- Math proficiency
- 12% ▼ -9.00%
- Reading proficiency
- 20% ▼ -6.00%
- Median HH income
- $38,069
- Composite
- 13.43/100
- National rank
- #9524
- State rank
- #154 of 174 in GA
Livability — Augusta-Richmond County consolidated government (balance)
No livability data for this city. (Only ~50 U.S. cities are tracked.)
Census & demographics
- Census place
- Augusta-Richmond County consolidated government (balance), GA
- County
- Richmond County · 190,917 people
- City population
- 154,035
- Metro
- Augusta-Richmond County, GA-SC
- Population (ZIP)
- 44,109
- Household income
- $70,202
- Rent vs Own
- Severe rent burden
- 867.0
Population outlook (Richmond County) Hauer SSP2
- Today (2025)
- 200,753 people
- By 2030
- 200,232 · -0.3%
- By 2040
- 196,813 · -2.0%
- By 2050
- 190,347 · -5.2%
- By 2075
- 172,496 · -14.1%
- By 2100
- 146,284 · -27.1%
Race, ethnicity, and origin ACS 2023
- Neighborhood character
- Majority Black (62%)
- Race & ethnicity
- Black 62% White 27% Two or more races 5% Hispanic / Latino 4%
- Foreign-born
- 4% · Canada, South Korea
- Languages at home
- 93% English-only · Spanish 3% Other Indo-European 1% Korean 1%
Political lean MEDSL · Richmond
- 2024 margin
- Solid D (+36.1) · D 67.8% · R 31.7%
- 2008→2024 swing
- +4.3pp toward D · 2008: 31.8pp · 2024: 36.1pp
- All cycles
- 2024: D+36.1 2020: D+37.2 2016: D+32.4 2012: D+33.8 2008: D+31.8
Not yet ingested
- Civics
- —
Market trends
- HPI YoY
- ▼ -51.74%
- Current HPI
- 162.4074
- Rent YoY
- ▼ -0.71%
- Metro
- Augusta-Richmond County, GA-SC
- State GDP YoY
- ▲ 2.66%
- F500 in state
- 28
Industry mix (Fortune 500 HQ in GA)
| Industry | F500 HQs | Revenue |
|---|---|---|
| Paper / Packaging | 2 | $29B |
|
||
| Retail | 1 | $160B |
|
||
| Transportation / Logistics | 1 | $91B |
|
||
| Airlines | 1 | $62B |
|
||
| Consumer Goods | 1 | $47B |
|
||
| Utilities | 1 | $25B |
|
||
Price history
+176.2% since first listed3 events — show timeline
- 2026-04-17 Listed $159,900 GAMLS
- 2018-02-22 Sold (Public Records) $50,000 Public Records
- 1984-11-01 Sold (Public Records) $57,900 Public Records
Property tax history
+3.5%/yrLatest (2025): $1,953 · +3.2% YoY. Source: county tax records.
Cash-flow waterfall
monthlySold comps — $/sqft
last 12 mo · ≤1 miLoading sold comps…