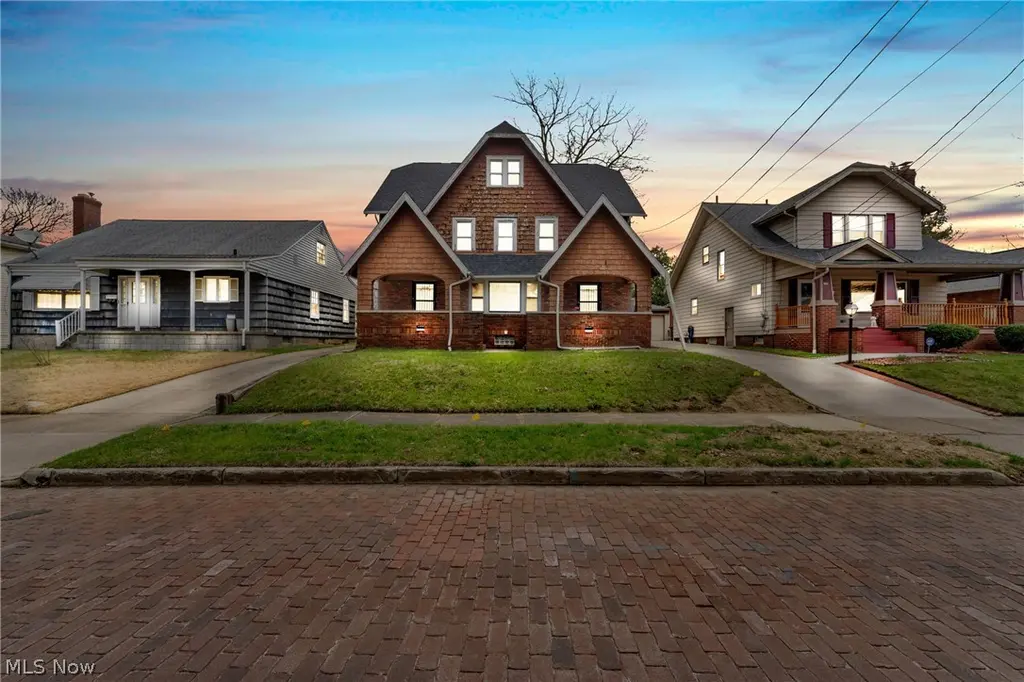
 Triplex
967 Oakland Ave · Akron, OH
Flood risk 1/10 · Minimal
- FEMA flood zone
- X (unshaded)
- Chance of flooding over 30 yrs
- 0.0%
- Est. flood insurance / yr
- $473 – $860
Fire risk 1/10 · Minimal
- Est. fire insurance / yr
- $713 – $1,323
Heat risk 3/10 · Minor
- Hot days now (above 97°F)
- 7 days/yr
- Hot days in 30 yrs
- 17 days/yr
Wind risk 1/10 · Minimal
- Chance of severe wind over 30 yrs
- —
Air-quality risk 3/10 · Minor
- Unhealthy air days now
- 2 days/yr
- Unhealthy air days in 30 yrs
- 4 days/yr
Risk factors via First Street. Map © Google.
Why this score? — see what drove the C grade
The composite is a weighted blend of 9 inputs, each scored 0–100. Each bar is that input's sub-score; the figure is the points it added to the 100-point composite (weight × sub-score).
- Cash flow +27.3/30.0
- DSCR +9.5/10.0
- 1% rule +7.1/10.0
- Livability +4.0/5.0
- Rent growth +3.7/5.0
- Condition / age +2.5/5.0
- Schools +2.1/10.0
- ARV discount +0.0/15.0
- Appreciation +0.0/10.0
$265,000
🖨 Deal sheet 📄 Offer letter ✓ Due diligence
Multi-family units
County records classify this as Multi-Family (2-4 Unit). Listing-text estimate: 3 units. confirmed
Listing remarks MLS
Here's an opportunity to add an income producing property to you your portfolio. Three stories each with their own full bathroom, full kitchen, hardwood floors, plus a 2-car garage, extra parking and an enormous amount of potential!
Key facts
- Fully renovated
- Modern finishes
- Brand-new appliances
Tags
Property features AI
Exterior
- Parking: Detached garage; 2 garage spaces
- Utilities: Public water; Public sewer
- Home design: Multifamily building with 1 building
- Construction: Asphalt roof; Year built per public records
- Exterior features: Lot recorded at approximately 0.1263 acres
Interior
- Kitchen: Range; Refrigerator; Full kitchens in units
- Bedrooms: One-bedroom third-floor unit with full kitchen; Three-bedroom second-floor unit (vacant); Three-bedroom first-floor unit (down)
- Bathrooms: Three full bathrooms total; Each listed unit includes one full bathroom
- Heating & cooling: Hot water heating; Steam heating; Heating present
- Interior features: Common basement; 15 total rooms
Neighborhood map
What this means for you Summary
Snapshot
- This is a 2×3bd/1.0ba + 1×2bd/1.0ba units multifamily listed at $265k.
Deal economics
- At list price, monthly cash flow is $770 ($9k/yr) — positive. Per door: $257/mo.
- The deal already cash-flows at list — no discount required.
- Meets the 1% rule at list price ($3k rent vs $265k).
- Recommended offer: $257k (3.0% below list) — sets the bar for market timing.
- Cap rate 9.8% vs local median 6.6% in Akron — top-decile yield for the area; either an underpriced asset or a hidden risk that comps aren't pricing in. Stress-test before assuming the spread holds.
Location & tenants
- Location reads 81/100 on livability (#104 in OH, #1,591 nationally) — a professional / high-income tenant draw. Strengths: amenities A+, commute A+, cost of living A+; Watch: crime F, employment F.
- Akron City (urban): math 22% / reading 30% proficiency, ranked #602 of 656 in OH (top 92%) — low school quality limits family demand, transient renter base, plan for 1-2y turnover; 66% free/reduced lunch — lower-income household profile, screen leases tightly.
- Market conditions: Rents rising fast (+4.8%/yr); 86 active listings in the ZIP; lower-income renter base — watch delinquency; 1,114 units permitted in Summit County in 2024 (397 in 5+ unit buildings).
- At $3,195/mo this rent would consume 93% of the median local household income ($41k/yr) (locally 2058% of renters already pay >50% of income on rent) — very limited rent-growth headroom before tenants either downsize or default.
Forward outlook
- Local home prices are declining (-3.0%/yr); year-one equity from $2k of loan paydown is wiped out by about $8k of value loss. Plan a longer hold.
- Summit County population projected to shrink 6% by 2050 — rents likely to lag national; underwrite the cash flow, not the appreciation.
- At projected returns (-3.0% appreciation + 4.8% rent growth), your $74k cash investment doubles in ~8 years — after that, you're playing with house money.
Negotiation context
- It's been on market 33 days — a 3% lower offer ($257k) is reasonable based on typical stale-listing flexibility.
- 4 sale attempts since 18y ago with the ask held roughly flat each time — persistent listings suggest the price (not the market) is what's stuck; bring a comps-based counter.
- Current owner paid $93k; list at $265k implies a 185% gain — meaningful room to come down on a strong offer.
Risks & watch-outs
- Watch-outs: built in 1928 — expect roof / HVAC / electrical / plumbing capex.
Questions for the listing agent
- It's been on market 33 days. Have you received any prior offers? Is the seller open to a 3% concession, seller financing, or rate buy-down credit?
- Can we see the unit-by-unit rent roll, current vacancy, and any below-market leases? What's the average tenancy length?
- What capital expenditures (roof, boiler, parking lot, exteriors) have been made in the last 5 years, and what's planned in the next 2?
- Built in 1928 — when were the roof, HVAC, electrical panel, plumbing, and water heater last replaced?
- Is there a deadline driving the sale (1031 exchange, divorce, estate, relocation)? That informs how much negotiation room exists.
- Crime grade is F in this area — have there been break-ins, vandalism, or insurance claims at this property in the last 3 years? What carrier currently insures it and at what premium?
- What's the average days-on-market for RENTAL listings here right now (not sales)? A rising rental-DOM trend means longer vacancies and softer asking-rent achievability than the comps imply.
- What's the recent tenant-quality profile in this submarket — average credit score on applications, eviction rate, late-payment / NSF rate, and stable-employment percentage? A property-management company in the area should have these aggregated.
- How much new apartment / multifamily construction is in the pipeline within 1–3 miles? Heavy new supply (>2% of stock underway) typically softens rents 12–24 months out; light construction supports rent growth.
Investment metrics
- 1% rule
- 1.21% ✓
- Cap rate
- 9.78%
- Cash-on-cash
- 12.46%
- DSCR
- 1.55
- GRM
- 6.9
CMA / ARV
- ARV (on-the-fly)
- $200,739
- Comps found
- 3
Show comp detail 3 sales within ~0.75 mi
| Address | Dist | Beds/Ba | Sqft | Sold | Price | $/sf | Match |
|---|---|---|---|---|---|---|---|
| 967 Oakland Ave | 0.00mi | 7/3.0 | 2,607 (0%) | 1mo | $265,000 | $102 | 96 |
| 905-907 Berwin St | 0.19mi | 6/2.0 (-1) | 2,638 (+1%) | 20mo | $203,000 | $77 | 68 |
| 716-718 Carpenter St | 0.73mi | 7/2.0 | 2,326 (-11%) | 12mo | $163,500 | $70 | 38 |
Match score weights: distance 35% · size 25% · config 20% · recency 20%. Top-matched comps best support the ARV.
Projected returns pro-forma
-3.0% appreciation · 4.82% rent growth · sell at horizon
- IRR
- 4.1%
- Equity multiple
- 1.16×
- Total profit
- $12,079
- Equity at exit
- $39,512
- IRR
- 15.2%
- Equity multiple
- 2.34×
- Total profit
- $99,067
- Equity at exit
- $22,912
Cash invested: $74,200 (down + closing). Projections, not guarantees.
Landlord ↔ Tenant lean methodology
- Overall (STATE)
- 73 Landlord-Friendly
- State Ohio
- 73 Landlord-Friendly · R+6
- County
- — inherits STATE
- City
- — inherits STATE
ZIP-level market 44310
- Rents YoY
- 4.8%
- Active inventory
- 86
- Price-to-rent
- 19.9×
Monthly cashflow live
- Estimated rent
- $3,195 high interval (Pro) →
- Mortgage (P&I)
- −$1,390
- Tax from tax record
- −$254 /mo · $3,043/yr
- Insurance
- −$110
- HOA
- −$0
- Vacancy / Maint / Mgmt
- −$671
- Net cashflow
- $770
Break-even live
3-unit breakdown (identical units grouped — click to expand)
| Units | Beds | Baths | Est. rent |
|---|---|---|---|
| 2× units | 3 | 1 | $2,216 |
| #1 | 3 | 1 | $1,108 |
| #2 | 3 | 1 | $1,108 |
| 1× unit | 2 | 1 | $980 |
| Total (3 units) | $3,195 | ||
UW: 25.0% down · 7.5% · 30yr · 1.5% tax · 5.0% vac · 8.0% maint · 8.0% mgmt
Financing live
Cash to close
- Down payment
- $66,250
- Closing costs
- $7,950
- Reserves months
- —
- Total cash needed
- —
Loan-product check · same deal, 3 products live
Conventional
25% down · 7.5% · 30yr
- Down + closing
- —
- Monthly P&I
- —
- Monthly cashflow
- —
- DSCR
- —
- Eligible?
- —
Personal DTI + credit; lowest rate.
DSCR
20% down · 8.5% · 30yr
- Down + closing
- —
- Monthly P&I
- —
- Monthly cashflow
- —
- DSCR
- —
- Eligible?
- —
No personal income docs; deal must DSCR.
Hard money
10% down · 12.0% · 12mo
- Down + closing
- —
- Monthly P&I
- —
- Monthly cashflow
- —
- DSCR
- —
- Eligible?
- —
Short-term bridge; refi at stabilization.
Listing history 14 events
-
2026-05-04historical $1,250
-
2026-04-30status Pending
-
2026-04-13historical Contingent
-
2026-03-27$265,000 Active
-
2026-03-13soldstatus $93,000 Closed 232-char remark
Show marketing remark (232 chars)
Here's an opportunity to add an income producing property to you your portfolio. Three stories each with their own full bathroom, full kitchen, hardwood floors, plus a 2-car garage, extra parking and an enormous amount of potential!
-
2026-02-22$1,250
-
2025-05-06status Pending 232-char remark
Show marketing remark (232 chars)
Here's an opportunity to add an income producing property to you your portfolio. Three stories each with their own full bathroom, full kitchen, hardwood floors, plus a 2-car garage, extra parking and an enormous amount of potential!
-
2025-05-05historical 232-char remark
Show marketing remark (232 chars)
Here's an opportunity to add an income producing property to you your portfolio. Three stories each with their own full bathroom, full kitchen, hardwood floors, plus a 2-car garage, extra parking and an enormous amount of potential!
-
2025-04-23$94,900 Active 232-char remark
Show marketing remark (232 chars)
Here's an opportunity to add an income producing property to you your portfolio. Three stories each with their own full bathroom, full kitchen, hardwood floors, plus a 2-car garage, extra parking and an enormous amount of potential!
-
2008-10-03soldstatus $113,800
Show marketing remark (378 chars)
Attractive Brick & Cedar Duplex Large living with firplace, formal dining room plus nook. 1st floor unit has 2 bedrms Second floor unit can be combined with the third floor unit to make 4 bedrms. Extra parking plus 2 car garage. Full basement with 2 boilers & 2 hot water tanks, updated electric. Replacement vinyl windows, copper plumbing 2 set of laundry hook ups.
-
2008-10-03soldstatus $113,800 378-char remark
Show marketing remark (378 chars)
Attractive Brick & Cedar Duplex Large living with firplace, formal dining room plus nook. 1st floor unit has 2 bedrms Second floor unit can be combined with the third floor unit to make 4 bedrms. Extra parking plus 2 car garage. Full basement with 2 boilers & 2 hot water tanks, updated electric. Replacement vinyl windows, copper plumbing 2 set of laundry hook ups.
-
2008-08-22$119,900 378-char remark
Show marketing remark (378 chars)
Attractive Brick & Cedar Duplex Large living with firplace, formal dining room plus nook. 1st floor unit has 2 bedrms Second floor unit can be combined with the third floor unit to make 4 bedrms. Extra parking plus 2 car garage. Full basement with 2 boilers & 2 hot water tanks, updated electric. Replacement vinyl windows, copper plumbing 2 set of laundry hook ups.
-
1985-04-30soldstatus $30,000
-
1985-03-15soldstatus $30,000
ⓘ Source: listings_history table (triggers on properties + properties_extension) + one-shot
backfill from property_details.listing_events for pre-trigger history.
Tax reassessment forecast OH · Partial reset (capped growth)
- Current annual tax
- $3,043 · $254/mo
- Projected year-2 tax
- $3,589 · $299/mo
- Expected delta
- +$545/yr (+$45/mo · 17.9%)
ⓘ Screening estimate from a state-policy table — verify with the county assessor before closing.
Climate risk First Street
- Flood 1/10 Low FEMA zone X (unshaded) · 0% chance over 30 yrs
- Wildfire 1/10 Low
- Heat 3/10 Moderate 7 d/yr ≥97°F today · 17 d/yr by 30 yrs out
- Wind 1/10 Low
- Air quality 3/10 Moderate 2 unhealthy d/yr today · 4 by 30 yrs out
Nearby sold comps map
Loading sold comps map…
Walkable amenities ~0.75 mi
Loading nearby amenities…
Taxation est. · year 1
- Rental income
- $38,340
- − Mortgage interest
- −$14,844
- − Property taxes
- −$3,043
- − Insurance
- −$1,325
- − Repairs & maintenance
- −$3,067
- − Management
- −$3,067
- − Depreciation
- −$7,709
- Taxable income
- $5,284
- Est. tax owed @ 24.0%
- −$1,268
- After-tax cash flow
- $7,976/yr
For passive investors: Depreciation is non-cash, so a rental often shows a tax loss while cash-flowing — sheltering income. Rental losses are passive: they offset passive income freely, and up to $25,000/yr can offset ordinary (W-2) income if you actively participate and your MAGI is under $100k (phasing out to $0 by $150k); unused losses carry forward. On sale, claimed depreciation is recaptured at up to 25%, and gains may owe capital-gains tax (a 1031 exchange can defer both). Figures are a year-1 estimate at your 24.0% rate — not tax advice; consult a CPA.
Schools (NCES district)
- District
- Akron City
- NCES district ID
- 3904348
- Math proficiency
- 22% ▼ -17.00%
- Reading proficiency
- 30% ▼ -12.00%
- Median HH income
- $33,811
- Composite
- 21.31/100
- National rank
- #8383
- State rank
- #602 of 656 in OH
Livability — Akron
- Score
- 81/100
- State rank
- #104
- US rank
- #1591
Category grades
Schools grade is shown separately in the Schools card above.
Census & demographics
- Census place
- Akron, OH
- County
- Summit County · 440,783 people
- City population
- 174,375
- Metro
- Akron, OH
- Population (ZIP)
- 25,496
- Household income
- $41,066
- Rent vs Own
- Severe rent burden
- 2058.0
Population outlook (Summit County) Hauer SSP2
- Today (2025)
- 546,583 people
- By 2030
- 544,028 · -0.5%
- By 2040
- 531,363 · -2.8%
- By 2050
- 514,923 · -5.8%
- By 2075
- 481,765 · -11.9%
- By 2100
- 432,265 · -20.9%
Race, ethnicity, and origin ACS 2023
- Neighborhood character
- Highly diverse neighborhood (Simpson 0.73)
- Race & ethnicity
- White 40% Black 25% Asian 20% Hispanic / Latino 10% Two or more races 9%
- Hispanic origin (detail)
- Mexican 6% Puerto Rican 2%
- Common ancestry
- Romanian 2% Slovak 1% Italian 1%
- Foreign-born
- 25% · Canada, India, Philippines
- Languages at home
- 69% English-only · Other Indo-European 13% Spanish 7% Other Asian/Pacific 6%
Political lean MEDSL · Summit
- 2024 margin
- Lean D (+7.0) · D 53.0% · R 46.0%
- 2008→2024 swing
- -9.6pp toward R · 2008: 16.6pp · 2024: 7.0pp
- All cycles
- 2024: D+7.0 2020: D+9.6 2016: D+8.2 2012: D+14.8 2008: D+16.6
Not yet ingested
- Civics
- —
Market trends
- HPI YoY
- ▼ -194.41%
- Current HPI
- 203.4431
- Rent YoY
- ▲ 4.82%
- Metro
- Akron, OH
- State GDP YoY
- ▲ 1.98%
- F500 in state
- 48
Industry mix (Fortune 500 HQ in OH)
| Industry | F500 HQs | Revenue |
|---|---|---|
| Insurance | 3 | $145B |
|
||
| Industrial Machinery | 3 | $49B |
|
||
| Financial Services | 3 | $24B |
|
||
| Consumer Goods | 2 | $93B |
|
||
| Aerospace / Defense | 2 | $47B |
|
||
| Utilities | 2 | $33B |
|
||
Price history
-95.8% since first listed14 events — show timeline
- 2026-05-04 Rental Removed $1,250 APPFOLIO
- 2026-04-30 Pending — MLSNOW
- 2026-04-13 Contingent — MLSNOW
- 2026-03-27 Listed $265,000 MLSNOW
- 2026-03-13 Sold (MLS) $93,000 MLSNOW
- 2026-02-22 Listed for Rent $1,250 APPFOLIO
- 2025-05-06 Pending — MLSNOW
- 2025-05-05 Listing Removed — MLSNOW
- 2025-04-23 Listed $94,900 MLSNOW
- 2008-10-03 Sold (Public Records) $113,800 Public Records
- 2008-10-03 Sold (MLS) $113,800 MLSNOW
- 2008-08-22 Listed $119,900 MLSNOW
- 1985-04-30 Sold (Public Records) $30,000 Public Records
- 1985-03-15 Sold (Public Records) $30,000 Public Records
Property tax history
+2.9%/yrLatest (2025): $3,043 · -3.0% YoY. Source: county tax records.
Cash-flow waterfall
monthlySold comps — $/sqft
last 12 mo · ≤1 miLoading sold comps…