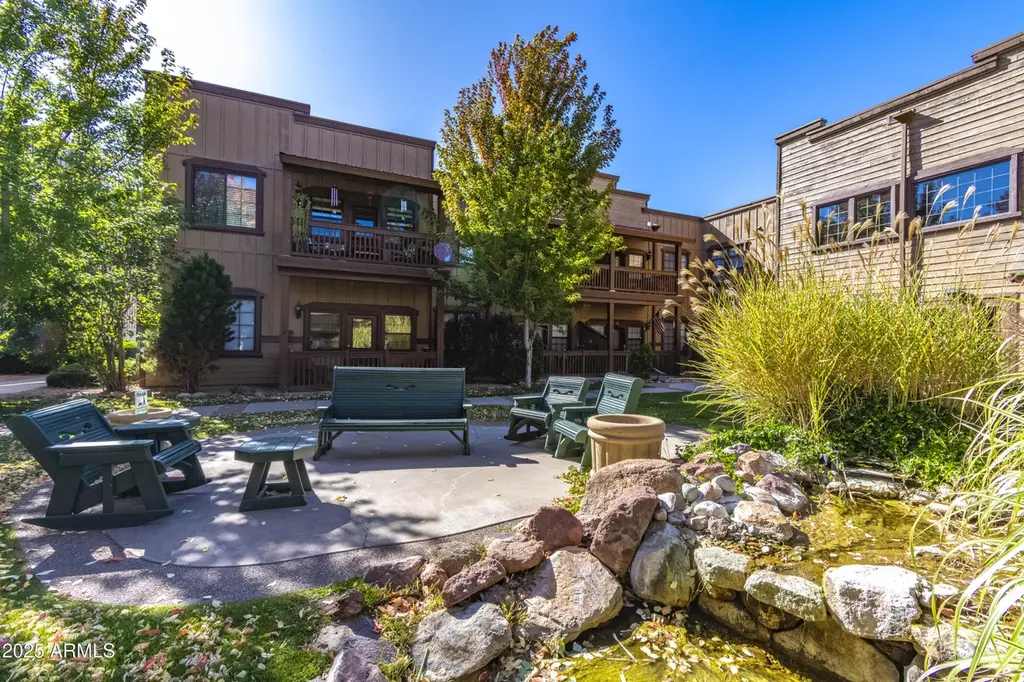
2353 Quarter Horse Trl #238 · Heber-Overgaard, AZ
Flood risk 1/10 · Minimal
- FEMA flood zone
- X (unshaded)
- Chance of flooding over 30 yrs
- 0.0%
- Est. flood insurance / yr
- $507 – $1,088
Fire risk 7/10 · Major
- Est. fire insurance / yr
- $610 – $1,132
Heat risk 2/10 · Minimal
- Hot days now (above 87°F)
- 7 days/yr
- Hot days in 30 yrs
- 19 days/yr
Wind risk 1/10 · Minimal
- Chance of severe wind over 30 yrs
- —
Air-quality risk 1/10 · Minimal
- Unhealthy air days now
- 0 days/yr
- Unhealthy air days in 30 yrs
- 0 days/yr
Risk factors via First Street. Map © Google.
Why this score? — see what drove the C grade
The composite is a weighted blend of 9 inputs, each scored 0–100. Each bar is that input's sub-score; the figure is the points it added to the 100-point composite (weight × sub-score).
- Cash flow +22.9/30.0
- 1% rule +9.1/10.0
- ARV discount +7.5/15.0
- DSCR +7.4/10.0
- Schools +4.0/10.0
- Condition / age +3.8/5.0
- Rent growth +2.5/5.0
- Livability +2.5/5.0
- Appreciation +0.0/10.0
$135,000
🖨 Deal sheet (PDF) 📄 Offer letter ✓ Due diligence
Listing remarks MLS
Stunning 2 bed/ 1 bath condo.. Amazing upgrades to this incredible, single story, 2 bed/ 1 bath condo that is just a quick walk to shops or drive to Show Low! As you enter this light filled condo you will love the open floorplan and incredible windows with views of pine trees and mountains! Upgraded kitchen with neutral cabinetry and stainless steel refrigerator, tile floors, ceiling fans throughout, washer/ dryer on site, upgraded lighting fixtures. Beautiful bathroom w/ designer finishes and nice tile! Neutral indoor and outdoor paint. Condo sits close to Hwy 260! The indoor/ outdoor living is ideal from this sunny/ covered patio. Stroll to downtown - enjoy hiking trails and parks. Access to incredible amenities at Bison Ranch Community!
Key facts
- Tile floors
- Ceiling fans
- Upgraded kitchen
Tags
Neighborhood map
What this means for you Summary
Snapshot
- This is a 2-bed/1.0-bath single-family listed at $135k. Condition is rated good.
Deal economics
- At list price, monthly cash flow is $238 ($3k/yr) — positive.
- The deal already cash-flows at list — no discount required.
- Meets the 1% rule at list price ($2k rent vs $135k).
- Recommended offer: $119k (12.0% below list) — sets the bar for market timing.
- Cap rate 8.4% vs local median 3.2% in Heber-Overgaard — top-decile yield for the area; either an underpriced asset or a hidden risk that comps aren't pricing in. Stress-test before assuming the spread holds.
Location & tenants
- Location reads: area grade C — affects rentability + tenant quality, not the cash-flow math above.
- Heber-Overgaard Unified District (4392) (rural): math 52% / reading 45% proficiency, ranked #51 of 249 in AZ (top 20%) — families likely to look elsewhere, expect single-tenant / working-renter base with shorter leases.
- Market conditions: 258 active listings in the ZIP; 1 comparable units currently listed for rent nearby; 485 units permitted in Navajo County in 2024 (11 in 5+ unit buildings).
Forward outlook
- Local home prices are declining (-3.0%/yr); year-one equity from $933 of loan paydown is wiped out by about $4k of value loss. Plan a longer hold.
- Navajo County population projected at -16% by 2050 — secular population decline; favor cash flow + early exit over multi-decade hold.
Negotiation context
- It's been on market 166 days — a 12% lower offer ($119k) is reasonable based on typical stale-listing flexibility.
- 6 sale attempts since 3y ago; this cycle's ask has dropped $10k (7%) from the opening price — seller is motivated, your offer sets the floor, not the list.
Risks & watch-outs
- Climate carrying-cost: major wildfire risk — expect insurance premiums to compound above CPI over the hold.
Questions for the listing agent
- It's been on market 166 days. Have you received any prior offers? Is the seller open to a 12% concession, seller financing, or rate buy-down credit?
- What does the HOA fee cover, when was the last increase, and are there any pending special assessments or reserve-fund shortfalls?
- Why hasn't it sold? Are there any deal-killer items the seller is aware of (foundation, flood, title, zoning, code violations)?
- Is there a deadline driving the sale (1031 exchange, divorce, estate, relocation)? That informs how much negotiation room exists.
- What's the average days-on-market for RENTAL listings here right now (not sales)? A rising rental-DOM trend means longer vacancies and softer asking-rent achievability than the comps imply.
- What's the recent tenant-quality profile in this submarket — average credit score on applications, eviction rate, late-payment / NSF rate, and stable-employment percentage? A property-management company in the area should have these aggregated.
- How much new for-sale + rental construction is in the pipeline within 1–3 miles? Heavy new supply typically softens prices + rents 12–24 months out; constrained supply supports both.
Investment metrics
- 1% rule
- 1.41% ✓
- Cap rate
- 8.41%
- Cash-on-cash
- 7.56%
- DSCR
- 1.34
- GRM
- 5.9
CMA / ARV
- ARV (median comp)
- $315,600
- List price
- $135,000
- Delta
- -57.22%
- Verdict
- UNDERPRICED
- Comps
- 20 within 1.0 mi
Show comp detail 12 sales within ~0.75 mi
| Address | Dist | Beds/Ba | Sqft | Sold | Price | $/sf | Match |
|---|---|---|---|---|---|---|---|
| 2336 Buffalo Loop Unit North | 0.07mi | 2/1.0 | 840 (+2%) | 20mo | $300,000 | $357 | 76 |
| 2336 Buffalo Loop N | 0.07mi | 2/1.0 | 840 (+2%) | 20mo | $300,000 | $357 | 76 |
| 2342 Buffalo Loop Unit North | 0.05mi | 2/1.0 | 840 (+2%) | 22mo | $319,500 | $380 | 76 |
| 2335 S Buffalo Loop | 0.14mi | 2/1.0 | 840 (+2%) | 21mo | $319,000 | $380 | 72 |
| 2755 Fox Trl | 0.26mi | 2/1.0 | 750 (-8%) | 4mo | $298,000 | $397 | 70 |
| 2747 Beaver Trl | 0.31mi | 1/1.0 (-1) | 750 (-8%) | 10mo | $285,000 | $380 | 58 |
| 2711 High Pine Loop | 0.26mi | 2/2.0 | 936 (+14%) | 9mo | $336,000 | $359 | 53 |
| 2323 S Buffalo Loop S | 0.14mi | 2/2.0 | 936 (+14%) | 18mo | $374,900 | $401 | 51 |
| 2649 Palomino Trl | 0.30mi | 2/2.0 | 936 (+14%) | 10mo | $369,900 | $395 | 50 |
| 2323 S Buffalo Loop Unit S | 0.16mi | 2/2.0 | 936 (+14%) | 18mo | $374,900 | $401 | 50 |
| 2646 Lodge Loop | 0.26mi | 2/2.0 | 936 (+14%) | 14mo | $320,000 | $342 | 48 |
| 2722 High Pine Loop | 0.28mi | 2/2.0 | 936 (+14%) | 16mo | $375,000 | $401 | 45 |
Match score weights: distance 35% · size 25% · config 20% · recency 20%. Top-matched comps best support the ARV.
Projected returns pro-forma
-3.0% appreciation · 3.0% rent growth · sell at horizon
- IRR
- -4.6%
- Equity multiple
- 0.83×
- Total profit
- $-6,470
- Equity at exit
- $20,129
- IRR
- 5.3%
- Equity multiple
- 1.39×
- Total profit
- $14,843
- Equity at exit
- $11,672
Cash invested: $37,800 (down + closing). Projections, not guarantees.
Landlord ↔ Tenant lean methodology
- Overall (STATE)
- 87 Strongly Landlord-Friendly
- State Arizona
- 87 Strongly Landlord-Friendly · R+3
- County
- — inherits STATE
- City
- — inherits STATE
ZIP-level market 85933
- Home prices YoY
- -18.9%
- Active inventory
- 258
- Price-to-rent
- 5.9×
Monthly cashflow live
- Estimated rent
- $1,899 medium interval (Pro) →
- Mortgage (P&I)
- −$708
- Tax est. 1.5%
- −$169 /mo · $2,025/yr
- Insurance
- −$56
- HOA
- −$329
- Vacancy / Maint / Mgmt
- −$399
- Net cashflow
- $238
Break-even live
Sensitivity live
| Price | -10% $332 | -5% $285 | +0% $238 | +5% $192 | +10% $145 |
|---|---|---|---|---|---|
| Rent | -10% $88 | -5% $163 | +0% $238 | +5% $313 | +10% $388 |
| Rate | -1.0pp $306 | -0.5pp $273 | base $238 | +0.5pp $203 | +1.0pp $168 |
UW: 25.0% down · 7.5% · 30yr · 1.5% tax · 5.0% vac · 8.0% maint · 8.0% mgmt
Financing live
Cash to close
- Down payment
- $33,750
- Closing costs
- $4,050
- Reserves months
- —
- Total cash needed
- —
Loan-product check · same deal, 3 products live
Conventional
25% down · 7.5% · 30yr
- Down + closing
- —
- Monthly P&I
- —
- Monthly cashflow
- —
- DSCR
- —
- Eligible?
- —
Personal DTI + credit; lowest rate.
DSCR
20% down · 8.5% · 30yr
- Down + closing
- —
- Monthly P&I
- —
- Monthly cashflow
- —
- DSCR
- —
- Eligible?
- —
No personal income docs; deal must DSCR.
Hard money
10% down · 12.0% · 12mo
- Down + closing
- —
- Monthly P&I
- —
- Monthly cashflow
- —
- DSCR
- —
- Eligible?
- —
Short-term bridge; refi at stabilization.
Rent comps 1 comps
| Address | Beds | Baths | Sqft | Rent | $/sqft | DOM | Units | Dist |
|---|---|---|---|---|---|---|---|---|
| 2399 Quarter Horse Trl #241 Overgaard, AZ | 2.0 | 1.0 | 800 | $1,899 | $2.37 | 14d | 1 | 0.03mi |
HOA detail
- Monthly dues
- $329 · $3,948/yr
Listing history 14 events
-
2026-05-31days on market $135,000 Active 166 DOM
-
2026-03-26price $135,000 749-char remark
Show marketing remark (749 chars)
Stunning 2 bed/ 1 bath condo.. Amazing upgrades to this incredible, single story, 2 bed/ 1 bath condo that is just a quick walk to shops or drive to Show Low! As you enter this light filled condo you will love the open floorplan and incredible windows with views of pine trees and mountains! Upgraded kitchen with neutral cabinetry and stainless steel refrigerator, tile floors, ceiling fans throughout, washer/ dryer on site, upgraded lighting fixtures. Beautiful bathroom w/ designer finishes and nice tile! Neutral indoor and outdoor paint. Condo sits close to Hwy 260! The indoor/ outdoor living is ideal from this sunny/ covered patio. Stroll to downtown - enjoy hiking trails and parks. Access to incredible amenities at Bison Ranch Community!
-
2025-12-15$145,000 Active 749-char remark
Show marketing remark (749 chars)
Stunning 2 bed/ 1 bath condo.. Amazing upgrades to this incredible, single story, 2 bed/ 1 bath condo that is just a quick walk to shops or drive to Show Low! As you enter this light filled condo you will love the open floorplan and incredible windows with views of pine trees and mountains! Upgraded kitchen with neutral cabinetry and stainless steel refrigerator, tile floors, ceiling fans throughout, washer/ dryer on site, upgraded lighting fixtures. Beautiful bathroom w/ designer finishes and nice tile! Neutral indoor and outdoor paint. Condo sits close to Hwy 260! The indoor/ outdoor living is ideal from this sunny/ covered patio. Stroll to downtown - enjoy hiking trails and parks. Access to incredible amenities at Bison Ranch Community!
-
2024-07-20historical
-
2024-07-15historical $1,200
-
2024-04-06$1,200
-
2024-03-22$165,000 Active
-
2023-09-19historical
-
2023-08-15price $155,000
-
2023-06-02status Active
-
2023-05-24historical Under Contract Accepting Backups
-
2023-04-27status Active
-
2023-04-15historical Under Contract Accepting Backups
-
2023-04-10$159,000 Active
ⓘ Source: listings_history table (triggers on properties + properties_extension) + one-shot
backfill from property_details.listing_events for pre-trigger history.
Climate risk First Street
- Flood 1/10 Low FEMA zone X (unshaded) · 0% chance over 30 yrs
- Wildfire 7/10 Severe
- Heat 2/10 Low 7 d/yr ≥87°F today · 19 d/yr by 30 yrs out
- Wind 1/10 Low
- Air quality 1/10 Low 0 unhealthy d/yr today · 0 by 30 yrs out
Nearby sold comps map
Loading sold comps map…
Walkable amenities ~0.75 mi
Loading nearby amenities…
Taxation est. · year 1
- Rental income
- $22,788
- − Mortgage interest
- −$7,562
- − Property taxes
- −$2,025
- − Insurance
- −$675
- − Repairs & maintenance
- −$1,823
- − Management
- −$1,823
- − HOA
- −$3,948
- − Depreciation
- −$3,927
- Taxable income
- $1,005
- Est. tax owed @ 24.0%
- −$241
- After-tax cash flow
- $2,618/yr
For passive investors: Depreciation is non-cash, so a rental often shows a tax loss while cash-flowing — sheltering income. Rental losses are passive: they offset passive income freely, and up to $25,000/yr can offset ordinary (W-2) income if you actively participate and your MAGI is under $100k (phasing out to $0 by $150k); unused losses carry forward. On sale, claimed depreciation is recaptured at up to 25%, and gains may owe capital-gains tax (a 1031 exchange can defer both). Figures are a year-1 estimate at your 24.0% rate — not tax advice; consult a CPA.
Condition & rehab AI · 13 photos
This single-story condo is in good condition with neutral finishes and a well-maintained exterior. It offers a good balance of upgrades and potential for further value enhancement through exterior painting and landscaping improvements.
Value-add opportunities
- Resale Painting the exterior siding — Fresh paint can enhance curb appeal and property value
- Resale Landscaping improvements — Enhanced landscaping can attract more buyers and renters
Renovation cost estimate screening
Value-add ROI direction
- Resale Painting the exterior siding — Fresh paint can enhance curb appeal and property value ↑
- Resale Landscaping improvements — Enhanced landscaping can attract more buyers and renters ↑
ⓘ Cost ranges are severity-bucket heuristics (US national rule-of-thumb). Get contractor quotes + a written scope before underwriting a rehab budget.
Schools (NCES district)
- District
- Heber-Overgaard Unified District (4392)
- NCES district ID
- 0400026
- Math proficiency
- 52% ▼ -5.00%
- Reading proficiency
- 45% ▼ -1.00%
- Median HH income
- $37,916
- Composite
- 40.42/100
- National rank
- #3727
- State rank
- #51 of 249 in AZ
Livability — Heber-Overgaard
No livability data for this city. (Only ~50 U.S. cities are tracked.)
Census & demographics
- Population (ZIP)
- 3,989
Population outlook (Navajo County) Hauer SSP2
- Today (2025)
- 105,760 people
- By 2030
- 103,301 · -2.3%
- By 2040
- 97,070 · -8.2%
- By 2050
- 88,850 · -16.0%
- By 2075
- 65,180 · -38.4%
- By 2100
- 37,281 · -64.7%
Race, ethnicity, and origin ACS 2023
- Neighborhood character
- Predominantly White (89%)
- Race & ethnicity
- White 89% Hispanic / Latino 5% Two or more races 4% Native American 3% Asian 2%
- Common ancestry
- Lithuanian 10% Italian 7% Portuguese 3%
- Foreign-born
- 4% · Canada, China
- Languages at home
- 93% English-only · Spanish 2% Other Indo-European 1% Russian/Polish/Slavic 1%
Political lean MEDSL · Navajo
- 2024 margin
- R (+17.2) · D 40.9% · R 58.1%
- 2008→2024 swing
- -5.5pp toward R · 2008: -11.7pp · 2024: -17.2pp
- All cycles
- 2024: R+17.2 2020: R+8.2 2016: R+7.9 2012: R+8.4 2008: R+11.7
Not yet ingested
- Civics
- —
Market trends
- HPI YoY
- ▼ -83.51%
- Current HPI
- 358.021
- Rent YoY
- —
- Metro
- —
- State GDP YoY
- ▲ 4.54%
- F500 in state
- 20
Industry mix (Fortune 500 HQ in AZ)
| Industry | F500 HQs | Revenue |
|---|---|---|
| Technology | 2 | $13B |
|
||
| Mining / Metals | 1 | $23B |
|
||
| Environmental Services | 1 | $16B |
|
||
| Metals / Steel | 1 | $14B |
|
||
| Technology Distribution | 1 | $9B |
|
||
| Homebuilding | 1 | $8B |
|
||
Price history
-15.1% since first listed13 events — show timeline
- 2026-03-26 Price Changed $135,000 ARMLS
- 2025-12-15 Listed $145,000 ARMLS
- 2024-07-20 Listing Removed — ARMLS
- 2024-07-15 Rental Removed $1,200 ARMLS
- 2024-04-06 Listed for Rent $1,200 ARMLS
- 2024-03-22 Listed $165,000 ARMLS
- 2023-09-19 Listing Removed — ARMLS
- 2023-08-15 Price Changed $155,000 ARMLS
- 2023-06-02 Relisted — ARMLS
- 2023-05-24 Contingent — ARMLS
- 2023-04-27 Relisted — ARMLS
- 2023-04-15 Contingent — ARMLS
- 2023-04-10 Listed $159,000 ARMLS
Cash-flow waterfall
monthlySold comps — $/sqft
last 12 mo · ≤1 miLoading sold comps…