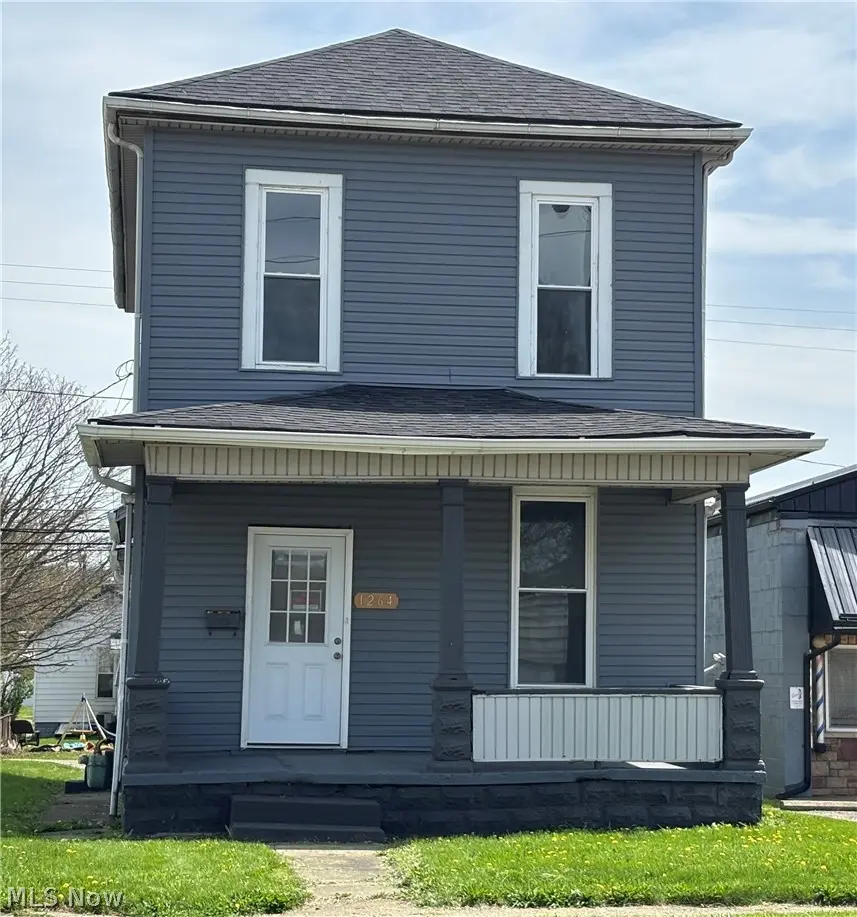
1264 Linden Ave · Zanesville, OH
Flood risk 8/10 · Major
- FEMA flood zone
- X (unshaded)
- Chance of flooding over 30 yrs
- 0.99%
- Est. flood insurance / yr
- $473 – $860
Fire risk 1/10 · Minimal
- Est. fire insurance / yr
- $713 – $1,323
Heat risk 4/10 · Minor
- Hot days now (above 98°F)
- 7 days/yr
- Hot days in 30 yrs
- 19 days/yr
Wind risk 2/10 · Minimal
- Chance of severe wind over 30 yrs
- 0.0%
Air-quality risk 2/10 · Minimal
- Unhealthy air days now
- 1 days/yr
- Unhealthy air days in 30 yrs
- 1 days/yr
Risk factors via First Street. Map © Google.
Why this score? — see what drove the D grade
The composite is a weighted blend of 9 inputs, each scored 0–100. Each bar is that input's sub-score; the figure is the points it added to the 100-point composite (weight × sub-score).
- Cash flow +14.0/30.0
- ARV discount +11.1/15.0
- DSCR +4.3/10.0
- Livability +3.7/5.0
- Rent growth +3.6/5.0
- 1% rule +3.1/10.0
- Schools +2.7/10.0
- Condition / age +2.5/5.0
- Appreciation +0.0/10.0
$139,900
🖨 Deal sheet 📄 Offer letter ✓ Due diligence
Listing remarks MLS
Fully renovated 2-bedroom property offering a rare combination of residential comfort, investment potential, and high-visibility location. Situated in a commercial corridor while maintaining residential zoning, this property provides flexibility for homeowners, investors, or potential small business use such as an office, boutique, or live/workspace (buyer to verify). This 1,500+ sq ft home has been extensively updated and is truly move-in ready. Major improvements include a newer roof, furnace, central air, vinyl siding, updated plumbing and electrical, along with new replacement windows, interior and exterior doors, flooring, and a completely remodeled kitchen featuring new cabinetry and countertops. Additional updates include new gutters and modern fixtures throughout. The functional layout offers a spacious living room with decorative fireplace, formal dining area, and multiple rooms that can easily adapt to private offices, workspace, or traditional living. Main floor laundry adds convenience, while the full basement provides excellent storage or future expansion potential. Positioned along a well-traveled route with easy access to major roads, shopping, and local amenities, this property delivers both immediate usability and long-term upside. Whether you’re looking for a move-in ready home, a turnkey investment, or a space to grow your business, this property checks all the boxes. Off Street Parking
Key facts
- Fully renovated
- Residential zoning
- Newer roof
Tags
Neighborhood map
What this means for you Summary
Snapshot
- This is a 2-bed/1.0-bath single-family listed at $140k.
Deal economics
- At list price, monthly cash flow is $-37 ($-445/yr) — negative.
- To cash-flow at today's rent, offer at most $133k (4.7% below list).
- To meet the 1% rule (rent ≥ 1% of price), the offer needs to be $113k (19.1% below list).
- Recommended offer: $113k (19.1% below list) — sets the bar for 1% rule.
- Cap rate 6.5% vs local median 3.3% in Zanesville — top-decile yield for the area; either an underpriced asset or a hidden risk that comps aren't pricing in. Stress-test before assuming the spread holds.
Location & tenants
- Location reads 74/100 on livability (#290 in OH, #4,764 nationally) — a middle-class / working-renter tenant base. Strengths: cost of living A+, housing A+, health & safety A+; Watch: schools C-, crime D, commute F.
- Zanesville City (town): math 29% / reading 38% proficiency, ranked #570 of 656 in OH (top 87%) — families likely to look elsewhere, expect single-tenant / working-renter base with shorter leases; 73% free/reduced lunch — lower-income household profile, screen leases tightly.
- Market conditions: Rents rising fast (+4.2%/yr); 299 active listings in the ZIP; 140 units permitted in Muskingum County in 2024 (100 in 5+ unit buildings).
Forward outlook
- Local home prices are declining (-3.0%/yr); year-one equity from $967 of loan paydown is wiped out by about $4k of value loss. Plan a longer hold.
- Muskingum County population projected at -10% by 2050 — secular population decline; favor cash flow + early exit over multi-decade hold.
Negotiation context
- It's been on market 68 days — a 6% lower offer ($132k) is reasonable based on typical stale-listing flexibility.
- 8 sale attempts since 3y ago; this cycle's ask has dropped $10k (7%) from the opening price — seller is motivated, your offer sets the floor, not the list.
Risks & watch-outs
- Watch-outs: flood insurance adds $56/mo; built in 1901 — expect roof / HVAC / electrical / plumbing capex.
- Climate carrying-cost: severe flood risk — expect insurance premiums to compound above CPI over the hold.
Questions for the listing agent
- What do current leases actually rent for vs. the listed asking? Can we see a recent rent roll and the last 12 months of T-12 income?
- It's been on market 68 days. Have you received any prior offers? Is the seller open to a 19% concession, seller financing, or rate buy-down credit?
- Built in 1901 — when were the roof, HVAC, electrical panel, plumbing, and water heater last replaced?
- What's the actual annual flood-insurance premium (NFIP or private), and is the property in a SFHA with mandatory coverage?
- Why hasn't it sold? Are there any deal-killer items the seller is aware of (foundation, flood, title, zoning, code violations)?
- Is there a deadline driving the sale (1031 exchange, divorce, estate, relocation)? That informs how much negotiation room exists.
- Crime grade is D in this area — have there been break-ins, vandalism, or insurance claims at this property in the last 3 years? What carrier currently insures it and at what premium?
- The area grade is low — what's the realistic commute time and amenity access for the typical tenant pool here? Any planned neighborhood developments (good or bad) we should know about?
- What's the average days-on-market for RENTAL listings here right now (not sales)? A rising rental-DOM trend means longer vacancies and softer asking-rent achievability than the comps imply.
- What's the recent tenant-quality profile in this submarket — average credit score on applications, eviction rate, late-payment / NSF rate, and stable-employment percentage? A property-management company in the area should have these aggregated.
- How much new for-sale + rental construction is in the pipeline within 1–3 miles? Heavy new supply typically softens prices + rents 12–24 months out; constrained supply supports both.
Investment metrics
- 1% rule
- 0.81% ✗
- Cap rate
- 6.45%
- Cash-on-cash
- 0.57%
- DSCR
- 1.03
- GRM
- 10.3
CMA / ARV
- ARV (median comp)
- $152,205
- List price
- $139,900
- Delta
- -8.08%
- Verdict
- FAIR
- Comps
- 20 within 1.0 mi
Show comp detail 12 sales within ~0.75 mi
| Address | Dist | Beds/Ba | Sqft | Sold | Price | $/sf | Match |
|---|---|---|---|---|---|---|---|
| 1404 Euclid Ave | 0.21mi | 3/1.5 (+1) | 1,520 (+0%) | 3mo | $229,900 | $151 | 80 |
| 1417 Central Ave | 0.18mi | 2/2.0 | 1,424 (-6%) | 6mo | $155,000 | $109 | 73 |
| 637 Lenox Ave | 0.42mi | 3/2.0 (+1) | 1,504 (-0%) | 0mo | $250,000 | $166 | 70 |
| 1321 Hazel Ave | 0.54mi | 3/1.0 (+1) | 1,584 (+5%) | 3mo | $175,000 | $110 | 59 |
| 714 Saint Louis Ave | 0.51mi | 3/1.5 (+1) | 1,416 (-6%) | 7mo | $124,950 | $88 | 53 |
| 513 Van Horn Ave | 0.34mi | 3/1.0 (+1) | 1,303 (-14%) | 7mo | $126,855 | $97 | 50 |
| 1910 Euclid Ave | 0.53mi | 3/2.0 (+1) | 1,394 (-8%) | 4mo | $200,000 | $143 | 50 |
| 629 Caldwell St | 0.60mi | 2/1.0 | 1,352 (-11%) | 9mo | $200,000 | $148 | 47 |
| 2035 Wilmer St | 0.73mi | 3/1.0 (+1) | 1,400 (-7%) | 5mo | $155,000 | $111 | 45 |
| 1630 Marion | 0.64mi | 3/1.5 (+1) | 1,378 (-9%) | 7mo | $295,000 | $214 | 42 |
| 810 Brown St | 0.60mi | 3/2.5 (+1) | 1,366 (-10%) | 9mo | $239,000 | $175 | 38 |
| 736 Elberon Ave | 0.71mi | 3/2.0 (+1) | 1,680 (+11%) | 6mo | $105,000 | $63 | 34 |
Match score weights: distance 35% · size 25% · config 20% · recency 20%. Top-matched comps best support the ARV.
Projected returns pro-forma
-3.0% appreciation · 4.23% rent growth · sell at horizon
- IRR
- -16.9%
- Equity multiple
- 0.40×
- Total profit
- $-23,618
- Equity at exit
- $20,860
- IRR
- -6.7%
- Equity multiple
- 0.55×
- Total profit
- $-17,664
- Equity at exit
- $12,096
Cash invested: $39,172 (down + closing). Projections, not guarantees.
Landlord ↔ Tenant lean methodology
- Overall (STATE)
- 73 Landlord-Friendly
- State Ohio
- 73 Landlord-Friendly · R+6
- County
- — inherits STATE
- City
- — inherits STATE
ZIP-level market 43701
- Home prices YoY
- -23.2%
- Rents YoY
- 4.2%
- Active inventory
- 299
- Price-to-rent
- 10.3×
Monthly cashflow live
- Estimated rent
- $1,131 medium interval (Pro) →
- Mortgage (P&I)
- −$734
- Tax from tax record
- −$83 /mo · $998/yr
- Insurance
- −$58
- Flood insurance flood zone
- −$56 /mo · $666/yr
- HOA
- −$0
- Vacancy / Maint / Mgmt
- −$238
- Net cashflow
- $-37
Break-even live
UW: 25.0% down · 7.5% · 30yr · 1.5% tax · 5.0% vac · 8.0% maint · 8.0% mgmt
Financing live
Cash to close
- Down payment
- $34,975
- Closing costs
- $4,197
- Reserves months
- —
- Total cash needed
- —
Loan-product check · same deal, 3 products live
Conventional
25% down · 7.5% · 30yr
- Down + closing
- —
- Monthly P&I
- —
- Monthly cashflow
- —
- DSCR
- —
- Eligible?
- —
Personal DTI + credit; lowest rate.
DSCR
20% down · 8.5% · 30yr
- Down + closing
- —
- Monthly P&I
- —
- Monthly cashflow
- —
- DSCR
- —
- Eligible?
- —
No personal income docs; deal must DSCR.
Hard money
10% down · 12.0% · 12mo
- Down + closing
- —
- Monthly P&I
- —
- Monthly cashflow
- —
- DSCR
- —
- Eligible?
- —
Short-term bridge; refi at stabilization.
Listing history 38 events
-
2026-06-19days on market $139,900 Active 68 DOM
-
2026-06-18days on market $139,900 Active 67 DOM
-
2026-06-17days on market $139,900 Active 66 DOM
-
2026-06-16days on market $139,900 Active 65 DOM
-
2026-06-15days on market $139,900 Active 64 DOM
-
2026-06-14days on market $139,900 Active 62 DOM
-
2026-06-12days on market $139,900 Active 61 DOM
-
2026-06-09days on market $139,900 Active 58 DOM
-
2026-06-08days on market $139,900 Active 57 DOM
-
2026-06-07days on market $139,900 Active 56 DOM
-
2026-06-05days on market $139,900 Active 53 DOM
-
2026-06-02days on market $139,900 Active 51 DOM
-
2026-06-01days on market $139,900 Active 50 DOM
-
2026-05-31price $139,900 Active 49 DOM
-
2026-05-31days on market $144,900 Active 49 DOM
-
2026-05-30days on market $144,900 Active 48 DOM
-
2026-04-29price $144,900 1434-char remark
Show marketing remark (1434 chars)
Fully renovated 2-bedroom property offering a rare combination of residential comfort, investment potential, and high-visibility location. Situated in a commercial corridor while maintaining residential zoning, this property provides flexibility for homeowners, investors, or potential small business use such as an office, boutique, or live/workspace (buyer to verify). This 1,500+ sq ft home has been extensively updated and is truly move-in ready. Major improvements include a newer roof, furnace, central air, vinyl siding, updated plumbing and electrical, along with new replacement windows, interior and exterior doors, flooring, and a completely remodeled kitchen featuring new cabinetry and countertops. Additional updates include new gutters and modern fixtures throughout. The functional layout offers a spacious living room with decorative fireplace, formal dining area, and multiple rooms that can easily adapt to private offices, workspace, or traditional living. Main floor laundry adds convenience, while the full basement provides excellent storage or future expansion potential. Positioned along a well-traveled route with easy access to major roads, shopping, and local amenities, this property delivers both immediate usability and long-term upside. Whether you’re looking for a move-in ready home, a turnkey investment, or a space to grow your business, this property checks all the boxes. Off Street Parking
-
2026-04-12$149,900 Active 1434-char remark
Show marketing remark (1434 chars)
Fully renovated 2-bedroom property offering a rare combination of residential comfort, investment potential, and high-visibility location. Situated in a commercial corridor while maintaining residential zoning, this property provides flexibility for homeowners, investors, or potential small business use such as an office, boutique, or live/workspace (buyer to verify). This 1,500+ sq ft home has been extensively updated and is truly move-in ready. Major improvements include a newer roof, furnace, central air, vinyl siding, updated plumbing and electrical, along with new replacement windows, interior and exterior doors, flooring, and a completely remodeled kitchen featuring new cabinetry and countertops. Additional updates include new gutters and modern fixtures throughout. The functional layout offers a spacious living room with decorative fireplace, formal dining area, and multiple rooms that can easily adapt to private offices, workspace, or traditional living. Main floor laundry adds convenience, while the full basement provides excellent storage or future expansion potential. Positioned along a well-traveled route with easy access to major roads, shopping, and local amenities, this property delivers both immediate usability and long-term upside. Whether you’re looking for a move-in ready home, a turnkey investment, or a space to grow your business, this property checks all the boxes. Off Street Parking
-
2026-03-26historical
-
2025-11-21price $159,000
-
2025-09-30price $162,000
-
2025-09-13$167,000 Active
-
2025-09-02historical
-
2025-09-01historical
-
2025-06-28$167,000 Active
-
2025-06-23price $167,000
-
2025-05-26$175,000 Active
-
2025-05-19historical
-
2025-03-12price $175,000
-
2025-02-28price $185,000
-
2025-02-05price $187,900
-
2025-01-18price $194,900
-
2024-12-17$199,900 Active
-
2023-04-18historical
-
2023-01-30status Active
-
2023-01-20Contingent
-
2023-01-19$61,000
-
2021-10-05soldstatus $155,000
ⓘ Source: listings_history table (triggers on properties + properties_extension) + one-shot
backfill from property_details.listing_events for pre-trigger history.
Tax reassessment forecast OH · Partial reset (capped growth)
- Current annual tax
- $998 · $83/mo
- Projected year-2 tax
- $1,590 · $133/mo
- Expected delta
- +$592/yr (+$49/mo · 59.3%)
ⓘ Screening estimate from a state-policy table — verify with the county assessor before closing.
Climate risk First Street
- Flood 8/10 Severe FEMA zone X (unshaded) · 99% chance over 30 yrs
- Wildfire 1/10 Low
- Heat 4/10 Moderate 7 d/yr ≥98°F today · 19 d/yr by 30 yrs out
- Wind 2/10 Low 0% chance of damaging wind over 30 yrs
- Air quality 2/10 Low 1 unhealthy d/yr today · 1 by 30 yrs out
Nearby sold comps map
Loading sold comps map…
Walkable amenities ~0.75 mi
Loading nearby amenities…
Taxation est. · year 1
- Rental income
- $13,574
- − Mortgage interest
- −$7,837
- − Property taxes
- −$998
- − Insurance
- −$1,366
- − Repairs & maintenance
- −$1,086
- − Management
- −$1,086
- − Depreciation
- −$4,070
- Taxable loss
- −$2,869
- Est. tax savings @ 24.0%
- +$688
- After-tax cash flow
- $244/yr
For passive investors: Depreciation is non-cash, so a rental often shows a tax loss while cash-flowing — sheltering income. Rental losses are passive: they offset passive income freely, and up to $25,000/yr can offset ordinary (W-2) income if you actively participate and your MAGI is under $100k (phasing out to $0 by $150k); unused losses carry forward. On sale, claimed depreciation is recaptured at up to 25%, and gains may owe capital-gains tax (a 1031 exchange can defer both). Figures are a year-1 estimate at your 24.0% rate — not tax advice; consult a CPA.
Schools (NCES district)
- District
- Zanesville City
- NCES district ID
- 3904517
- Math proficiency
- 29% ▼ -19.00%
- Reading proficiency
- 38% ▼ -11.00%
- Median HH income
- $29,695
- Composite
- 27.13/100
- National rank
- #7035
- State rank
- #570 of 656 in OH
Livability — Zanesville
- Score
- 74/100
- State rank
- #290
- US rank
- #4764
Category grades
Schools grade is shown separately in the Schools card above.
Census & demographics
- Census place
- Zanesville, OH
- County
- Muskingum County · 56,402 people
- City population
- 56,402
- Metro
- Zanesville, OH
- Population (ZIP)
- 56,402
- Household income
- $57,565
- Rent vs Own
- Severe rent burden
- 1619.0
Population outlook (Muskingum County) Hauer SSP2
- Today (2025)
- 85,625 people
- By 2030
- 84,592 · -1.2%
- By 2040
- 81,288 · -5.1%
- By 2050
- 76,751 · -10.4%
- By 2075
- 64,143 · -25.1%
- By 2100
- 47,598 · -44.4%
Race, ethnicity, and origin ACS 2023
- Neighborhood character
- Predominantly White (88%)
- Race & ethnicity
- White 88% Two or more races 6% Black 4% Hispanic / Latino 2%
- Common ancestry
- Slovak 2% Iranian 1% Italian 1%
- Foreign-born
- 1% · Canada
- Languages at home
- 98% English-only · Spanish 1%
Political lean MEDSL · Muskingum
- 2024 margin
- Solid R (+43.9) · D 27.6% · R 71.6%
- 2008→2024 swing
- -36.7pp toward R · 2008: -7.2pp · 2024: -43.9pp
- All cycles
- 2024: R+43.9 2020: R+39.3 2016: R+35.0 2012: R+7.0 2008: R+7.2
Not yet ingested
- Civics
- —
Market trends
- HPI YoY
- ▼ -90.41%
- Current HPI
- 298.9994
- Rent YoY
- ▲ 4.23%
- Metro
- Zanesville, OH
- State GDP YoY
- ▲ 1.98%
- F500 in state
- 48
Industry mix (Fortune 500 HQ in OH)
| Industry | F500 HQs | Revenue |
|---|---|---|
| Insurance | 3 | $145B |
|
||
| Industrial Machinery | 3 | $49B |
|
||
| Financial Services | 3 | $24B |
|
||
| Consumer Goods | 2 | $93B |
|
||
| Aerospace / Defense | 2 | $47B |
|
||
| Utilities | 2 | $33B |
|
||
Price history
-6.5% since first listed22 events — show timeline
- 2026-04-29 Price Changed $144,900 MLSNOW
- 2026-04-12 Listed $149,900 MLSNOW
- 2026-03-26 Listing Removed — MLSNOW
- 2025-11-21 Price Changed $159,000 MLSNOW
- 2025-09-30 Price Changed $162,000 MLSNOW
- 2025-09-13 Listed $167,000 MLSNOW
- 2025-09-02 Listing Removed — CBRMLS
- 2025-09-01 Listing Removed — MLSNOW
- 2025-06-28 Listed $167,000 CBRMLS
- 2025-06-23 Price Changed $167,000 MLSNOW
- 2025-05-26 Listed $175,000 MLSNOW
- 2025-05-19 Listing Removed — MLSNOW
- 2025-03-12 Price Changed $175,000 MLSNOW
- 2025-02-28 Price Changed $185,000 MLSNOW
- 2025-02-05 Price Changed $187,900 MLSNOW
- 2025-01-18 Price Changed $194,900 MLSNOW
- 2024-12-17 Listed $199,900 MLSNOW
- 2023-04-18 Listing Removed — MLSNOW
- 2023-01-30 Relisted — MLSNOW
- 2023-01-20 Listed — MLSNOW
- 2023-01-19 Listed $61,000 MLSNOW
- 2021-10-05 Sold (Public Records) $155,000 Public Records
Property tax history
+4.9%/yrLatest (2025): $998 · +40.3% YoY. Source: county tax records.
Cash-flow waterfall
monthlySold comps — $/sqft
last 12 mo · ≤1 miLoading sold comps…