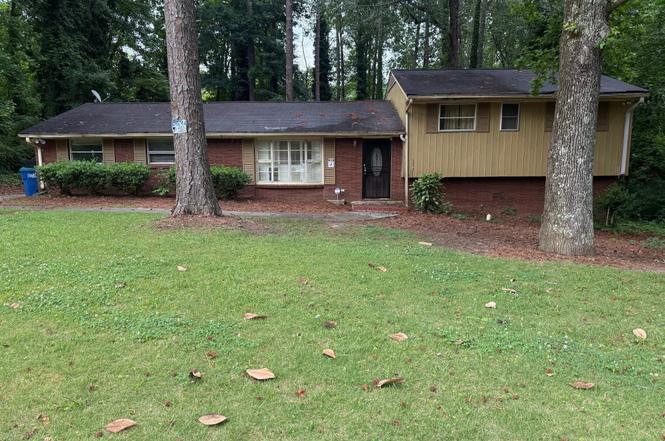
5490 Longmeadow Ln · South Fulton, GA
Flood risk 1/10 · Minimal
- FEMA flood zone
- X (unshaded)
- Chance of flooding over 30 yrs
- 0.0%
- Est. flood insurance / yr
- $473 – $860
Fire risk 3/10 · Minor
- Est. fire insurance / yr
- $963 – $1,789
Heat risk 5/10 · Moderate
- Hot days now (above 105°F)
- 7 days/yr
- Hot days in 30 yrs
- 16 days/yr
Wind risk 6/10 · Moderate
- Chance of severe wind over 30 yrs
- 27.0%
Air-quality risk 4/10 · Minor
- Unhealthy air days now
- 4 days/yr
- Unhealthy air days in 30 yrs
- 6 days/yr
Risk factors via First Street. Map © Google.
Why this score? — see what drove the B- grade
The composite is a weighted blend of 9 inputs, each scored 0–100. Each bar is that input's sub-score; the figure is the points it added to the 100-point composite (weight × sub-score).
- Cash flow +17.9/30.0
- ARV discount +15.0/15.0
- Appreciation +10.0/10.0
- DSCR +5.6/10.0
- 1% rule +5.1/10.0
- Schools +4.5/10.0
- Rent growth +2.7/5.0
- Livability +2.5/5.0
- Condition / age +2.5/5.0
$179,900
🖨 Deal sheet 📄 Offer letter ✓ Due diligence
Listing remarks MLS
ROOM FOR LARGE FAMILY TO SPEAD OUT. COME SEE AND APPLY YOUR CREATIVE TOUCHES TO RENOVATE THIS LARGE SPLIT LEVEL THIS IS A FANNIE MAE HOMPATH PROPERTY.
Key facts
- Kitchenette
- Full bath
- Separate entry
Tags
Property features AI
Finance
- Other: Lot approximately 0.48 acre; Located in Meadows UN 02 subdivision; Address: 5490 Longmeadow Ln, South Fulton (Atlanta), GA 30349
- Financial info: Listing offered As Is; Accepts Cash and Conventional financing
- HOA & community: No HOA
Exterior
- Parking: Parking pad with space for 3 vehicles; Open parking available
- Utilities: Public water; Public sewer; Electricity available; Cable available; High-speed internet available; Phone service available
- Home design: Single family residence; House; Residential property; Built in 1964; Property listed in as-is/fixer condition
- Construction: Brick construction; Composition roof; Built in 1964; Unfinished basement foundation
- Exterior features: Brick exterior; Composition roof
Interior
- Kitchen: No appliances listed
- Bedrooms: 3 bedrooms on the main level
- Flooring: Hardwood floors
- Bathrooms: 3 full bathrooms
- Heating & cooling: Natural gas heating; Central air conditioning
- Interior features: One-level living; Unfinished basement; Family room
- Laundry & utility: Laundry located in the basement
Neighborhood map
What this means for you Summary
Snapshot
- This is a 3-bed/2.0-bath single-family listed at $180k.
Deal economics
- At list price, monthly cash flow is $150 ($2k/yr) — positive.
- The deal already cash-flows at list — no discount required.
- Meets the 1% rule at list price ($2k rent vs $180k).
- Cap rate 7.3% vs local median 4.6% in South Fulton — top-decile yield for the area; either an underpriced asset or a hidden risk that comps aren't pricing in. Stress-test before assuming the spread holds.
Location & tenants
- Location reads: area grade B — affects rentability + tenant quality, not the cash-flow math above.
- Fulton County (suburban): math 49% / reading 53% proficiency, ranked #12 of 174 in GA (top 7%) — acceptable for families but not a draw, mixed tenant base, ~2y average lease.
- Zoned schools: Mcnair Middle School (math 8% / reading 12%, grade F, #433 of 470 statewide, top 93%, 888 students, 100% FRL); Banneker High School (math 24% / reading 75%, grade D+, #28 of 424 statewide, top 7%, 1,610 students, 100% FRL) — zoned schools average 100% FRL vs 41% district-wide (59 pts higher); higher-poverty schools than district average — tighter screening recommended.
- Zoned-school proficiency averages 30% at this address vs 51% district-wide (-21 pts) — the specific schools serving this property underperform the Fulton County average; the district grade overstates school quality for this exact location.
- Market conditions: Rents flat; 651 active listings in the ZIP; 40 comparable units currently listed for rent nearby; rentals at typical pace (median 24d on market — plan ~3-4 weeks tenant-placement turnaround); 40% of comp listings sitting > 30 days — soft ceiling on asking rent; 11,565 units permitted in Fulton County in 2024 (8,159 in 5+ unit buildings).
Forward outlook
- In year one you build about $19k of equity ($1k loan paydown + $18k appreciation (10.0% local appreciation)).
- Fulton County population projected at +38% by 2050 — long-run rental-demand tailwind backs the buy-and-hold thesis.
- At projected returns (10.0% appreciation + 0.9% rent growth), your $50k cash investment doubles in ~3 years — after that, you're playing with house money.
- By year 2, paydown + projected appreciation supports a ~$31k cash-out refi (75% LTV) — recoverable capital for the next deal without selling this one.
Negotiation context
- Only 9 days on market — expect competitive offers; lowballing is unlikely to land.
- 2 sale attempts since 15y ago with the ask held roughly flat each time — persistent listings suggest the price (not the market) is what's stuck; bring a comps-based counter.
- Current owner paid $14k; list at $180k implies a 1141% gain — meaningful room to come down on a strong offer.
Risks & watch-outs
- Climate carrying-cost: major wind risk, 27% chance of damaging wind over 30y; extreme-heat days projected 7→16/yr by 2055 (HVAC capex compounding) — expect insurance premiums to compound above CPI over the hold.
Questions for the listing agent
- Built in 1964 — when were the roof, HVAC, electrical panel, plumbing, and water heater last replaced?
- Is there a deadline driving the sale (1031 exchange, divorce, estate, relocation)? That informs how much negotiation room exists.
- What's the average days-on-market for RENTAL listings here right now (not sales)? A rising rental-DOM trend means longer vacancies and softer asking-rent achievability than the comps imply.
- What's the recent tenant-quality profile in this submarket — average credit score on applications, eviction rate, late-payment / NSF rate, and stable-employment percentage? A property-management company in the area should have these aggregated.
- How much new for-sale + rental construction is in the pipeline within 1–3 miles? Heavy new supply typically softens prices + rents 12–24 months out; constrained supply supports both.
Investment metrics
- 1% rule
- 1.01% ✓
- Cap rate
- 7.30%
- Cash-on-cash
- 3.58%
- DSCR
- 1.16
- GRM
- 8.2
CMA / ARV
- ARV (on-the-fly)
- $249,900
- Comps found
- 12
Show comp detail 12 sales within ~0.75 mi
| Address | Dist | Beds/Ba | Sqft | Sold | Price | $/sf | Match |
|---|---|---|---|---|---|---|---|
| 5453 Baybrook Cir Lot 0020 | 0.09mi | 3/2.5 | 1,749 (+3%) | 3mo | $364,990 | $209 | 87 |
| 2816 Two Lake Cir | 0.32mi | 3/2.5 | 1,645 (-3%) | 4mo | $170,000 | $103 | 74 |
| 5333 Sand Bar Ln | 0.43mi | 4/3.0 (+1) | 1,772 (+4%) | 1mo | $249,200 | $141 | 63 |
| 5157 Seashell Ln | 0.61mi | 3/2.5 | 1,696 (-0%) | 8mo | $244,900 | $144 | 63 |
| 2460 Surrey Trl | 0.44mi | 3/2.5 | 1,600 (-6%) | 9mo | $243,000 | $152 | 60 |
| 5273 High Tide Ct | 0.48mi | 4/2.5 (+1) | 1,712 (+1%) | 12mo | $275,000 | $161 | 59 |
| 2846 High Tide Dr | 0.45mi | 4/2.5 (+1) | 1,782 (+5%) | 9mo | $239,900 | $135 | 56 |
| 5149 Seashell Ln | 0.64mi | 4/2.5 (+1) | 1,609 (-5%) | 2mo | $187,500 | $117 | 53 |
| 5527 Jerome Rd | 0.41mi | 4/2.0 (+1) | 1,835 (+8%) | 12mo | $270,000 | $147 | 53 |
| 2880 Two Lakes Circle Cir | 0.42mi | 3/2.5 | 1,888 (+11%) | 9mo | $215,000 | $114 | 52 |
| 5863 Three Lakes Dr | 0.40mi | 4/2.5 (+1) | 1,912 (+12%) | 4mo | $304,000 | $159 | 50 |
| 5337 Jerome Rd | 0.46mi | 4/3.5 (+1) | 1,884 (+11%) | 6mo | $295,000 | $157 | 44 |
Match score weights: distance 35% · size 25% · config 20% · recency 20%. Top-matched comps best support the ARV.
Projected returns pro-forma
10.0% appreciation · 0.95% rent growth · sell at horizon
- IRR
- 26.1%
- Equity multiple
- 3.06×
- Total profit
- $103,936
- Equity at exit
- $162,068
- IRR
- 22.4%
- Equity multiple
- 6.79×
- Total profit
- $291,788
- Equity at exit
- $349,506
Cash invested: $50,372 (down + closing). Projections, not guarantees.
Landlord ↔ Tenant lean methodology
- Overall (STATE)
- 90 Strongly Landlord-Friendly
- State Georgia
- 90 Strongly Landlord-Friendly · R+3
- County
- — inherits STATE
- City
- — inherits STATE
ZIP-level market 30349
- Home prices YoY
- 4.6%
- Rents YoY
- 0.9%
- Active inventory
- 651
- Price-to-rent
- 8.2×
Monthly cashflow live
- Estimated rent
- $1,821 high interval (Pro) →
- Mortgage (P&I)
- −$943
- Tax from tax record
- −$269 /mo · $3,232/yr
- Insurance
- −$75
- HOA
- −$0
- Vacancy / Maint / Mgmt
- −$382
- Net cashflow
- $150
Break-even live
UW: 25.0% down · 7.5% · 30yr · 1.5% tax · 5.0% vac · 8.0% maint · 8.0% mgmt
Financing live
Cash to close
- Down payment
- $44,975
- Closing costs
- $5,397
- Reserves months
- —
- Total cash needed
- —
Loan-product check · same deal, 3 products live
Conventional
25% down · 7.5% · 30yr
- Down + closing
- —
- Monthly P&I
- —
- Monthly cashflow
- —
- DSCR
- —
- Eligible?
- —
Personal DTI + credit; lowest rate.
DSCR
20% down · 8.5% · 30yr
- Down + closing
- —
- Monthly P&I
- —
- Monthly cashflow
- —
- DSCR
- —
- Eligible?
- —
No personal income docs; deal must DSCR.
Hard money
10% down · 12.0% · 12mo
- Down + closing
- —
- Monthly P&I
- —
- Monthly cashflow
- —
- DSCR
- —
- Eligible?
- —
Short-term bridge; refi at stabilization.
Rent comps 40 comps
| Address | Beds | Baths | Sqft | Rent | $/sqft | DOM | Units | Dist |
|---|---|---|---|---|---|---|---|---|
| 5370 Longmeadow Ln Atlanta, GA | 3.0 | 2.0 | 1248 | $1,600 | $1.28 | 16d | 1 | 0.15mi |
| 5410 Twin Lakes Dr Atlanta, GA | 3.0 | 2.0 | 1277 | $2,040 | $1.60 | 43d | 1 | 0.20mi |
| 5645 Deerfield Trl Atlanta, GA | 3.0 | 1.5 | 1496 | $1,495 | $1.00 | 21d | 1 | 0.30mi |
| 2890 Jerome Rd Atlanta, GA | 3.0 | 1.5 | 1229 | $1,761 | $1.43 | 43d | 1 | 0.33mi |
| 5712 Westhill Cir Atlanta, GA | 4.0 | 2.0 | 1441 | $1,710 | $1.19 | 3d | 1 | 0.36mi |
| 2710 Dunmoreland Ter Atlanta, GA | 3.0 | 1.0 | 1198 | $1,540 | $1.29 | 43d | 1 | 0.36mi |
| 5460 Hampton Ct Atlanta, GA | 2.0 | 3.5 | 1554 | $1,500 | $0.97 | 43d | 1 | 0.50mi |
| 5194 Seaside Ct Atlanta, GA | 4.0 | 2.5 | 1765 | $2,135 | $1.21 | 24d | 1 | 0.52mi |
| 5380 Sand Bar Ln Atlanta, GA | 3.0 | 2.0 | 1361 | $1,961 | $1.44 | 3d | 1 | 0.53mi |
| 2736 Live Oak Trl Atlanta, GA | 4.0 | 3.0 | 2050 | $1,650 | $0.80 | 10d | 1 | 0.53mi |
| 5335 Willow Park Blvd Atlanta, GA | 4.0 | 2.5 | 1716 | $2,000 | $1.17 | 43d | 1 | 0.56mi |
| 5690 Hampton Ct Atlanta, GA | 2.0 | 3.0 | 1184 | $1,495 | $1.26 | 43d | 1 | 0.60mi |
| 3100 Godby Rd Atlanta, GA | 1.0–2.0 | 1.0–2.5 | 959 | $1,395 | $1.45 | 1d | 34 | 0.63mi |
| 3110 Godby Rd Unit 15a College Park, GA | 2.0 | 1.5 | 1062 | $1,150 | $1.08 | 2d | 1 | 0.67mi |
| 2500 Pleasant Hill Rd Atlanta, GA | 2.0–3.0 | 1.5–2.5 | 1405 | $1,449 | $1.03 | 24d | 2 | 0.69mi |
| 2883 Windsor Forrest Ct Atlanta, GA | 3.0 | 2.5 | 1115 | $1,895 | $1.70 | 1d | 1 | 0.74mi |
| 5071 Windsor Forrest Ln Atlanta, GA | 3.0 | 2.5 | 1303 | $1,881 | $1.44 | 12d | 1 | 0.75mi |
| 2817 Windsor Forrest Ct Atlanta, GA | 3.0 | 2.5 | 1408 | $1,697 | $1.21 | 43d | 1 | 0.76mi |
| 2835 Windsor Forrest Ct Atlanta, GA | 3.0 | 2.5 | 1680 | $1,881 | $1.12 | 5d | 1 | 0.77mi |
| 5515 Scofield Rd Atlanta, GA | 3.0 | 2.0 | 1109 | $1,788 | $1.61 | 10d | 1 | 0.84mi |
| 5442 Scofield Rd Atlanta, GA | 3.0 | 1.5 | 1368 | $1,775 | $1.30 | 43d | 1 | 0.88mi |
| 5247 Scofield Rd Atlanta, GA | 3.0 | 2.0 | 1958 | $2,000 | $1.02 | 43d | 1 | 0.92mi |
| 2431 Old National Pkwy College Park, GA | 1.0–3.0 | 1.0–2.0 | 1031 | $1,780 | $1.73 | 1d | 1 | 0.95mi |
| 2301 Godby Rd Atlanta, GA | 2.0 | 1.0 | 1054 | $1,225 | $1.16 | 43d | 1 | 1.05mi |
| 6056 Carriage Ct Atlanta, GA | 3.0 | 2.0 | 1400 | $1,599 | $1.14 | 5d | 1 | 1.12mi |
| 395 Fox Trail Dr Atlanta, GA | 3.0 | 2.0 | 1400 | $1,980 | $1.41 | 11d | 1 | 1.12mi |
| 2555 Flat Shoals Rd #3005 Atlanta, GA | 3.0 | 2.5 | 1724 | $1,850 | $1.07 | 5d | 1 | 1.15mi |
| 2555 Flat Shoals Rd #404 College Park, GA | 3.0 | 2.5 | 1408 | $1,700 | $1.21 | 24d | 1 | 1.16mi |
| 2865 Spruce Point Rd Atlanta, GA | 4.0 | 2.0 | 1050 | $1,910 | $1.82 | 43d | 1 | 1.18mi |
| 5750 Buffington Rd Atlanta, GA | 1.0–3.0 | 1.0–2.0 | 1142 | $1,702 | $1.49 | 1d | 19 | 1.19mi |
| 5267 Joan of Arc Pl Atlanta, GA | 3.0 | 1.0 | 1066 | $1,743 | $1.64 | 43d | 1 | 1.19mi |
| 3364 Estes Dr Atlanta, GA | 3.0 | 2.5 | 1736 | $1,889 | $1.09 | 16d | 1 | 1.20mi |
| 2555 Flat Shoals Rd #401 Atlanta, GA | 3.0 | 2.5 | 1550 | $2,050 | $1.32 | 43d | 1 | 1.22mi |
| 5740 Buffington Rd Atlanta, GA | 1.0–3.0 | 1.0–2.5 | 964 | $2,149 | $2.23 | 3d | 16 | 1.24mi |
| 5287 Chantilly Ter Atlanta, GA | 4.0 | 2.5 | 1897 | $2,006 | $1.06 | 21d | 1 | 1.26mi |
| 5477 Denny Dr Atlanta, GA | 4.0 | 3.0 | 1500 | $1,650 | $1.10 | 43d | 1 | 1.26mi |
| 6120 Hemperly Rd Atlanta, GA | 4.0 | 2.5 | 1770 | $2,100 | $1.19 | 24d | 1 | 1.28mi |
| 6120 Hemperly Rd Atlanta, GA | 4.0 | 2.5 | 1770 | $2,100 | $1.19 | 3d | 1 | 1.28mi |
| 6230 Cedar Wood Dr Atlanta, GA | 3.0 | 2.0 | 1238 | $1,694 | $1.37 | 43d | 1 | 1.29mi |
| 5730 N Castlegate Dr Unit A Atlanta, GA | 2.0 | 2.5 | 1125 | $1,395 | $1.24 | 43d | 1 | 1.31mi |
Listing history 8 events
-
2026-06-18statusdays on market $179,900 Active 9 DOM
-
2026-06-17days on market $179,900 Price Change 8 DOM
-
2026-06-16days on market $179,900 Price Change 7 DOM
-
2026-06-15pricestatus $179,900 Price Change 6 DOM
-
2026-06-15statusdays on market $184,999 Active 6 DOM
-
2026-06-13pricestatusdays on market $184,999 Price Change 4 DOM
-
2026-06-10remarks 372-char remark
-
2026-06-10$189,000 New 1 DOM
ⓘ Source: listings_history table (triggers on properties + properties_extension) + one-shot
backfill from property_details.listing_events for pre-trigger history.
Tax reassessment forecast GA · Resets to sale price
- Current annual tax
- $3,232 · $269/mo
- Projected year-2 tax
- $3,232 · $269/mo
- Expected delta
- $0/yr ($0/mo · 0.0%)
ⓘ Screening estimate from a state-policy table — verify with the county assessor before closing.
Climate risk First Street
- Flood 1/10 Low FEMA zone X (unshaded) · 0% chance over 30 yrs
- Wildfire 3/10 Moderate
- Heat 5/10 Major 7 d/yr ≥105°F today · 16 d/yr by 30 yrs out
- Wind 6/10 Major 27% chance of damaging wind over 30 yrs
- Air quality 4/10 Moderate 4 unhealthy d/yr today · 6 by 30 yrs out
Nearby sold comps map
Loading sold comps map…
Walkable amenities ~0.75 mi
Loading nearby amenities…
Taxation est. · year 1
- Rental income
- $21,846
- − Mortgage interest
- −$10,077
- − Property taxes
- −$3,232
- − Insurance
- −$900
- − Repairs & maintenance
- −$1,748
- − Management
- −$1,748
- − Depreciation
- −$5,233
- Taxable loss
- −$1,092
- Est. tax savings @ 24.0%
- +$262
- After-tax cash flow
- $2,068/yr
For passive investors: Depreciation is non-cash, so a rental often shows a tax loss while cash-flowing — sheltering income. Rental losses are passive: they offset passive income freely, and up to $25,000/yr can offset ordinary (W-2) income if you actively participate and your MAGI is under $100k (phasing out to $0 by $150k); unused losses carry forward. On sale, claimed depreciation is recaptured at up to 25%, and gains may owe capital-gains tax (a 1031 exchange can defer both). Figures are a year-1 estimate at your 24.0% rate — not tax advice; consult a CPA.
Schools (NCES district)
- District
- Fulton County
- NCES district ID
- 1302280
- Math proficiency
- 49% ▼ -2.00%
- Reading proficiency
- 53% ▬ 0.00%
- Median HH income
- $68,035
- Composite
- 45.33/100
- National rank
- #2640
- State rank
- #12 of 174 in GA
Livability — South Fulton
No livability data for this city. (Only ~50 U.S. cities are tracked.)
Census & demographics
- Census place
- South Fulton, GA
- County
- Fulton County · 1,094,430 people
- City population
- 127,674
- Metro
- Atlanta-Sandy Springs-Alpharetta, GA
- Population (ZIP)
- 79,872
- Household income
- $67,023
- Rent vs Own
- Severe rent burden
- 4258.0
Population outlook (Fulton County) Hauer SSP2
- Today (2025)
- 1,203,707 people
- By 2030
- 1,299,706 · +8.0%
- By 2040
- 1,488,256 · +23.6%
- By 2050
- 1,664,580 · +38.3%
- By 2075
- 2,036,072 · +69.2%
- By 2100
- 2,222,402 · +84.6%
Race, ethnicity, and origin ACS 2023
- Neighborhood character
- Predominantly Black (89%)
- Race & ethnicity
- Black 89% Hispanic / Latino 5% Two or more races 4% White 3%
- Foreign-born
- 9% · Canada
- Languages at home
- 88% English-only · Spanish 6% French/Haitian/Cajun 1%
Political lean MEDSL · Fulton
- 2024 margin
- Solid D (+44.9) · D 71.9% · R 27.0% · Other 1.1%
- 2008→2024 swing
- +9.8pp toward D · 2008: 35.0pp · 2024: 44.9pp
- All cycles
- 2024: D+44.9 2020: D+46.4 2016: D+42.1 2012: D+29.6 2008: D+35.0
Not yet ingested
- Civics
- —
Market trends
- HPI YoY
- ▲ 18.01%
- Current HPI
- 407.99
- Rent YoY
- ▲ 0.95%
- Metro
- Atlanta-Sandy Springs-Alpharetta, GA
- State GDP YoY
- ▲ 2.66%
- F500 in state
- 28
Industry mix (Fortune 500 HQ in GA)
| Industry | F500 HQs | Revenue |
|---|---|---|
| Paper / Packaging | 2 | $29B |
|
||
| Retail | 1 | $160B |
|
||
| Transportation / Logistics | 1 | $91B |
|
||
| Airlines | 1 | $62B |
|
||
| Consumer Goods | 1 | $47B |
|
||
| Utilities | 1 | $25B |
|
||
Price history
+293.8% since first listed9 events — show timeline
- 2026-06-09 Listed $189,000 GAMLS
- 2011-05-06 Listing Removed — FMLS
- 2011-04-28 Sold (MLS) $14,500 FMLS
- 2011-04-06 Pending — FMLS
- 2011-03-22 Pending — FMLS
- 2011-03-02 Listed $14,000 FMLS
- 1994-01-01 Sold (Public Records) $43,000 Public Records
- 1987-05-26 Sold (Public Records) $48,000 Public Records
- 1986-12-04 Sold (Public Records) $48,000 Public Records
Property tax history
+14.6%/yrLatest (2025): $3,232 · -9.6% YoY. Source: county tax records.
Cash-flow waterfall
monthlySold comps — $/sqft
last 12 mo · ≤1 miLoading sold comps…