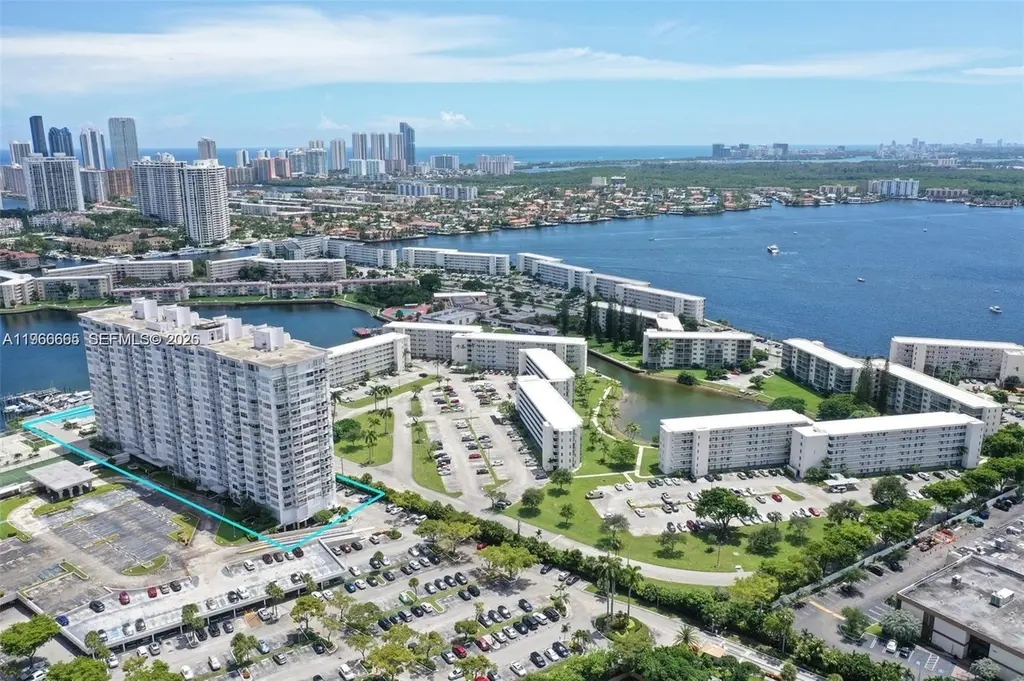
18031 Biscayne Blvd #1601 · Aventura, FL
Flood risk 8/10 · Major
- FEMA flood zone
- AE
- Chance of flooding over 30 yrs
- 0.96%
- Est. flood insurance / yr
- $1,737 – $8,500
Fire risk 1/10 · Minimal
- Est. fire insurance / yr
- $947 – $1,759
Heat risk 10/10 · Severe
- Hot days now (above 104°F)
- 7 days/yr
- Hot days in 30 yrs
- 28 days/yr
Wind risk 10/10 · Severe
- Chance of severe wind over 30 yrs
- 99.0%
Air-quality risk 2/10 · Minimal
- Unhealthy air days now
- 1 days/yr
- Unhealthy air days in 30 yrs
- 2 days/yr
Risk factors via First Street. Map © Google.
Why this score? — see what drove the D+ grade
The composite is a weighted blend of 9 inputs, each scored 0–100. Each bar is that input's sub-score; the figure is the points it added to the 100-point composite (weight × sub-score).
- Cash flow +12.0/30.0
- 1% rule +8.2/10.0
- ARV discount +7.5/15.0
- Appreciation +5.3/10.0
- Schools +4.2/10.0
- Livability +4.0/5.0
- DSCR +3.5/10.0
- Rent growth +2.7/5.0
- Condition / age +2.5/5.0
$325,000
🖨 Deal sheet 📄 Offer letter ✓ Due diligence
Listing remarks
Deal of the Year in Aventura! Completely upgraded and truly one-of-a-kind 3-bedroom, 2-bath residence located on the 16th floor, offering breathtaking panoramic views of the ocean, Intracoastal, and lake. This sun-filled unit features floor-to-ceiling windows, beautiful porcelain tile flooring throughout, granite countertops, frameless shower enclosures. Enjoy two private balconies and a rare double-exposure North-to-South layout that fills the home with natural light all day. Full-service amenities include: HOA covers wifi and cable , also they provide a contract for the appliances and plumbing and basic electrical repairs for free. Tennis courts Two swimming pools State-of-the-art gym o
Key facts
- Private balconies
- Panoramic views
- Private entrance
Tags
Property features AI
Finance
- Other: Association pool is heated
- Financial info: Pets allowed with restrictions or possible restrictions
- HOA & community: Monthly association fee; Association fee includes management, amenities, common areas, cable TV, insurance, internet, structure maintenance, parking, pest control, pool(s), sewer, security, and water; Association amenities include boat dock, billiard room, marina, bike storage, cabana, clubhouse, library, pool, sauna, storage, tennis courts, trash service, and elevators
Exterior
- Parking: Covered detached garage with one space and garage door opener
- Security: Doorman; Key card entry; Complex fenced
- Utilities: Cable not available
- Home design: Condominium in a high-rise building; 20 total stories; Entry on 16th floor; Updated / remodeled; Waterfront property with bay front, intracoastal access, and lake front; no fixed bridges; Has view
- Construction: Block construction
- Exterior features: Barbecue area; Fenced complex; Tennis courts; Exterior lighting; Association pool (heated); Boat dock; Marina; Cabana; Clubhouse; Sauna; Storage; Trash service; Elevators
Interior
- Kitchen: Dishwasher; Electric range; Microwave; Refrigerator; Self-cleaning oven; Kitchen island; Eat-in kitchen; Breakfast area
- Bedrooms: Includes den
- Flooring: Ceramic tile; Tile
- Bathrooms: 2 full bathrooms
- Heating & cooling: Central heating (electric); Central air (electric)
- Interior features: Bedroom on main level; Breakfast area; Eat-in kitchen; Elevator; First floor entry; Garden tub / Roman tub; Kitchen island; Living / dining room; Split bedrooms; Tub with shower; Bar; Walk-in closets
- Laundry & utility: Storage room
Neighborhood map
What this means for you Summary
Snapshot
- This is a 2-bed/2.0-bath condo listed at $325k.
Deal economics
- At list price, monthly cash flow is $-504 ($-6k/yr) — negative.
- To cash-flow at today's rent, offer at most $236k (27.4% below list).
- Meets the 1% rule at list price ($4k rent vs $325k).
- Recommended offer: $236k (27.4% below list) — sets the bar for cash-flow.
- Cap rate 6.0% vs local median 2.6% in Aventura — top-decile yield for the area; either an underpriced asset or a hidden risk that comps aren't pricing in. Stress-test before assuming the spread holds.
Location & tenants
- Location reads 80/100 on livability (#127 in FL, #1,834 nationally) — a professional / high-income tenant draw. Strengths: schools A+, health & safety A+, amenities A; Watch: crime D+, cost of living F.
- Miami-Dade (suburban): math 45% / reading 54% proficiency, ranked #40 of 73 in FL (top 55%) — families likely to look elsewhere, expect single-tenant / working-renter base with shorter leases; 64% free/reduced lunch — lower-income household profile, screen leases tightly.
- Market conditions: Rents flat; 1870 active listings in the ZIP; 10,051 units permitted in Miami-Dade County in 2024 (7,758 in 5+ unit buildings).
- At $4,287/mo this rent would consume 77% of the median local household income ($67k/yr) (locally 3106% of renters already pay >50% of income on rent) — very limited rent-growth headroom before tenants either downsize or default.
Forward outlook
- In year one you build about $4k of equity ($2k loan paydown + $2k appreciation (0.5% local appreciation)).
- Miami-Dade County population projected at +28% by 2050 — long-run rental-demand tailwind backs the buy-and-hold thesis.
- By year 8, paydown + projected appreciation supports a ~$34k cash-out refi (75% LTV) — recoverable capital for the next deal without selling this one.
Negotiation context
- It's been on market 92 days — a 9% lower offer ($296k) is reasonable based on typical stale-listing flexibility.
- 4 sale attempts; this cycle's ask is 17468% above the opening price — seller raised mid-cycle; expect resistance to lowballs.
- Current owner paid $266k; 22% above their basis — modest negotiation headroom, anchor on the comps not their cost.
Risks & watch-outs
- Watch-outs: flood insurance adds $427/mo; HOA is 30% of rent.
- Climate carrying-cost: in FEMA flood zone AE (mandatory federal flood insurance); severe wind risk, 99% chance of damaging wind over 30y; extreme-heat days projected 7→28/yr by 2055 (HVAC capex compounding) — expect insurance premiums to compound above CPI over the hold.
Questions for the listing agent
- What do current leases actually rent for vs. the listed asking? Can we see a recent rent roll and the last 12 months of T-12 income?
- It's been on market 92 days. Have you received any prior offers? Is the seller open to a 27% concession, seller financing, or rate buy-down credit?
- Built in 1971 — when were the roof, HVAC, electrical panel, plumbing, and water heater last replaced?
- What's the actual annual flood-insurance premium (NFIP or private), and is the property in a SFHA with mandatory coverage?
- What does the HOA fee cover, when was the last increase, and are there any pending special assessments or reserve-fund shortfalls?
- Any open or pending special assessments — roof, HVAC, plumbing, elevator, façade? What's the per-unit balance and payoff schedule, and is the seller paying it off at close or rolling it to the buyer?
- Why hasn't it sold? Are there any deal-killer items the seller is aware of (foundation, flood, title, zoning, code violations)?
- Is there a deadline driving the sale (1031 exchange, divorce, estate, relocation)? That informs how much negotiation room exists.
- Schools are A-rated — typically a magnet for longer-tenancy family renters. What's the average tenant stay here, and is there a school-zone premium baked into asking?
- Crime grade is D in this area — have there been break-ins, vandalism, or insurance claims at this property in the last 3 years? What carrier currently insures it and at what premium?
- The area grade is low — what's the realistic commute time and amenity access for the typical tenant pool here? Any planned neighborhood developments (good or bad) we should know about?
- What's the average days-on-market for RENTAL listings here right now (not sales)? A rising rental-DOM trend means longer vacancies and softer asking-rent achievability than the comps imply.
- What's the recent tenant-quality profile in this submarket — average credit score on applications, eviction rate, late-payment / NSF rate, and stable-employment percentage? A property-management company in the area should have these aggregated.
- How much new apartment / multifamily construction is in the pipeline within 1–3 miles? Heavy new supply (>2% of stock underway) typically softens rents 12–24 months out; light construction supports rent growth.
Investment metrics
- 1% rule
- 1.32% ✓
- Cap rate
- 6.01%
- Cash-on-cash
- -1.02%
- DSCR
- 0.95
- GRM
- 6.3
CMA / ARV
No comps found within radius.
Projected returns pro-forma
0.53% appreciation · 0.94% rent growth · sell at horizon
- IRR
- -9.5%
- Equity multiple
- 0.55×
- Total profit
- $-41,097
- Equity at exit
- $103,023
- IRR
- -5.6%
- Equity multiple
- 0.40×
- Total profit
- $-54,984
- Equity at exit
- $130,973
Cash invested: $91,000 (down + closing). Projections, not guarantees.
Landlord ↔ Tenant lean methodology
- Overall (STATE)
- 87 Strongly Landlord-Friendly
- State Florida
- 87 Strongly Landlord-Friendly · R+3
- County
- — inherits STATE
- City
- — inherits STATE
ZIP-level market 33160
- Home prices YoY
- 0.2%
- Rents YoY
- 0.9%
- Active inventory
- 1870
- Price-to-rent
- 6.3×
Monthly cashflow live
- Estimated rent
- $4,287 medium interval (Pro) →
- Mortgage (P&I)
- −$1,704
- Tax from tax record
- −$341 /mo · $4,093/yr
- Insurance
- −$135
- Flood insurance flood zone
- −$427 /mo · $5,118/yr
- HOA
- −$1,283
- Vacancy / Maint / Mgmt
- −$900
- Net cashflow
- $-504
Break-even live
UW: 25.0% down · 7.5% · 30yr · 1.5% tax · 5.0% vac · 8.0% maint · 8.0% mgmt
Financing live
Cash to close
- Down payment
- $81,250
- Closing costs
- $9,750
- Reserves months
- —
- Total cash needed
- —
Loan-product check · same deal, 3 products live
Conventional
25% down · 7.5% · 30yr
- Down + closing
- —
- Monthly P&I
- —
- Monthly cashflow
- —
- DSCR
- —
- Eligible?
- —
Personal DTI + credit; lowest rate.
DSCR
20% down · 8.5% · 30yr
- Down + closing
- —
- Monthly P&I
- —
- Monthly cashflow
- —
- DSCR
- —
- Eligible?
- —
No personal income docs; deal must DSCR.
Hard money
10% down · 12.0% · 12mo
- Down + closing
- —
- Monthly P&I
- —
- Monthly cashflow
- —
- DSCR
- —
- Eligible?
- —
Short-term bridge; refi at stabilization.
HOA detail condo
- Monthly dues
- $1,283 · $15,396/yr
- Likely covers
- electricinternetcablepoolgym
- Assessments
- None detected in remarks — confirm with the listing agent.
Listing history 24 events
-
2026-06-18days on market $325,000 Active 92 DOM
-
2026-06-17days on market $325,000 Active 91 DOM
-
2026-06-16days on market $325,000 Active 90 DOM
-
2026-06-15days on market $325,000 Active 89 DOM
-
2026-06-13days on market $325,000 Active 87 DOM
-
2026-06-09days on market $325,000 Active 83 DOM
-
2026-06-08days on market $325,000 Active 82 DOM
-
2026-06-07days on market $325,000 Active 81 DOM
-
2026-06-04days on market $325,000 Active 78 DOM
-
2026-06-03days on market $325,000 Active 77 DOM
-
2026-06-02days on market $325,000 Active 76 DOM
-
2026-06-01days on market $325,000 Active 75 DOM
-
2026-05-31days on market $325,000 Active 74 DOM
-
2026-04-15historical $1,750
-
2026-04-02price $1,750
-
2026-03-14$1,850
-
2026-02-16$325,000 Active
-
2026-01-01historical $1,850
-
2025-12-05$1,850
-
2025-11-05historical $1,850
-
2025-10-21price $1,850
-
2025-09-16$1,900
-
2005-07-15soldstatus $266,000
-
1975-03-01soldstatus $42,000
ⓘ Source: listings_history table (triggers on properties + properties_extension) + one-shot
backfill from property_details.listing_events for pre-trigger history.
Tax reassessment forecast FL · Resets to sale price
- Current annual tax
- $4,093 · $341/mo
- Projected year-2 tax
- $4,093 · $341/mo
- Expected delta
- $0/yr ($0/mo · 0.0%)
ⓘ Screening estimate from a state-policy table — verify with the county assessor before closing.
Climate risk First Street
- Flood 8/10 Severe FEMA zone AE · 96% chance over 30 yrs
- Wildfire 1/10 Low
- Heat 10/10 Extreme 7 d/yr ≥104°F today · 28 d/yr by 30 yrs out
- Wind 10/10 Extreme 99% chance of damaging wind over 30 yrs
- Air quality 2/10 Low 1 unhealthy d/yr today · 2 by 30 yrs out
Nearby sold comps map
Loading sold comps map…
Walkable amenities ~0.75 mi
Loading nearby amenities…
Taxation est. · year 1
- Rental income
- $51,440
- − Mortgage interest
- −$18,205
- − Property taxes
- −$4,093
- − Insurance
- −$6,744
- − Repairs & maintenance
- −$4,115
- − Management
- −$4,115
- − HOA
- −$15,396
- − Depreciation
- −$9,455
- Taxable loss
- −$10,682
- Est. tax savings @ 24.0%
- +$2,564
- After-tax cash flow
- $-3,483/yr
For passive investors: Depreciation is non-cash, so a rental often shows a tax loss while cash-flowing — sheltering income. Rental losses are passive: they offset passive income freely, and up to $25,000/yr can offset ordinary (W-2) income if you actively participate and your MAGI is under $100k (phasing out to $0 by $150k); unused losses carry forward. On sale, claimed depreciation is recaptured at up to 25%, and gains may owe capital-gains tax (a 1031 exchange can defer both). Figures are a year-1 estimate at your 24.0% rate — not tax advice; consult a CPA.
Schools (NCES district)
- District
- Miami-Dade
- NCES district ID
- 1200390
- Math proficiency
- 45% ▼ -16.00%
- Reading proficiency
- 54% ▼ -5.00%
- Median HH income
- $43,928
- Composite
- 41.76/100
- National rank
- #3397
- State rank
- #40 of 73 in FL
Livability — Aventura
- Score
- 80/100
- State rank
- #127
- US rank
- #1834
Category grades
Schools grade is shown separately in the Schools card above.
Census & demographics
- Census place
- Aventura, FL
- County
- Miami-Dade County · 2,697,751 people
- City population
- 34,147
- Metro
- Miami-Fort Lauderdale-Pompano Beach, FL
- Population (ZIP)
- 43,718
- Household income
- $67,040
- Rent vs Own
- Severe rent burden
- 3106.0
Population outlook (Miami-Dade County) Hauer SSP2
- Today (2025)
- 3,126,439 people
- By 2030
- 3,325,765 · +6.4%
- By 2040
- 3,697,561 · +18.3%
- By 2050
- 4,012,134 · +28.3%
- By 2075
- 4,605,612 · +47.3%
- By 2100
- 4,866,598 · +55.7%
Race, ethnicity, and origin ACS 2023
- Neighborhood character
- Diverse neighborhood (Simpson 0.59)
- Race & ethnicity
- Hispanic / Latino 46% White 44% Two or more races 27% Black 4% Asian 2%
- Hispanic origin (detail)
- Mexican 1% Puerto Rican 3% Cuban 8% Dominican 1% Salvadoran 4%
- Common ancestry
- Scotch-Irish 8% Hispanic 3% Subsaharan African 3%
- Foreign-born
- 61% · Canada, Jamaica, Dominican Republic
- Languages at home
- 29% English-only · Spanish 45% Russian/Polish/Slavic 12% Other Indo-European 5%
Political lean MEDSL · Miami-Dade
- 2024 margin
- R (+11.4) · D 43.9% · R 55.4%
- 2008→2024 swing
- -27.6pp toward R · 2008: 16.1pp · 2024: -11.4pp
- All cycles
- 2024: R+11.4 2020: D+7.3 2016: D+29.6 2012: D+23.7 2008: D+16.1
Not yet ingested
- Civics
- —
Market trends
- HPI YoY
- ▲ 0.53%
- Current HPI
- 284.9293
- Rent YoY
- ▲ 0.94%
- Metro
- Miami-Fort Lauderdale-Pompano Beach, FL
- State GDP YoY
- ▲ 3.28%
- F500 in state
- 36
Industry mix (Fortune 500 HQ in FL)
| Industry | F500 HQs | Revenue |
|---|---|---|
| Industrial Technology | 2 | $29B |
|
||
| Insurance | 2 | $17B |
|
||
| Retail | 1 | $60B |
|
||
| Technology Distribution | 1 | $58B |
|
||
| Homebuilding | 1 | $35B |
|
||
| Technology Manufacturing | 1 | $35B |
|
||
Price history
-95.8% since first listed11 events — show timeline
- 2026-04-15 Rental Removed $1,750 MARMLS
- 2026-04-02 Price Changed $1,750 MARMLS
- 2026-03-14 Listed for Rent $1,850 MARMLS
- 2026-02-16 Listed $325,000 MARMLS
- 2026-01-01 Rental Removed $1,850 MARMLS
- 2025-12-05 Listed for Rent $1,850 MARMLS
- 2025-11-05 Rental Removed $1,850 MARMLS
- 2025-10-21 Price Changed $1,850 MARMLS
- 2025-09-16 Listed for Rent $1,900 MARMLS
- 2005-07-15 Sold (Public Records) $266,000 Public Records
- 1975-03-01 Sold (Public Records) $42,000 Public Records
Property tax history
+5.1%/yrLatest (2025): $4,093 · +1.8% YoY. Source: county tax records.
Cash-flow waterfall
monthlySold comps — $/sqft
last 12 mo · ≤1 miLoading sold comps…