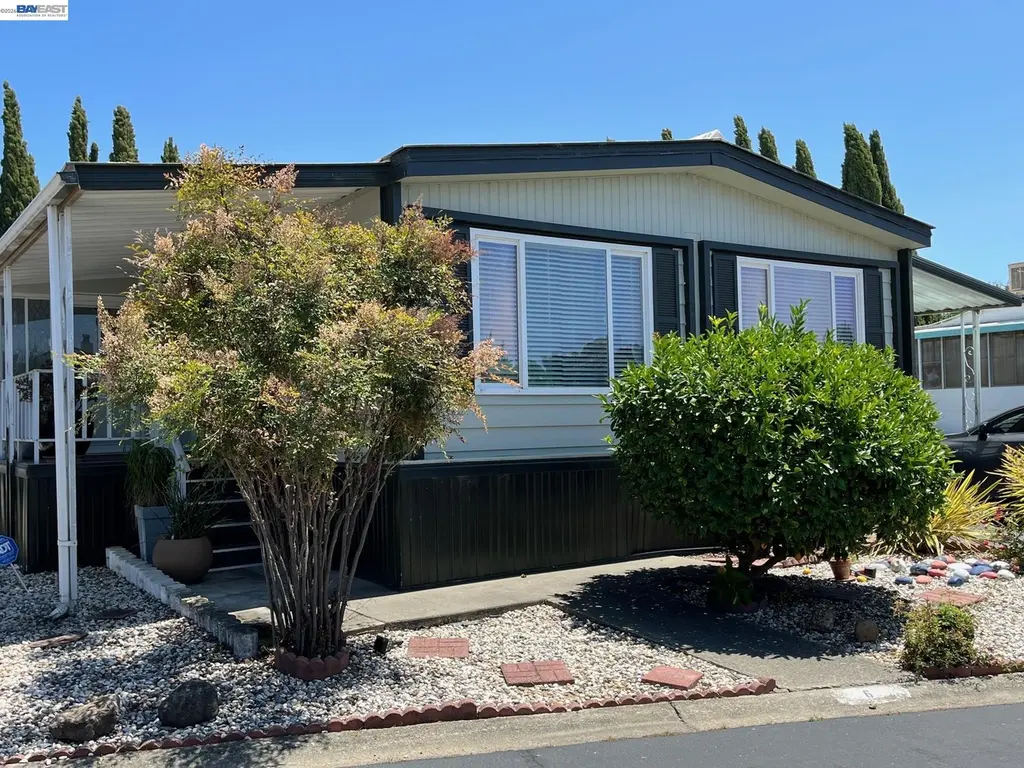
711 Old Canyon Rd #6 · Fremont, CA
Flood risk 1/10 · Minimal
- FEMA flood zone
- X (unshaded)
- Chance of flooding over 30 yrs
- 0.0%
- Est. flood insurance / yr
- $507 – $1,088
Fire risk 5/10 · Moderate
- Est. fire insurance / yr
- $659 – $1,223
Heat risk 4/10 · Minor
- Hot days now (above 92°F)
- 7 days/yr
- Hot days in 30 yrs
- 15 days/yr
Wind risk 1/10 · Minimal
- Chance of severe wind over 30 yrs
- —
Air-quality risk 8/10 · Major
- Unhealthy air days now
- 13 days/yr
- Unhealthy air days in 30 yrs
- 16 days/yr
Risk factors via First Street. Map © Google.
Why this score? — see what drove the B grade
The composite is a weighted blend of 9 inputs, each scored 0–100. Each bar is that input's sub-score; the figure is the points it added to the 100-point composite (weight × sub-score).
- Cash flow +30.0/30.0
- 1% rule +10.0/10.0
- DSCR +10.0/10.0
- Schools +7.3/10.0
- ARV discount +5.5/15.0
- Livability +4.2/5.0
- Rent growth +3.5/5.0
- Condition / age +2.5/5.0
- Appreciation +0.0/10.0
$194,000
🖨 Deal sheet (PDF) 📄 Offer letter ✓ Due diligence
Listing remarks MLS
This 2 Bedroom/2 Bath home features a light-filled floor plan with a large, open living room and dining room with built-in hutch. Enjoy extra space off the family room with bonus room New Plank flooring and fresh paint throughout. Brand-new stainless-steel appliances including dishwasher stovetop refrigerator and wall oven Enjoy the beautiful, panoramic view of the rolling hills of Niles Canyon. Carport will easily accommodate 2 cars. Storage shed and beautifully maintained front and backyards. Located in the highly desirable Niles Canyon Mobile Home Estates…a lovely senior 55+ park that offers a year-round heated community pool, clubhouse, sauna & spa, plus many community activities. Fabulously located just minutes to downtown Niles!
Key facts
- Newer appliances
- Abundant cabinetry
- Built-in hutch
Tags
Property features AI
Finance
- HOA & community: Senior community; Clubhouse; Community pool; Pets allowed with number/size limits and upon approval; Park name: NILES CANYON MHP
Exterior
- Parking: Carport for 2 or more vehicles; Guest parking
- Utilities: Public water; Public sewer
- Home design: Manufactured home in park (mobile home); Double-wide model (Villa West)
- Construction: Metal siding; Built as a double-wide mobile home
- Exterior features: Back yard; Deck; Rear porch; Shed(s)
Interior
- Kitchen: Dishwasher; Gas range / cooktop; Built-in oven; Refrigerator; Disposal; Breakfast nook; Solid surface counters
- Bedrooms: 2 bedrooms
- Flooring: Laminate flooring
- Bathrooms: 2 full bathrooms; Primary bathroom with stall shower and double vanity; Shower over tub in other bathroom(s)
- Heating & cooling: Forced air heating; Central air conditioning
- Interior features: Breakfast nook; Solid surface counters; Dining area; Family room; Florida / screen room; Double-pane windows
- Laundry & utility: Laundry room with washer and dryer; Laundry cabinets; Gas water heater
Neighborhood map
What this means for you Summary
Snapshot
- This is a 2-bed/2.0-bath manufactured listed at $194k.
Deal economics
- At list price, monthly cash flow is $1k ($16k/yr) — positive.
- The deal already cash-flows at list — no discount required.
- Meets the 1% rule at list price ($3k rent vs $194k).
- Cap rate 14.8% vs local median 1.2% in Fremont — top-decile yield for the area; either an underpriced asset or a hidden risk that comps aren't pricing in. Stress-test before assuming the spread holds.
Location & tenants
- Location reads 85/100 on livability (#10 in CA, #561 nationally) — a professional / high-income tenant draw. Strengths: amenities A+, commute A+, employment A+; Watch: cost of living F.
- Fremont Unified (suburban): math 76% / reading 84% proficiency, ranked #23 of 517 in CA (top 4%) — strong family-tenant draw, lease renewals of 3-5y typical; only 15% free/reduced lunch — higher-income household profile.
- Zoned schools: Vallejo Mill Elementary (403 students, 25% FRL); Centerville Junior High (946 students, 30% FRL); Washington High (math 61% / reading 74%, grade B, #137 of 1,170 statewide, top 12%, 1,931 students, 27% FRL).
- Zoned-school proficiency averages 68% at this address vs 80% district-wide (-12 pts) — the specific schools serving this property underperform the Fremont Unified average; the district grade overstates school quality for this exact location.
- Market conditions: Rents rising (+3.8%/yr); 173 active listings in the ZIP; 20 comparable units currently listed for rent nearby; rentals leasing fast (median 12d on market — plan ~1-2 weeks tenant-placement turnaround); high-income renter base; 1,742 units permitted in Alameda County in 2024 (856 in 5+ unit buildings).
Forward outlook
- Local home prices are declining (-3.0%/yr); year-one equity from $1k of loan paydown is wiped out by about $6k of value loss. Plan a longer hold.
- Alameda County population projected at +34% by 2050 — long-run rental-demand tailwind backs the buy-and-hold thesis.
- At projected returns (-3.0% appreciation + 3.8% rent growth), your $54k cash investment doubles in ~4 years — after that, you're playing with house money.
Negotiation context
- Only 9 days on market — expect competitive offers; lowballing is unlikely to land.
- 3 sale attempts since 25y ago with the ask held roughly flat each time — persistent listings suggest the price (not the market) is what's stuck; bring a comps-based counter.
Risks & watch-outs
- Climate carrying-cost: moderate wildfire risk — expect insurance premiums to compound above CPI over the hold.
Questions for the listing agent
- Built in 1975 — when were the roof, HVAC, electrical panel, plumbing, and water heater last replaced?
- Is there a deadline driving the sale (1031 exchange, divorce, estate, relocation)? That informs how much negotiation room exists.
- Schools are A-rated — typically a magnet for longer-tenancy family renters. What's the average tenant stay here, and is there a school-zone premium baked into asking?
- What's the average days-on-market for RENTAL listings here right now (not sales)? A rising rental-DOM trend means longer vacancies and softer asking-rent achievability than the comps imply.
- What's the recent tenant-quality profile in this submarket — average credit score on applications, eviction rate, late-payment / NSF rate, and stable-employment percentage? A property-management company in the area should have these aggregated.
- How much new for-sale + rental construction is in the pipeline within 1–3 miles? Heavy new supply typically softens prices + rents 12–24 months out; constrained supply supports both.
Investment metrics
- 1% rule
- 1.77% ✓
- Cap rate
- 14.80%
- Cash-on-cash
- 30.37%
- DSCR
- 2.35
- GRM
- 4.7
CMA / ARV
- ARV (on-the-fly)
- $185,712
- Comps found
- 12
Show comp detail 12 sales within ~0.75 mi
| Address | Dist | Beds/Ba | Sqft | Sold | Price | $/sf | Match |
|---|---|---|---|---|---|---|---|
| 711 Old Canyon Rd #103 | 0.00mi | 3/2.0 (+1) | 1,308 (+3%) | 2mo | $300,000 | $229 | 89 |
| 711 Old Canyon Rd #33 | 0.00mi | 2/2.0 | 1,344 (+6%) | 3mo | $193,000 | $144 | 88 |
| 711 Old Canyon Rd #47 | 0.00mi | 2/2.0 | 1,344 (+6%) | 6mo | $195,000 | $145 | 85 |
| 711 Old Canyon Rd #147 | 0.08mi | 2/2.0 | 1,248 (-2%) | 12mo | $99,000 | $79 | 84 |
| 711 Old Canyon Rd #81 | 0.08mi | 2/2.0 | 1,368 (+8%) | 1mo | $120,000 | $88 | 83 |
| 711 Old Canyon Rd #97 | 0.08mi | 2/2.0 | 1,340 (+5%) | 9mo | $138,500 | $103 | 80 |
| 711 Old Canyon Rd #74 | 0.00mi | 2/2.0 | 1,344 (+6%) | 15mo | $300,000 | $223 | 78 |
| 711 Old Canyon Rd #176 | 0.00mi | 2/2.0 | 1,120 (-12%) | 2mo | $272,000 | $243 | 78 |
| 711 Old Canyon Rd #8 | 0.00mi | 3/2.0 (+1) | 1,248 (-2%) | 21mo | $220,000 | $176 | 74 |
| 711 Old Canyon Rd #169 | 0.00mi | 2/2.0 | 1,440 (+13%) | 8mo | $210,000 | $146 | 72 |
| 711 Old Canyon Rd #43 | 0.00mi | 3/2.0 (+1) | 1,380 (+8%) | 16mo | $275,000 | $199 | 67 |
| 711 Old Canyon Rd #26 | 0.00mi | 2/2.0 | 1,440 (+13%) | 14mo | $199,000 | $138 | 67 |
Match score weights: distance 35% · size 25% · config 20% · recency 20%. Top-matched comps best support the ARV.
Projected returns pro-forma
-3.0% appreciation · 3.83% rent growth · sell at horizon
- IRR
- 26.0%
- Equity multiple
- 2.09×
- Total profit
- $59,058
- Equity at exit
- $28,926
- IRR
- 34.2%
- Equity multiple
- 4.25×
- Total profit
- $176,447
- Equity at exit
- $16,774
Cash invested: $54,320 (down + closing). Projections, not guarantees.
Landlord ↔ Tenant lean methodology
- Overall (STATE)
- 18 Strongly Tenant-Friendly
- State California
- 18 Strongly Tenant-Friendly · D+13
- County
- — inherits STATE
- City
- — inherits STATE
ZIP-level market 94536
- Rents YoY
- 3.8%
- Active inventory
- 173
- Price-to-rent
- 4.7×
Monthly cashflow live
- Estimated rent
- $3,437 high interval (Pro) →
- Mortgage (P&I)
- −$1,017
- Tax est. 1.5%
- −$242 /mo · $2,910/yr
- Insurance
- −$81
- HOA
- −$0
- Vacancy / Maint / Mgmt
- −$722
- Net cashflow
- $1,375
Break-even live
Sensitivity live
| Price | -10% $1,509 | -5% $1,442 | +0% $1,375 | +5% $1,308 | +10% $1,241 |
|---|---|---|---|---|---|
| Rent | -10% $1,103 | -5% $1,239 | +0% $1,375 | +5% $1,510 | +10% $1,646 |
| Rate | -1.0pp $1,472 | -0.5pp $1,424 | base $1,375 | +0.5pp $1,324 | +1.0pp $1,273 |
UW: 25.0% down · 7.5% · 30yr · 1.5% tax · 5.0% vac · 8.0% maint · 8.0% mgmt
Financing live
Cash to close
- Down payment
- $48,500
- Closing costs
- $5,820
- Reserves months
- —
- Total cash needed
- —
Loan-product check · same deal, 3 products live
Conventional
25% down · 7.5% · 30yr
- Down + closing
- —
- Monthly P&I
- —
- Monthly cashflow
- —
- DSCR
- —
- Eligible?
- —
Personal DTI + credit; lowest rate.
DSCR
20% down · 8.5% · 30yr
- Down + closing
- —
- Monthly P&I
- —
- Monthly cashflow
- —
- DSCR
- —
- Eligible?
- —
No personal income docs; deal must DSCR.
Hard money
10% down · 12.0% · 12mo
- Down + closing
- —
- Monthly P&I
- —
- Monthly cashflow
- —
- DSCR
- —
- Eligible?
- —
Short-term bridge; refi at stabilization.
Rent comps 20 comps
| Address | Beds | Baths | Sqft | Rent | $/sqft | DOM | Units | Dist |
|---|---|---|---|---|---|---|---|---|
| 38352 Timpanogas Cir Fremont, CA | 3.0 | 2.0 | 1250 | $3,350 | $2.68 | 12d | 1 | 0.19mi |
| 38451 Goodrich Way Fremont, CA | 3.0 | 2.0 | 1170 | $3,600 | $3.08 | 45d | 1 | 0.26mi |
| 37847 Niles Blvd Apt 10 Fremont, CA | 2.0 | 1.0 | 900 | $2,400 | $2.67 | 45d | 1 | 0.48mi |
| 38776 Crane Ter Fremont, CA | 3.0 | 2.5 | 1534 | $3,750 | $2.44 | 4d | 1 | 0.63mi |
| 38738 Aurora Ter Fremont, CA | 2.0 | 1.5 | 1123 | $3,296 | $2.93 | 12d | 1 | 0.65mi |
| 37565 2nd St Fremont, CA | 3.0 | 2.0 | 1704 | $4,095 | $2.40 | 19d | 1 | 0.75mi |
| 37565 2nd St Fremont, CA | 3.0 | 2.0 | 1704 | $4,095 | $2.40 | 7d | 1 | 0.75mi |
| 38593 Royal Ann Cmn Fremont, CA | 3.0 | 1.5 | 1180 | $3,609 | $3.06 | 26d | 1 | 0.75mi |
| 38605 Royal Ann Cmn Unit 38605 Fremont, CA | 3.0 | 1.5 | 1180 | $3,250 | $2.75 | 45d | 1 | 0.77mi |
| 562 Lambert Ter Fremont, CA | 3.0 | 2.0 | 1540 | $3,940 | $2.56 | 14d | 1 | 0.91mi |
| 38862 Cherry Glen Cmn Fremont, CA | 2.0 | 2.0 | 1168 | $3,400 | $2.91 | 21d | 1 | 1.08mi |
| 38862 Cherry Glen Cmn Fremont, CA | 2.0 | 2.0 | 1168 | $3,400 | $2.91 | 20d | 1 | 1.08mi |
| 1043 Bonner Ave Fremont, CA | 3.0 | 2.0 | 1532 | $4,500 | $2.94 | 45d | 1 | 1.13mi |
| 1031 Walnut Ave Fremont, CA | 1.0–3.0 | 1.0–2.0 | 1082 | $4,592 | $4.24 | 0d | 41 | 1.22mi |
| 1440 Mowry Ave Fremont, CA | 1.0–3.0 | 1.0–2.0 | 990 | $3,222 | $3.26 | 0d | 3 | 1.25mi |
| 38680 Waterside Cir Fremont, CA | 1.0–2.0 | 1.0–2.0 | 990 | $3,281 | $3.31 | 0d | 6 | 1.30mi |
| 1001 Beethoven Cmn Fremont, CA | 1.0–3.0 | 1.0–3.0 | 1059 | $3,150 | $2.97 | 0d | 11 | 1.36mi |
| 282 Lindero Ter Fremont, CA | 3.0 | 1.5 | 1440 | $3,950 | $2.74 | 4d | 1 | 1.36mi |
| 39451 Gallaudet Dr Fremont, CA | 1.0–2.0 | 1.0–2.0 | 906 | $3,479 | $3.84 | 0d | 14 | 1.45mi |
| 2000 Walnut Ave Fremont, CA | 1.0–2.0 | 1.0–2.0 | 920 | $4,071 | $4.42 | 0d | 13 | 1.46mi |
Listing history 7 events
-
2026-06-21days on market $194,000 Active 9 DOM
-
2026-06-18days on market $194,000 Active 6 DOM
-
2026-06-17days on market $194,000 Active 5 DOM
-
2026-06-16days on market $194,000 Active 4 DOM
-
2026-06-15days on market $194,000 Active 3 DOM
-
2026-06-13remarks 699-char remark
-
2026-06-13$194,000 Active 1 DOM
ⓘ Source: listings_history table (triggers on properties + properties_extension) + one-shot
backfill from property_details.listing_events for pre-trigger history.
Climate risk First Street
- Flood 1/10 Low FEMA zone X (unshaded) · 0% chance over 30 yrs
- Wildfire 5/10 Major
- Heat 4/10 Moderate 7 d/yr ≥92°F today · 15 d/yr by 30 yrs out
- Wind 1/10 Low
- Air quality 8/10 Severe 13 unhealthy d/yr today · 16 by 30 yrs out
Nearby sold comps map
Loading sold comps map…
Walkable amenities ~0.75 mi
Loading nearby amenities…
Taxation est. · year 1
- Rental income
- $41,245
- − Mortgage interest
- −$10,867
- − Property taxes
- −$2,910
- − Insurance
- −$970
- − Repairs & maintenance
- −$3,300
- − Management
- −$3,300
- − Depreciation
- −$5,644
- Taxable income
- $14,255
- Est. tax owed @ 24.0%
- −$3,421
- After-tax cash flow
- $13,074/yr
For passive investors: Depreciation is non-cash, so a rental often shows a tax loss while cash-flowing — sheltering income. Rental losses are passive: they offset passive income freely, and up to $25,000/yr can offset ordinary (W-2) income if you actively participate and your MAGI is under $100k (phasing out to $0 by $150k); unused losses carry forward. On sale, claimed depreciation is recaptured at up to 25%, and gains may owe capital-gains tax (a 1031 exchange can defer both). Figures are a year-1 estimate at your 24.0% rate — not tax advice; consult a CPA.
Schools (NCES district)
- District
- Fremont Unified
- NCES district ID
- 0614400
- Math proficiency
- 76% ▲ 3.00%
- Reading proficiency
- 84% ▲ 6.00%
- Median HH income
- $105,489
- Composite
- 72.94/100
- National rank
- #191
- State rank
- #23 of 517 in CA
Livability — Fremont
- Score
- 85/100
- State rank
- #10
- US rank
- #561
Category grades
Schools grade is shown separately in the Schools card above.
Census & demographics
- Census place
- Fremont, CA
- County
- Alameda County · 1,614,355 people
- City population
- 228,297
- Metro
- San Francisco-Oakland-Berkeley, CA
- Population (ZIP)
- 70,619
- Household income
- $167,662
- Rent vs Own
- Severe rent burden
- 2414.0
Population outlook (Alameda County) Hauer SSP2
- Today (2025)
- 1,928,884 people
- By 2030
- 2,069,146 · +7.3%
- By 2040
- 2,338,405 · +21.2%
- By 2050
- 2,586,608 · +34.1%
- By 2075
- 3,061,911 · +58.7%
- By 2100
- 3,234,133 · +67.7%
Race, ethnicity, and origin ACS 2023
- Neighborhood character
- Diverse neighborhood (Simpson 0.66)
- Race & ethnicity
- Asian 51% White 24% Hispanic / Latino 16% Two or more races 9% Black 4%
- Hispanic origin (detail)
- Mexican 12%
- Common ancestry
- Russian 2% Lithuanian 1% Slovak 1%
- Foreign-born
- 44% · China, Canada, Vietnam
- Languages at home
- 45% English-only · Other Indo-European 17% Chinese 11% Spanish 10%
Political lean MEDSL · Alameda
- 2024 margin
- Solid D (+53.6) · D 74.6% · R 21.0% · Other 4.4%
- 2008→2024 swing
- -5.9pp toward R · 2008: 59.5pp · 2024: 53.6pp
- All cycles
- 2024: D+53.6 2020: D+62.5 2016: D+64.4 2012: D+59.8 2008: D+59.5
Not yet ingested
- Civics
- —
Market trends
- HPI YoY
- ▼ -1370.22%
- Current HPI
- 388.7956
- Rent YoY
- ▲ 3.83%
- Metro
- San Francisco-Oakland-Berkeley, CA
- State GDP YoY
- ▲ 3.21%
- F500 in state
- 116
Industry mix (Fortune 500 HQ in CA)
| Industry | F500 HQs | Revenue |
|---|---|---|
| Technology | 27 | $1,492B |
|
||
| Financial Services | 3 | $174B |
|
||
| Retail | 3 | $44B |
|
||
| Insurance | 3 | $26B |
|
||
| Media / Entertainment | 2 | $115B |
|
||
| Pharmaceuticals / Biotech | 2 | $62B |
|
||
Price history
+144.0% since first listed7 events — show timeline
- 2026-06-13 Listed $194,000 bridgeMLS, Bay East AOR, or Contra Costa AOR
- 2024-08-30 Sold (MLS) $184,000 bridgeMLS, Bay East AOR, or Contra Costa AOR
- 2024-07-24 Pending — bridgeMLS, Bay East AOR, or Contra Costa AOR
- 2024-07-16 Listed $174,950 bridgeMLS, Bay East AOR, or Contra Costa AOR
- 2001-03-25 Sold (MLS) $84,500 bridgeMLS, Bay East AOR, or Contra Costa AOR
- 2001-03-20 Listing Removed — bridgeMLS, Bay East AOR, or Contra Costa AOR
- 2001-01-27 Listed $79,500 bridgeMLS, Bay East AOR, or Contra Costa AOR
Cash-flow waterfall
monthlySold comps — $/sqft
last 12 mo · ≤1 miLoading sold comps…