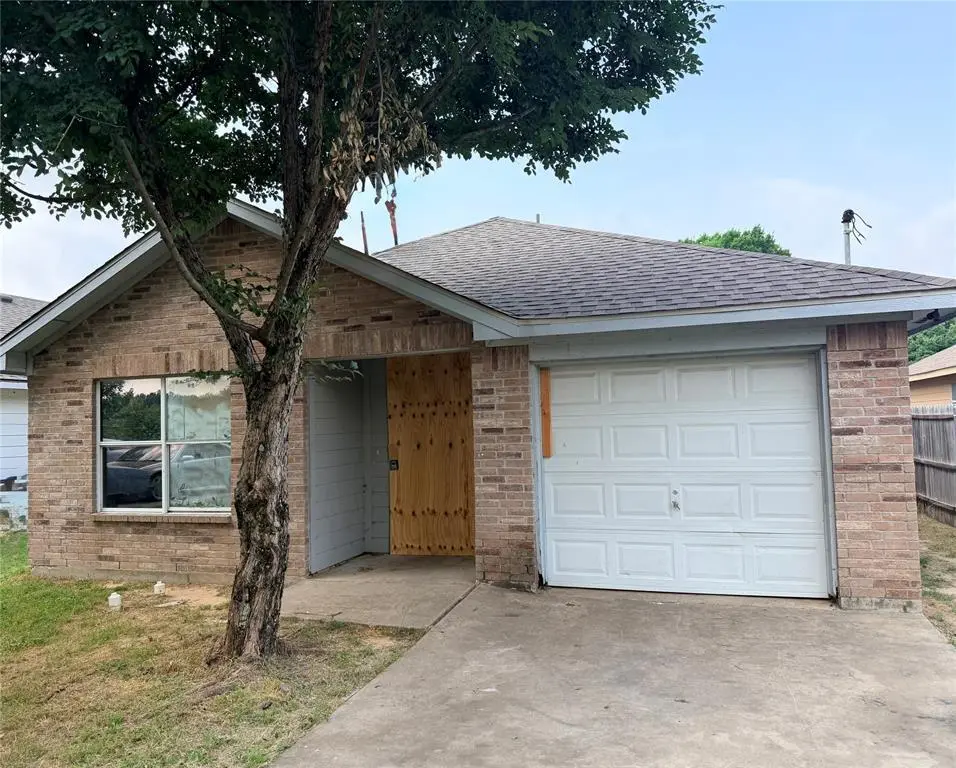
13622 Vida Ln · Dallas, TX
Flood risk 1/10 · Minimal
- FEMA flood zone
- X (unshaded)
- Chance of flooding over 30 yrs
- 0.0%
- Est. flood insurance / yr
- $507 – $1,088
Fire risk 3/10 · Minor
- Est. fire insurance / yr
- $1,222 – $2,270
Heat risk 8/10 · Major
- Hot days now (above 110°F)
- 7 days/yr
- Hot days in 30 yrs
- 25 days/yr
Wind risk 6/10 · Moderate
- Chance of severe wind over 30 yrs
- 27.0%
Air-quality risk 2/10 · Minimal
- Unhealthy air days now
- 1 days/yr
- Unhealthy air days in 30 yrs
- 1 days/yr
Risk factors via First Street. Map © Google.
Why this score? — see what drove the B- grade
The composite is a weighted blend of 9 inputs, each scored 0–100. Each bar is that input's sub-score; the figure is the points it added to the 100-point composite (weight × sub-score).
- Cash flow +25.9/30.0
- ARV discount +15.0/15.0
- DSCR +8.7/10.0
- 1% rule +7.1/10.0
- Livability +4.0/5.0
- Schools +2.8/10.0
- Condition / age +2.5/5.0
- Rent growth +2.4/5.0
- Appreciation +0.0/10.0
$175,000
🖨 Deal sheet 📄 Offer letter ✓ Due diligence
Listing remarks
Calling all INVESTORS and DYI enthusiast, this home is for you. It offers 4 bedrooms, 2 full bathrooms, separate living and dining rooms, spacious kitchen with plenty of cabinet space. This property needs work to return to its maximum potential. The home has a good structure but windows, doors and some walls need to be repaired or replaced. Floors also need some work, and electrical wiring needs to be restored to have electricity turn back on. Home is being sold as-is. Roof is about 3 years old only.
Key facts
- 0.23 acre lot
- Garage
- Built 2007
Property features AI
Finance
- Financial info: Treat as clear loan type; No second mortgage
- HOA & community: No association
Exterior
- Parking: Driveway; Covered parking (1 space); Attached garage with 1 garage space
- Utilities: Utilities: see remarks; Not in a municipal utility district
- Home design: Single-family residence; Residential property; One story; Property not attached
- Construction: Built in 2007; Brick and siding construction
- Exterior features: Lot under 0.5 acre (approximately 0.23 acres); Subdivision: Barbara Lambert; Directions: Hwy 175 South to Beltline Rd, turn left, then turn right on Vida Ln
Interior
- Kitchen: Dishwasher
- Bedrooms: Four bedrooms (all on the main level); Primary bedroom (main level)
- Bathrooms: Two full bathrooms
- Heating & cooling: No heating specified; No cooling specified
- Interior features: One-level layout; Five total rooms; One living area; One dining area; Other interior features
Neighborhood map
What this means for you Summary
Snapshot
- This is a 4-bed/2.0-bath single-family listed at $175k.
Deal economics
- At list price, monthly cash flow is $428 ($5k/yr) — positive.
- The deal already cash-flows at list — no discount required.
- Meets the 1% rule at list price ($2k rent vs $175k).
- Recommended offer: $172k (1.5% below list) — sets the bar for market timing.
- Cap rate 9.2% vs local median 2.3% in Dallas — top-decile yield for the area; either an underpriced asset or a hidden risk that comps aren't pricing in. Stress-test before assuming the spread holds.
Location & tenants
- Location reads 81/100 on livability (#24 in TX, #1,380 nationally) — a professional / high-income tenant draw. Strengths: amenities A+, commute A+, housing A+; Watch: crime F.
- Dallas ISD (urban): math 31% / reading 36% proficiency, ranked #559 of 826 in TX (top 68%) — families likely to look elsewhere, expect single-tenant / working-renter base with shorter leases; 83% free/reduced lunch — lower-income household profile, screen leases tightly.
- Zoned schools: Solar Preparatory School For Girls At Bonham (math 59% / reading 65%, grade B, #321 of 4,322 statewide, top 8%, 743 students, 49% FRL) — zoned schools average 49% FRL vs 83% district-wide (34 pts lower); this property's tenant base skews higher-income than the district average.
- Zoned-school proficiency averages 62% at this address vs 34% district-wide (+28 pts) — the actual schools serving this property are materially stronger than the Dallas ISD average implies; a family-tenant draw the district grade alone would hide.
- Market conditions: Rents soft (-0.6%/yr); 126 active listings in the ZIP; 23 comparable units currently listed for rent nearby; rentals at typical pace (median 15d on market — plan ~3-4 weeks tenant-placement turnaround); 12,577 units permitted in Dallas County in 2024 (6,829 in 5+ unit buildings).
- This rent runs 42% of the median local income ($61k/yr) — at the standard rent-burdened threshold; future hikes will face affordability resistance.
Forward outlook
- Local home prices are declining (-3.0%/yr); year-one equity from $1k of loan paydown is wiped out by about $5k of value loss. Plan a longer hold.
- Dallas County population projected at +35% by 2050 — long-run rental-demand tailwind backs the buy-and-hold thesis.
Negotiation context
- It's been on market 23 days — a 2% lower offer ($172k) is reasonable based on typical stale-listing flexibility.
- 2 sale attempts since 8y ago with the ask held roughly flat each time — persistent listings suggest the price (not the market) is what's stuck; bring a comps-based counter.
Risks & watch-outs
- Climate carrying-cost: major wind risk, 27% chance of damaging wind over 30y; extreme-heat days projected 7→25/yr by 2055 (HVAC capex compounding) — expect insurance premiums to compound above CPI over the hold.
Questions for the listing agent
- Is there a deadline driving the sale (1031 exchange, divorce, estate, relocation)? That informs how much negotiation room exists.
- Crime grade is F in this area — have there been break-ins, vandalism, or insurance claims at this property in the last 3 years? What carrier currently insures it and at what premium?
- What's the average days-on-market for RENTAL listings here right now (not sales)? A rising rental-DOM trend means longer vacancies and softer asking-rent achievability than the comps imply.
- What's the recent tenant-quality profile in this submarket — average credit score on applications, eviction rate, late-payment / NSF rate, and stable-employment percentage? A property-management company in the area should have these aggregated.
- How much new for-sale + rental construction is in the pipeline within 1–3 miles? Heavy new supply typically softens prices + rents 12–24 months out; constrained supply supports both.
Investment metrics
- 1% rule
- 1.21% ✓
- Cap rate
- 9.23%
- Cash-on-cash
- 10.49%
- DSCR
- 1.47
- GRM
- 6.9
CMA / ARV
- ARV (on-the-fly)
- $233,280
- Comps found
- 12
Show comp detail 12 sales within ~0.75 mi
| Address | Dist | Beds/Ba | Sqft | Sold | Price | $/sf | Match |
|---|---|---|---|---|---|---|---|
| 13718 Vida Ln | 0.06mi | 4/2.0 | 1,430 (-1%) | 4mo | $235,000 | $164 | 92 |
| 13726 Vida Ln | 0.08mi | 4/2.0 | 1,440 (0%) | 5mo | $230,000 | $160 | 92 |
| 13444 Vida Ln | 0.15mi | 3/2.0 (-1) | 1,430 (-1%) | 1mo | $225,000 | $157 | 86 |
| 13312 Kempwood Ln | 0.31mi | 3/2.0 (-1) | 1,387 (-4%) | 2mo | $210,000 | $151 | 73 |
| 1547 Vida Ct | 0.18mi | 3/2.0 (-1) | 1,643 (+14%) | 1mo | $260,000 | $158 | 62 |
| 1611 Cedar Bluff Ln | 0.30mi | 3/2.0 (-1) | 1,243 (-14%) | 3mo | $205,000 | $165 | 56 |
| 14106 Kelann Ct | 0.41mi | 4/2.0 | 1,624 (+13%) | 7mo | $270,000 | $166 | 54 |
| 14213 Wrangler Way | 0.69mi | 3/2.0 (-1) | 1,559 (+8%) | 4mo | $208,250 | $134 | 46 |
| 1445 Macy Ln | 0.44mi | 3/2.0 (-1) | 1,630 (+13%) | 10mo | $264,000 | $162 | 44 |
| 14157 Stallion Ridge Dr | 0.53mi | 3/2.0 (-1) | 1,591 (+10%) | 12mo | $248,900 | $156 | 43 |
| 14203 Riata Ln | 0.69mi | 4/2.0 | 1,611 (+12%) | 12mo | $276,500 | $172 | 38 |
| 2004 Sweetbay Ct | 0.55mi | 3/2.0 (-1) | 1,254 (-13%) | 12mo | $250,000 | $199 | 37 |
Match score weights: distance 35% · size 25% · config 20% · recency 20%. Top-matched comps best support the ARV.
Projected returns pro-forma
-3.0% appreciation · 0.0% rent growth · sell at horizon
- IRR
- -4.1%
- Equity multiple
- 0.85×
- Total profit
- $-7,236
- Equity at exit
- $26,093
- IRR
- 1.7%
- Equity multiple
- 1.10×
- Total profit
- $5,032
- Equity at exit
- $15,131
Cash invested: $49,000 (down + closing). Projections, not guarantees.
Landlord ↔ Tenant lean methodology
- Overall (STATE)
- 87 Strongly Landlord-Friendly
- State Texas
- 87 Strongly Landlord-Friendly · R+5
- County
- — inherits STATE
- City
- — inherits STATE
ZIP-level market 75253
- Home prices YoY
- -7.2%
- Rents YoY
- -0.6%
- Active inventory
- 126
- Price-to-rent
- 6.9×
Monthly cashflow live
- Estimated rent
- $2,121 high interval (Pro) →
- Mortgage (P&I)
- −$918
- Tax from tax record
- −$257 /mo · $3,079/yr
- Insurance
- −$73
- HOA
- −$0
- Vacancy / Maint / Mgmt
- −$445
- Net cashflow
- $428
Break-even live
UW: 25.0% down · 7.5% · 30yr · 1.5% tax · 5.0% vac · 8.0% maint · 8.0% mgmt
Financing live
Cash to close
- Down payment
- $43,750
- Closing costs
- $5,250
- Reserves months
- —
- Total cash needed
- —
Loan-product check · same deal, 3 products live
Conventional
25% down · 7.5% · 30yr
- Down + closing
- —
- Monthly P&I
- —
- Monthly cashflow
- —
- DSCR
- —
- Eligible?
- —
Personal DTI + credit; lowest rate.
DSCR
20% down · 8.5% · 30yr
- Down + closing
- —
- Monthly P&I
- —
- Monthly cashflow
- —
- DSCR
- —
- Eligible?
- —
No personal income docs; deal must DSCR.
Hard money
10% down · 12.0% · 12mo
- Down + closing
- —
- Monthly P&I
- —
- Monthly cashflow
- —
- DSCR
- —
- Eligible?
- —
Short-term bridge; refi at stabilization.
Rent comps 23 comps
| Address | Beds | Baths | Sqft | Rent | $/sqft | DOM | Units | Dist |
|---|---|---|---|---|---|---|---|---|
| 13631 Biggs St Dallas, TX | 3.0 | 2.0 | 1272 | $1,595 | $1.25 | 44d | 1 | 0.34mi |
| 13637 Biggs St Dallas, TX | 3.0 | 2.0 | 1227 | $1,700 | $1.39 | 5d | 1 | 0.34mi |
| 1915 Pin Oak Ln Dallas, TX | 3.0 | 2.0 | 1645 | $2,039 | $1.24 | 3d | 1 | 0.57mi |
| 2006 Bumelia Ct Dallas, TX | 4.0 | 2.0 | 1593 | $1,799 | $1.13 | 3d | 1 | 0.62mi |
| 2006 Bumelia Ct Dallas, TX | 4.0 | 2.0 | 1593 | $1,799 | $1.13 | 5d | 1 | 0.62mi |
| 15407 Dorothy Nell Dr Dallas, TX | 3.0 | 2.0 | 1566 | $1,800 | $1.15 | 19d | 1 | 0.67mi |
| 1759 Round House Ln Unit 1546066P Dallas, TX | 3.0 | 2.0 | 1442 | $3,430 | $2.38 | 15d | 1 | 0.69mi |
| 1717 Round House Ln Dallas, TX | 3.0 | 2.0 | 1260 | $2,099 | $1.67 | 8d | 1 | 0.70mi |
| 14267 Chaps Dr Dallas, TX | 4.0 | 2.5 | 1552 | $2,336 | $1.51 | 44d | 1 | 0.76mi |
| 14267 Chaps Dr Dallas, TX | 4.0 | 2.5 | 1552 | $1,955 | $1.26 | 24d | 1 | 0.76mi |
| 911 Nata Ln Dallas, TX | 3.0 | 2.0 | 1632 | $2,250 | $1.38 | 44d | 1 | 0.78mi |
| 903 Nata Ln Dallas, TX | 3.0 | 2.0 | 1632 | $2,250 | $1.38 | 44d | 1 | 0.79mi |
| 1367 Barrel Dr Dallas, TX | 3.0 | 2.0 | 1315 | $1,909 | $1.45 | 22d | 1 | 0.86mi |
| 15630 Gatsby Ln Dallas, TX | 4.0 | 2.5 | 1696 | $2,321 | $1.37 | 20d | 1 | 0.88mi |
| 1342 Barrel Dr Dallas, TX | 3.0 | 2.0 | 1542 | $1,899 | $1.23 | 44d | 1 | 0.90mi |
| 1334 Barrel Dr Dallas, TX | 3.0 | 2.0 | 1315 | $1,800 | $1.37 | 44d | 1 | 0.91mi |
| 117 Quail Run Dr Seagoville, TX | 3.0 | 2.0 | 1816 | $2,085 | $1.15 | 5d | 1 | 0.91mi |
| 1310 Barrel Dr Dallas, TX | 3.0 | 2.0 | 1315 | $1,826 | $1.39 | 14d | 1 | 0.92mi |
| 1310 Barrel Dr Dallas, TX | 3.0 | 2.0 | 1315 | $1,760 | $1.34 | 3d | 1 | 0.92mi |
| 2222 Echo Lake Dr Dallas, TX | 3.0 | 2.0 | 1350 | $1,850 | $1.37 | 17d | 1 | 1.07mi |
| 2809 N Highway 175 Seagoville, TX | 3.0 | 1.0 | 998 | $1,300 | $1.30 | 1d | 1 | 1.18mi |
| 2709 Lexington St Seagoville, TX | 3.0 | 2.0 | 1215 | $1,850 | $1.52 | 8d | 1 | 1.30mi |
| 12248 Ortega St Dallas, TX | 3.0 | 2.0 | 1346 | $1,970 | $1.46 | 3d | 1 | 1.36mi |
Listing history 16 events
-
2026-06-18days on market $175,000 Active 23 DOM
-
2026-06-17days on market $175,000 Active 22 DOM
-
2026-06-16days on market $175,000 Active 21 DOM
-
2026-06-15days on market $175,000 Active 20 DOM
-
2026-06-13days on market $175,000 Active 18 DOM
-
2026-06-09days on market $175,000 Active 14 DOM
-
2026-06-08days on market $175,000 Active 13 DOM
-
2026-06-07days on market $175,000 Active 12 DOM
-
2026-06-04days on market $175,000 Active 9 DOM
-
2026-06-03days on market $175,000 Active 8 DOM
-
2026-06-02days on market $175,000 Active 7 DOM
-
2026-06-01days on market $175,000 Active 6 DOM
-
2026-05-31days on market $175,000 Active 5 DOM
-
2026-05-26$175,000 Active
-
2018-05-18historical
-
2018-04-18$169,000 Active
ⓘ Source: listings_history table (triggers on properties + properties_extension) + one-shot
backfill from property_details.listing_events for pre-trigger history.
Tax reassessment forecast TX · Resets to sale price
- Current annual tax
- $3,079 · $257/mo
- Projected year-2 tax
- $3,202 · $267/mo
- Expected delta
- +$124/yr (+$10/mo · 4.0%)
ⓘ Screening estimate from a state-policy table — verify with the county assessor before closing.
Climate risk First Street
- Flood 1/10 Low FEMA zone X (unshaded) · 0% chance over 30 yrs
- Wildfire 3/10 Moderate
- Heat 8/10 Severe 7 d/yr ≥110°F today · 25 d/yr by 30 yrs out
- Wind 6/10 Major 27% chance of damaging wind over 30 yrs
- Air quality 2/10 Low 1 unhealthy d/yr today · 1 by 30 yrs out
Nearby sold comps map
Loading sold comps map…
Walkable amenities ~0.75 mi
Loading nearby amenities…
Taxation est. · year 1
- Rental income
- $25,451
- − Mortgage interest
- −$9,803
- − Property taxes
- −$3,079
- − Insurance
- −$875
- − Repairs & maintenance
- −$2,036
- − Management
- −$2,036
- − Depreciation
- −$5,091
- Taxable income
- $2,532
- Est. tax owed @ 24.0%
- −$608
- After-tax cash flow
- $4,533/yr
For passive investors: Depreciation is non-cash, so a rental often shows a tax loss while cash-flowing — sheltering income. Rental losses are passive: they offset passive income freely, and up to $25,000/yr can offset ordinary (W-2) income if you actively participate and your MAGI is under $100k (phasing out to $0 by $150k); unused losses carry forward. On sale, claimed depreciation is recaptured at up to 25%, and gains may owe capital-gains tax (a 1031 exchange can defer both). Figures are a year-1 estimate at your 24.0% rate — not tax advice; consult a CPA.
Schools (NCES district)
- District
- Dallas ISD
- NCES district ID
- 4816230
- Math proficiency
- 31% ▼ -16.00%
- Reading proficiency
- 36% ▼ -4.00%
- Median HH income
- $42,881
- Composite
- 28.41/100
- National rank
- #6763
- State rank
- #559 of 826 in TX
Livability — Dallas
- Score
- 81/100
- State rank
- #24
- US rank
- #1380
Category grades
Schools grade is shown separately in the Schools card above.
Census & demographics
- Census place
- Dallas, TX
- County
- Dallas County · 2,612,404 people
- City population
- 1,168,437
- Metro
- Dallas-Fort Worth-Arlington, TX
- Population (ZIP)
- 24,395
- Household income
- $60,874
- Rent vs Own
- Severe rent burden
- 497.0
Population outlook (Dallas County) Hauer SSP2
- Today (2025)
- 2,979,839 people
- By 2030
- 3,191,823 · +7.1%
- By 2040
- 3,619,611 · +21.5%
- By 2050
- 4,026,915 · +35.1%
- By 2075
- 4,957,073 · +66.4%
- By 2100
- 5,508,725 · +84.9%
Race, ethnicity, and origin ACS 2023
- Neighborhood character
- Predominantly Hispanic (70%)
- Race & ethnicity
- Hispanic / Latino 70% Two or more races 35% White 15% Black 14% Asian 1%
- Hispanic origin (detail)
- Mexican 64%
- Common ancestry
- Iranian 1% Slovak 1%
- Foreign-born
- 32% · Canada
- Languages at home
- 36% English-only · Spanish 62%
Political lean MEDSL · Dallas
- 2024 margin
- Strong D (+22.2) · D 60.2% · R 38.0% · Other 1.8%
- 2008→2024 swing
- +6.9pp toward D · 2008: 15.3pp · 2024: 22.2pp
- All cycles
- 2024: D+22.2 2020: D+31.6 2016: D+26.2 2012: D+15.4 2008: D+15.3
Not yet ingested
- Civics
- —
Market trends
- HPI YoY
- ▼ -27.55%
- Current HPI
- 357.4375
- Rent YoY
- ▼ -0.58%
- Metro
- Dallas-Fort Worth-Arlington, TX
- State GDP YoY
- ▲ 3.95%
- F500 in state
- 110
Industry mix (Fortune 500 HQ in TX)
| Industry | F500 HQs | Revenue |
|---|---|---|
| Energy | 16 | $1,198B |
|
||
| Technology | 5 | $198B |
|
||
| Engineering / Construction | 4 | $72B |
|
||
| Energy Services | 3 | $60B |
|
||
| Utilities | 3 | $41B |
|
||
| Healthcare | 2 | $330B |
|
||
Price history
+3.6% since first listed3 events — show timeline
- 2026-05-26 Listed $175,000 NTREIS
- 2018-05-18 Listing Removed — NTREIS
- 2018-04-18 Listed $169,000 NTREIS
Property tax history
+0.8%/yrLatest (2025): $3,079 · -0.4% YoY. Source: county tax records.
Cash-flow waterfall
monthlySold comps — $/sqft
last 12 mo · ≤1 miLoading sold comps…