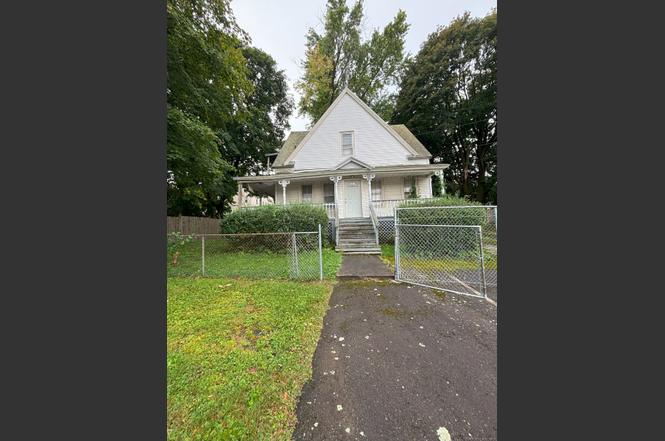
30 Ward St · Waterbury, CT
Flood risk 1/10 · Minimal
- FEMA flood zone
- X (unshaded)
- Chance of flooding over 30 yrs
- 0.0%
- Est. flood insurance / yr
- $507 – $1,088
Fire risk 1/10 · Minimal
- Est. fire insurance / yr
- $829 – $1,539
Heat risk 5/10 · Moderate
- Hot days now (above 96°F)
- 7 days/yr
- Hot days in 30 yrs
- 15 days/yr
Wind risk 6/10 · Moderate
- Chance of severe wind over 30 yrs
- 27.0%
Air-quality risk 3/10 · Minor
- Unhealthy air days now
- 2 days/yr
- Unhealthy air days in 30 yrs
- 3 days/yr
Risk factors via First Street. Map © Google.
Why this score? — see what drove the C+ grade
The composite is a weighted blend of 9 inputs, each scored 0–100. Each bar is that input's sub-score; the figure is the points it added to the 100-point composite (weight × sub-score).
- Cash flow +19.8/30.0
- ARV discount +15.0/15.0
- DSCR +6.3/10.0
- 1% rule +5.2/10.0
- Rent growth +4.5/5.0
- Livability +4.0/5.0
- Condition / age +2.5/5.0
- Appreciation +1.5/10.0
- Schools +1.5/10.0
$170,000
🖨 Deal sheet 📄 Offer letter ✓ Due diligence
Listing remarks
PRICED TO SELL. TREMENDOUS POTENTIAL FOR OWNER OCCUPIED OR RENTAL INVESTMENT. NEEDS UPDATING. WITH A LITTLE TLC WORTH THE INVESTMENT. LARGE LOT. NO FHA. CASH OR HARD MONEY PREFERRED. LOTS OF PRIVACY ON REAR LOT. PRICED TO SELL. TREMENDOUS POTENTIAL FOR OWNER OCCUPIED OR RENTAL INVESTMENT. NEEDS UPDATING. WITH A LITTLE TLC WORTH THE INVESTMENT. LARGE LOT. NO FHA. CASH OR HARD MONEY PREFERRED. LOTS OF PRIVACY ON REAR LOT.
Key facts
- 0.39 acre lot
- 4 parking spots
- Built 1970
Neighborhood map
What this means for you Summary
Snapshot
- This is a 3-bed/1.5-bath single-family listed at $170k.
Deal economics
- At list price, monthly cash flow is $201 ($2k/yr) — positive.
- The deal already cash-flows at list — no discount required.
- Meets the 1% rule at list price ($2k rent vs $170k).
- Recommended offer: $165k (3.0% below list) — sets the bar for market timing.
- Cap rate 7.7% vs local median 3.6% in Waterbury — top-decile yield for the area; either an underpriced asset or a hidden risk that comps aren't pricing in. Stress-test before assuming the spread holds.
Location & tenants
- Location reads 79/100 on livability (#32 in CT, #2,205 nationally) — a middle-class / working-renter tenant base. Strengths: commute A+, cost of living A+, housing A+; Watch: schools D+, crime D, employment D.
- Waterbury School District (suburban): math 12% / reading 23% proficiency, ranked #148 of 153 in CT (top 97%) — low school quality limits family demand, transient renter base, plan for 1-2y turnover; 73% free/reduced lunch — lower-income household profile, screen leases tightly.
- Market conditions: Rents rising fast (+8.0%/yr); 100 active listings in the ZIP; 40 comparable units currently listed for rent nearby; rentals lingering (median 44d on market — plan ~5-8 weeks vacancy on turnover, expect pricing pressure); 52% of comp listings sitting > 30 days — soft ceiling on asking rent; 502 units permitted in Naugatuck Valley Planning Region in 2024 (171 in 5+ unit buildings).
- This rent runs 43% of the median local income ($49k/yr) — at the standard rent-burdened threshold; future hikes will face affordability resistance.
Forward outlook
- Local home prices are declining (-3.0%/yr); year-one equity from $1k of loan paydown is wiped out by about $5k of value loss. Plan a longer hold.
- At projected returns (-3.0% appreciation + 8.0% rent growth), your $48k cash investment doubles in ~9 years — after that, you're playing with house money.
Negotiation context
- It's been on market 47 days — a 3% lower offer ($165k) is reasonable based on typical stale-listing flexibility.
Risks & watch-outs
- Climate carrying-cost: major wind risk, 27% chance of damaging wind over 30y; extreme-heat days projected 7→15/yr by 2055 (HVAC capex compounding) — expect insurance premiums to compound above CPI over the hold.
Questions for the listing agent
- It's been on market 47 days. Have you received any prior offers? Is the seller open to a 3% concession, seller financing, or rate buy-down credit?
- Built in 1970 — when were the roof, HVAC, electrical panel, plumbing, and water heater last replaced?
- Is there a deadline driving the sale (1031 exchange, divorce, estate, relocation)? That informs how much negotiation room exists.
- Schools are D-rated, which usually means shorter tenancies and higher turnover. Who's the typical renter profile here, and what's been the actual vacancy rate?
- Crime grade is D in this area — have there been break-ins, vandalism, or insurance claims at this property in the last 3 years? What carrier currently insures it and at what premium?
- What's the average days-on-market for RENTAL listings here right now (not sales)? A rising rental-DOM trend means longer vacancies and softer asking-rent achievability than the comps imply.
- What's the recent tenant-quality profile in this submarket — average credit score on applications, eviction rate, late-payment / NSF rate, and stable-employment percentage? A property-management company in the area should have these aggregated.
- How much new for-sale + rental construction is in the pipeline within 1–3 miles? Heavy new supply typically softens prices + rents 12–24 months out; constrained supply supports both.
Investment metrics
- 1% rule
- 1.02% ✓
- Cap rate
- 7.71%
- Cash-on-cash
- 5.08%
- DSCR
- 1.23
- GRM
- 8.1
CMA / ARV
- ARV (on-the-fly)
- $263,655
- Comps found
- 12
Show comp detail 12 sales within ~0.75 mi
| Address | Dist | Beds/Ba | Sqft | Sold | Price | $/sf | Match |
|---|---|---|---|---|---|---|---|
| 16 Cossett St | 0.31mi | 3/1.5 | 1,244 (+2%) | 4mo | $270,000 | $217 | 78 |
| 252 Wood St | 0.31mi | 3/1.5 | 1,280 (+5%) | 4mo | $140,000 | $109 | 74 |
| 38 Bronson St | 0.41mi | 2/1.5 (-1) | 1,194 (-2%) | 7mo | $275,000 | $230 | 67 |
| 7 Crown St | 0.31mi | 3/1.5 | 1,340 (+10%) | 8mo | $255,000 | $190 | 62 |
| 81 Easton Ave | 0.35mi | 4/1.5 (+1) | 1,328 (+9%) | 3mo | $250,000 | $188 | 60 |
| 82 Hotchkiss St | 0.67mi | 3/1.5 | 1,255 (+3%) | 6mo | $320,000 | $255 | 58 |
| 35 Butler St | 0.53mi | 3/2.0 | 1,089 (-10%) | 5mo | $235,000 | $216 | 52 |
| 212 Platt St | 0.56mi | 4/1.5 (+1) | 1,350 (+11%) | 1mo | $320,000 | $237 | 50 |
| 59 Howard St | 0.57mi | 3/2.0 | 1,360 (+12%) | 5mo | $250,000 | $184 | 48 |
| 37 Clifton Ave | 0.73mi | 2/1.0 (-1) | 1,130 (-7%) | 0mo | $257,000 | $227 | 47 |
| 39 Shelley St | 0.46mi | 3/1.0 | 1,032 (-15%) | 6mo | $226,750 | $220 | 46 |
| 341 Oak St | 0.70mi | 4/1.0 (+1) | 1,307 (+8%) | 4mo | $240,000 | $184 | 45 |
Match score weights: distance 35% · size 25% · config 20% · recency 20%. Top-matched comps best support the ARV.
Projected returns pro-forma
-3.0% appreciation · 8.0% rent growth · sell at horizon
- IRR
- -2.9%
- Equity multiple
- 0.88×
- Total profit
- $-5,488
- Equity at exit
- $25,348
- IRR
- 11.7%
- Equity multiple
- 2.13×
- Total profit
- $53,747
- Equity at exit
- $14,698
Cash invested: $47,600 (down + closing). Projections, not guarantees.
Landlord ↔ Tenant lean methodology
- Overall (STATE)
- 27 Tenant-Leaning
- State Connecticut
- 27 Tenant-Leaning · D+7
- County
- — inherits STATE
- City
- — inherits STATE
ZIP-level market 06704
- Home prices YoY
- -2.0%
- Rents YoY
- 8.0%
- Active inventory
- 100
- Price-to-rent
- 8.1×
Monthly cashflow live
- Estimated rent
- $1,742 high interval (Pro) →
- Mortgage (P&I)
- −$891
- Tax est. 1.5%
- −$212 /mo · $2,550/yr
- Insurance
- −$71
- HOA
- −$0
- Vacancy / Maint / Mgmt
- −$366
- Net cashflow
- $201
Break-even live
UW: 25.0% down · 7.5% · 30yr · 1.5% tax · 5.0% vac · 8.0% maint · 8.0% mgmt
Financing live
Cash to close
- Down payment
- $42,500
- Closing costs
- $5,100
- Reserves months
- —
- Total cash needed
- —
Loan-product check · same deal, 3 products live
Conventional
25% down · 7.5% · 30yr
- Down + closing
- —
- Monthly P&I
- —
- Monthly cashflow
- —
- DSCR
- —
- Eligible?
- —
Personal DTI + credit; lowest rate.
DSCR
20% down · 8.5% · 30yr
- Down + closing
- —
- Monthly P&I
- —
- Monthly cashflow
- —
- DSCR
- —
- Eligible?
- —
No personal income docs; deal must DSCR.
Hard money
10% down · 12.0% · 12mo
- Down + closing
- —
- Monthly P&I
- —
- Monthly cashflow
- —
- DSCR
- —
- Eligible?
- —
Short-term bridge; refi at stabilization.
Rent comps 40 comps
| Address | Beds | Baths | Sqft | Rent | $/sqft | DOM | Units | Dist |
|---|---|---|---|---|---|---|---|---|
| 46 Ward St Waterbury, CT | 3.0 | 1.0 | 1000 | $1,900 | $1.90 | 23d | 1 | 0.05mi |
| 132 Locust St Unit 16 Waterbury, CT | 2.0 | 1.0 | 950 | $1,250 | $1.32 | 23d | 1 | 0.10mi |
| 41 Putnam St Unit 2 Waterbury, CT | 2.0 | 1.0 | 800 | $1,750 | $2.19 | 43d | 1 | 0.12mi |
| 64 Dikeman St Unit 2nd Floor Waterbury, CT | 3.0 | 1.0 | 1000 | $2,200 | $2.20 | 21d | 1 | 0.17mi |
| 152 E Farm St #1 Waterbury, CT | 2.0 | 1.0 | 1182 | $1,550 | $1.31 | 43d | 1 | 0.18mi |
| 5 Hill St Unit B,D Waterbury, CT | 3.0 | 1.0 | 1100 | $1,450 | $1.32 | 14d | 1 | 0.20mi |
| 105 Division St Unit 3rd Floor Waterbury, CT | 2.0 | 1.0 | 900 | $1,300 | $1.44 | 14d | 1 | 0.23mi |
| 48 Irion St Apt 3 Waterbury, CT | 2.0 | 1.0 | 1000 | $1,399 | $1.40 | 43d | 1 | 0.24mi |
| 46 Webb St Unit 3 Waterbury, CT | 4.0 | 1.0 | 1200 | $2,000 | $1.67 | 43d | 1 | 0.28mi |
| 52 Oak St Waterbury, CT | 3.0 | 1.5 | 1024 | $1,800 | $1.76 | 3d | 1 | 0.31mi |
| 30 Walnut Ave Unit 2 Waterbury, CT | 3.0 | 1.0 | 1200 | $1,600 | $1.33 | 43d | 1 | 0.33mi |
| 76 Oak St Waterbury, CT | 2.0 | 1.0 | 900 | $1,249 | $1.39 | 43d | 1 | 0.33mi |
| 27 Beacon St Unit 3 Waterbury, CT | 2.0 | 1.0 | 1000 | $1,395 | $1.40 | 43d | 1 | 0.35mi |
| 25 Laurel St #1 Waterbury, CT | 4.0 | 1.0 | 1100 | $2,000 | $1.82 | 43d | 1 | 0.36mi |
| 77 Wall St Waterbury, CT | 3.0 | 1.0 | 1000 | $1,900 | $1.90 | 11d | 1 | 0.38mi |
| 1105 N Main St Unit 1 Waterbury, CT | 4.0 | 1.0 | 1316 | $2,200 | $1.67 | 21d | 1 | 0.41mi |
| 1105 N Main St Unit 3 Waterbury, CT | 4.0 | 1.0 | 1316 | $2,200 | $1.67 | 43d | 1 | 0.41mi |
| 53 Cooke St Unit 3rd floor Waterbury, CT | 3.0 | 1.0 | 1200 | $1,450 | $1.21 | 43d | 1 | 0.46mi |
| 214 Oak St Unit 3 Waterbury, CT | 3.0 | 1.0 | 1220 | $1,700 | $1.39 | 11d | 1 | 0.48mi |
| 127 Pearl St Unit 1 Waterbury, CT | 3.0 | 1.0 | 1212 | $2,000 | $1.65 | 43d | 1 | 0.51mi |
| 200 Hill St Unit 1R Waterbury, CT | 2.0 | 1.0 | 800 | $1,550 | $1.94 | 43d | 1 | 0.51mi |
| 33 Pilgrim Ave Waterbury, CT | 2.0 | 1.0 | 744 | $1,300 | $1.75 | 23d | 1 | 0.52mi |
| 203 Cooke St Waterbury, CT | 4.0 | 1.0 | 1472 | $2,000 | $1.36 | 43d | 1 | 0.53mi |
| 779 E Main St Unit 2nd floor Waterbury, CT | 3.0 | 1.0 | 1149 | $1,400 | $1.22 | 23d | 1 | 0.56mi |
| 233 Cooke St Unit 3 Waterbury, CT | 3.0 | 1.0 | 1000 | $2,000 | $2.00 | 23d | 1 | 0.58mi |
| 10 2nd Ave Unit 1st Floor Waterbury, CT | 3.0 | 1.0 | 900 | $1,450 | $1.61 | 23d | 1 | 0.63mi |
| 114 Buckingham St Unit 3rd Floor Waterbury, CT | 4.0 | 1.0 | 1418 | $1,750 | $1.23 | 43d | 1 | 0.69mi |
| 114 Buckingham St Unit 1st floor Waterbury, CT | 3.0 | 1.0 | 1418 | $1,750 | $1.23 | 43d | 1 | 0.69mi |
| 63 Bank St Unit 3A Waterbury, CT | 2.0 | 1.0 | 903 | $1,700 | $1.88 | 14d | 1 | 0.69mi |
| 96 Hillside Ave Waterbury, CT | 2.0 | 2.0 | 1500 | $1,795 | $1.20 | 43d | 1 | 0.71mi |
| 417 N Walnut St Unit 2 Waterbury, CT | 3.0 | 1.0 | 950 | $1,600 | $1.68 | 14d | 1 | 0.72mi |
| 125 Hillside Ave Unit B1 Waterbury, CT | 2.0 | 1.0 | 960 | $1,300 | $1.35 | 3d | 1 | 0.77mi |
| 259 Grove St Unit 1 Waterbury, CT | 3.0 | 1.0 | 1200 | $1,600 | $1.33 | 43d | 1 | 0.80mi |
| 184 Buckingham St Unit 3 Waterbury, CT | 2.0 | 1.0 | 1000 | $1,600 | $1.60 | 23d | 1 | 0.82mi |
| 18 Cliff St Unit 1 Waterbury, CT | 3.0 | 1.5 | 1150 | $1,650 | $1.43 | 43d | 1 | 0.82mi |
| 89 Willow St Unit 1 Waterbury, CT | 2.0 | 1.0 | 1000 | $1,450 | $1.45 | 23d | 1 | 0.90mi |
| 29 Bouley Ave Waterbury, CT | 4.0 | 1.0 | 1267 | $3,000 | $2.37 | 43d | 1 | 0.92mi |
| 180 Willow St Unit 2nd Floor Waterbury, CT | 3.0 | 1.0 | 1075 | $1,400 | $1.30 | 43d | 1 | 0.92mi |
| 219 Woodlawn Ter Unit 3rd floor Waterbury, CT | 3.0 | 1.0 | 1076 | $1,500 | $1.39 | 43d | 1 | 0.95mi |
| 236 Hillside Ave Unit 3 Waterbury, CT | 3.0 | 1.0 | 1300 | $1,600 | $1.23 | 14d | 1 | 0.97mi |
Listing history 2 events
-
2025-11-12status Under Contract
-
2025-09-19$170,000 Active
ⓘ Source: listings_history table (triggers on properties + properties_extension) + one-shot
backfill from property_details.listing_events for pre-trigger history.
Climate risk First Street
- Flood 1/10 Low FEMA zone X (unshaded) · 0% chance over 30 yrs
- Wildfire 1/10 Low
- Heat 5/10 Major 7 d/yr ≥96°F today · 15 d/yr by 30 yrs out
- Wind 6/10 Major 27% chance of damaging wind over 30 yrs
- Air quality 3/10 Moderate 2 unhealthy d/yr today · 3 by 30 yrs out
Nearby sold comps map
Loading sold comps map…
Walkable amenities ~0.75 mi
Loading nearby amenities…
Taxation est. · year 1
- Rental income
- $20,905
- − Mortgage interest
- −$9,523
- − Property taxes
- −$2,550
- − Insurance
- −$850
- − Repairs & maintenance
- −$1,672
- − Management
- −$1,672
- − Depreciation
- −$4,945
- Taxable loss
- −$308
- Est. tax savings @ 24.0%
- +$74
- After-tax cash flow
- $2,491/yr
For passive investors: Depreciation is non-cash, so a rental often shows a tax loss while cash-flowing — sheltering income. Rental losses are passive: they offset passive income freely, and up to $25,000/yr can offset ordinary (W-2) income if you actively participate and your MAGI is under $100k (phasing out to $0 by $150k); unused losses carry forward. On sale, claimed depreciation is recaptured at up to 25%, and gains may owe capital-gains tax (a 1031 exchange can defer both). Figures are a year-1 estimate at your 24.0% rate — not tax advice; consult a CPA.
Schools (NCES district)
- District
- Waterbury School District
- NCES district ID
- 0904830
- Math proficiency
- 12% ▼ -7.00%
- Reading proficiency
- 23% ▼ -8.00%
- Median HH income
- $40,040
- Composite
- 14.85/100
- National rank
- #9380
- State rank
- #148 of 153 in CT
Livability — Waterbury
- Score
- 79/100
- State rank
- #32
- US rank
- #2205
Category grades
Schools grade is shown separately in the Schools card above.
Census & demographics
- Census place
- Waterbury, CT
- County
- New Haven County · 688,236 people
- City population
- 115,012
- Metro
- New Haven-Milford, CT
- Population (ZIP)
- 31,713
- Household income
- $48,718
- Rent vs Own
- Severe rent burden
- 1981.0
Population outlook (Naugatuck Valley County) Hauer SSP2
- By 2040
- 496,846
Race, ethnicity, and origin ACS 2023
- Neighborhood character
- Diverse neighborhood (Simpson 0.66)
- Race & ethnicity
- Hispanic / Latino 48% Black 28% Two or more races 20% White 18% Asian 2%
- Hispanic origin (detail)
- Mexican 2% Puerto Rican 30% Dominican 8%
- Common ancestry
- Romanian 2% Lithuanian 1% Russian 1%
- Foreign-born
- 16% · Canada, South Korea
- Languages at home
- 56% English-only · Spanish 38% Other Indo-European 3% French/Haitian/Cajun 1%
Political lean MEDSL · Naugatuck Valley
- 2024 margin
- Lean R (+7.4) · D 45.6% · R 53.0% · Other 1.4%
- All cycles
- 2024: R+7.4
Not yet ingested
- Civics
- —
Market trends
- HPI YoY
- ▼ -7.05%
- Current HPI
- 340.0917
- Rent YoY
- ▲ 8.02%
- Metro
- New Haven-Milford, CT
- State GDP YoY
- ▲ 1.06%
- F500 in state
- 38
Industry mix (Fortune 500 HQ in CT)
| Industry | F500 HQs | Revenue |
|---|---|---|
| Industrial Machinery | 4 | $38B |
|
||
| Insurance | 3 | $71B |
|
||
| Financial Services | 2 | $25B |
|
||
| Transportation / Logistics | 2 | $18B |
|
||
| Healthcare | 1 | $247B |
|
||
| Telecommunications | 1 | $55B |
|
||
Price history
2 events — show timeline
- 2025-11-12 Pending — Smart MLS
- 2025-09-19 Listed $170,000 Smart MLS
Cash-flow waterfall
monthlySold comps — $/sqft
last 12 mo · ≤1 miLoading sold comps…