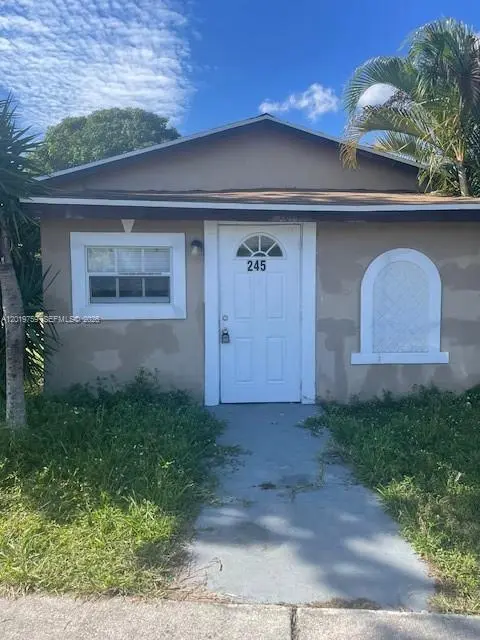
245 NW 6th Ave · Dania Beach, FL
Flood risk 1/10 · Minimal
- FEMA flood zone
- X (unshaded)
- Chance of flooding over 30 yrs
- 0.0%
- Est. flood insurance / yr
- $507 – $1,088
Fire risk 3/10 · Minor
- Est. fire insurance / yr
- $947 – $1,759
Heat risk 10/10 · Severe
- Hot days now (above 105°F)
- 7 days/yr
- Hot days in 30 yrs
- 28 days/yr
Wind risk 10/10 · Severe
- Chance of severe wind over 30 yrs
- 99.0%
Air-quality risk 2/10 · Minimal
- Unhealthy air days now
- 1 days/yr
- Unhealthy air days in 30 yrs
- 1 days/yr
Risk factors via First Street. Map © Google.
Why this score? — see what drove the D grade
The composite is a weighted blend of 9 inputs, each scored 0–100. Each bar is that input's sub-score; the figure is the points it added to the 100-point composite (weight × sub-score).
- ARV discount +15.0/15.0
- Cash flow +9.0/30.0
- Schools +4.1/10.0
- Livability +3.9/5.0
- 1% rule +2.6/10.0
- DSCR +2.5/10.0
- Condition / age +2.5/5.0
- Rent growth +2.1/5.0
- Appreciation +0.0/10.0
$355,000
🖨 Deal sheet (PDF) 📄 Offer letter ✓ Due diligence
Listing remarks
GREAT 3/1 CORNER HOME NEAR TO MANY FABULOUS PLACES AND MAYOR HIGHWAYS ACCESS. THIS PROPERTY CAN BE FINANCED BY THE OWNER
Key facts
- Built 1938
- Listed 37 days
Property features AI
Finance
- Financial info: Lease considered
Exterior
- Utilities: Public water; Public sewer
- Home design: Faces east
- Construction: Block construction; Shingle roof; Year built unknown
- Exterior features: No notable exterior features listed
Interior
- Bedrooms: Bedroom on main level
- Flooring: Ceramic tile; Laminate
- Bathrooms: 1 full bathroom
- Heating & cooling: Central heating
- Interior features: Bedroom on main level; First floor entry
Neighborhood map
What this means for you Summary
Snapshot
- This is a 3-bed/1.0-bath single-family listed at $355k.
Deal economics
- At list price, monthly cash flow is $-277 ($-3k/yr) — negative.
- To cash-flow at today's rent, offer at most $306k (13.8% below list).
- To meet the 1% rule (rent ≥ 1% of price), the offer needs to be $270k (23.9% below list).
- Recommended offer: $270k (23.9% below list) — sets the bar for 1% rule.
- Cap rate 5.4% vs local median 3.8% in Dania Beach — top-decile yield for the area; either an underpriced asset or a hidden risk that comps aren't pricing in. Stress-test before assuming the spread holds.
Location & tenants
- Location reads 77/100 on livability (#180 in FL, #2,806 nationally) — a middle-class / working-renter tenant base. Strengths: commute A+, cost of living A, housing A; Watch: employment D, amenities F.
- Broward (suburban): math 42% / reading 53% proficiency, ranked #46 of 73 in FL (top 63%) — families likely to look elsewhere, expect single-tenant / working-renter base with shorter leases.
- Zoned schools: Nova Blanche Forman Elementary (math 35% / reading 55%, grade D-, #1,271 of 2,144 statewide, top 60%, 769 students, 72% FRL); Nova Middle School (math 44% / reading 53%, grade C-, #274 of 571 statewide, top 50%, 1,284 students, 68% FRL); Nova High School (math 22% / reading 56%, grade F, #312 of 667 statewide, top 48%, 2,227 students, 59% FRL) — zoned schools average 66% FRL vs 51% district-wide (15 pts higher); higher-poverty schools than district average — tighter screening recommended.
- Market conditions: Rents soft (-1.7%/yr); 209 active listings in the ZIP; 40 comparable units currently listed for rent nearby; rentals at typical pace (median 16d on market — plan ~3-4 weeks tenant-placement turnaround); 2,111 units permitted in Broward County in 2024 (1,265 in 5+ unit buildings).
- At $2,701/mo this rent would consume 62% of the median local household income ($53k/yr) (locally 1999% of renters already pay >50% of income on rent) — very limited rent-growth headroom before tenants either downsize or default.
Forward outlook
- Local home prices are declining (-3.0%/yr); year-one equity from $2k of loan paydown is wiped out by about $11k of value loss. Plan a longer hold.
- Broward County population projected at +34% by 2050 — long-run rental-demand tailwind backs the buy-and-hold thesis.
Negotiation context
- It's been on market 37 days — a 3% lower offer ($344k) is reasonable based on typical stale-listing flexibility.
- 8 sale attempts since 15y ago; this cycle's ask is 99900% above the opening price — seller raised mid-cycle; expect resistance to lowballs.
- Current owner paid $160k; list at $355k implies a 122% gain — meaningful room to come down on a strong offer.
Risks & watch-outs
- Watch-outs: built in 1938 — expect roof / HVAC / electrical / plumbing capex.
- Climate carrying-cost: severe wind risk, 99% chance of damaging wind over 30y; extreme-heat days projected 7→28/yr by 2055 (HVAC capex compounding) — expect insurance premiums to compound above CPI over the hold.
Questions for the listing agent
- What do current leases actually rent for vs. the listed asking? Can we see a recent rent roll and the last 12 months of T-12 income?
- It's been on market 37 days. Have you received any prior offers? Is the seller open to a 24% concession, seller financing, or rate buy-down credit?
- Built in 1938 — when were the roof, HVAC, electrical panel, plumbing, and water heater last replaced?
- Is there a deadline driving the sale (1031 exchange, divorce, estate, relocation)? That informs how much negotiation room exists.
- Schools are D-rated, which usually means shorter tenancies and higher turnover. Who's the typical renter profile here, and what's been the actual vacancy rate?
- The area grade is low — what's the realistic commute time and amenity access for the typical tenant pool here? Any planned neighborhood developments (good or bad) we should know about?
- What's the average days-on-market for RENTAL listings here right now (not sales)? A rising rental-DOM trend means longer vacancies and softer asking-rent achievability than the comps imply.
- What's the recent tenant-quality profile in this submarket — average credit score on applications, eviction rate, late-payment / NSF rate, and stable-employment percentage? A property-management company in the area should have these aggregated.
- How much new for-sale + rental construction is in the pipeline within 1–3 miles? Heavy new supply typically softens prices + rents 12–24 months out; constrained supply supports both.
Investment metrics
- 1% rule
- 0.76% ✗
- Cap rate
- 5.36%
- Cash-on-cash
- -3.34%
- DSCR
- 0.85
- GRM
- 11.0
CMA / ARV
- ARV (on-the-fly)
- $548,208
- Comps found
- 2
Show comp detail 2 sales within ~0.75 mi
| Address | Dist | Beds/Ba | Sqft | Sold | Price | $/sf | Match |
|---|---|---|---|---|---|---|---|
| 121 NW 4th Ave | 0.19mi | 2/1.0 (-1) | 800 (+6%) | 8mo | $260,000 | $325 | 69 |
| 830 NW 6th Ave | 0.36mi | 3/2.0 | 805 (+7%) | 16mo | $586,500 | $729 | 54 |
Match score weights: distance 35% · size 25% · config 20% · recency 20%. Top-matched comps best support the ARV.
Projected returns pro-forma
-3.0% appreciation · 0.0% rent growth · sell at horizon
- IRR
- -25.2%
- Equity multiple
- 0.16×
- Total profit
- $-83,070
- Equity at exit
- $52,932
- IRR
- -33.9%
- Equity multiple
- -0.26×
- Total profit
- $-125,586
- Equity at exit
- $30,694
Cash invested: $99,400 (down + closing). Projections, not guarantees.
Landlord ↔ Tenant lean methodology
- Overall (STATE)
- 87 Strongly Landlord-Friendly
- State Florida
- 87 Strongly Landlord-Friendly · R+3
- County
- — inherits STATE
- City
- — inherits STATE
ZIP-level market 33004
- Rents YoY
- -1.7%
- Active inventory
- 209
- Price-to-rent
- 11.0×
Monthly cashflow live
- Estimated rent
- $2,701 high interval (Pro) →
- Mortgage (P&I)
- −$1,862
- Tax from tax record
- −$401 /mo · $4,814/yr
- Insurance
- −$148
- HOA
- −$0
- Vacancy / Maint / Mgmt
- −$567
- Net cashflow
- $-277
Break-even live
Sensitivity live
| Price | -10% $-76 | -5% $-177 | +0% $-277 | +5% $-378 | +10% $-478 |
|---|---|---|---|---|---|
| Rent | -10% $-490 | -5% $-384 | +0% $-277 | +5% $-170 | +10% $-64 |
| Rate | -1.0pp $-98 | -0.5pp $-187 | base $-277 | +0.5pp $-369 | +1.0pp $-463 |
UW: 25.0% down · 7.5% · 30yr · 1.5% tax · 5.0% vac · 8.0% maint · 8.0% mgmt
Financing live
Cash to close
- Down payment
- $88,750
- Closing costs
- $10,650
- Reserves months
- —
- Total cash needed
- —
Loan-product check · same deal, 3 products live
Conventional
25% down · 7.5% · 30yr
- Down + closing
- —
- Monthly P&I
- —
- Monthly cashflow
- —
- DSCR
- —
- Eligible?
- —
Personal DTI + credit; lowest rate.
DSCR
20% down · 8.5% · 30yr
- Down + closing
- —
- Monthly P&I
- —
- Monthly cashflow
- —
- DSCR
- —
- Eligible?
- —
No personal income docs; deal must DSCR.
Hard money
10% down · 12.0% · 12mo
- Down + closing
- —
- Monthly P&I
- —
- Monthly cashflow
- —
- DSCR
- —
- Eligible?
- —
Short-term bridge; refi at stabilization.
Rent comps 40 comps
| Address | Beds | Baths | Sqft | Rent | $/sqft | DOM | Units | Dist |
|---|---|---|---|---|---|---|---|---|
| 29 NE 3rd St Unit A Dania Beach, FL | 2.0 | 1.0 | 850 | $2,200 | $2.59 | 4d | 1 | 0.28mi |
| 29 NE 3rd St Unit A Dania Beach, FL | 2.0 | 1.0 | 850 | $2,200 | $2.59 | 16d | 1 | 0.28mi |
| 6 SW 7th Ave Dania Beach, FL | 2.0 | 1.0 | 1100 | $1,750 | $1.59 | 26d | 1 | 0.38mi |
| 4 N Federal Hwy Dania, FL | 3.0 | 1.0–2.0 | 852 | $3,565 | $4.18 | 0d | 40 | 0.39mi |
| 13 NE 2nd Ave #201 Dania, FL | 2.0 | 1.0 | 690 | $1,600 | $2.32 | 26d | 1 | 0.44mi |
| 250 NW 14th Way Unit 250 Dania Beach, FL | 3.0 | 1.0 | 1023 | $3,000 | $2.93 | 26d | 1 | 0.46mi |
| 101 SW 1st St Dania Beach, FL | 2.0 | 1.0–2.0 | 902 | $4,080 | $4.52 | 0d | 42 | 0.49mi |
| 22 NW 14th Ave Dania, FL | 2.0 | 2.0 | 976 | $2,800 | $2.87 | 26d | 1 | 0.51mi |
| 105 NW 14th Way Dania Beach, FL | 2.0 | 1.0 | 650 | $1,795 | $2.76 | 9d | 1 | 0.52mi |
| 120 N Compass Way Dania, FL | 1.0–3.0 | 1.0–2.0 | 982 | $4,200 | $4.27 | 0d | 1 | 0.72mi |
| 150 S Bryan Rd Dania, FL | 3.0 | 1.0–2.0 | 865 | $3,473 | $4.02 | 0d | 27 | 0.72mi |
| 310 SW 2nd Ave Dania, FL | 2.0 | 1.0 | 800 | $2,295 | $2.87 | 26d | 1 | 0.74mi |
| 500 NE 2nd St Dania, FL | 1.0–2.0 | 1.0–2.0 | 850 | $2,000 | $2.35 | 26d | 6 | 0.75mi |
| 500 NE 2nd St Dania, FL | 1.0–2.0 | 1.0–2.0 | 850 | $2,000 | $2.35 | 13d | 6 | 0.75mi |
| 500 NE 2nd St Dania, FL | 1.0–2.0 | 1.0–2.0 | 850 | $1,925 | $2.26 | 7d | 3 | 0.75mi |
| 500 NE 2nd St Dania, FL | 1.0–2.0 | 1.0–2.0 | 850 | $1,950 | $2.29 | 12d | 4 | 0.75mi |
| 500 NE 2nd St Dania, FL | 2.0 | 2.0 | 933 | $1,925 | $2.06 | 12d | 3 | 0.75mi |
| 121 N Compass Way Dania, FL | 1.0–2.0 | 1.0–2.0 | 871 | $3,010 | $3.45 | 26d | 3 | 0.76mi |
| 208 SW 3rd Pl Dania, FL | 2.0 | 1.0 | 952 | $2,300 | $2.42 | 26d | 1 | 0.80mi |
| 501 E Dania Beach Blvd Unit 5 M Dania Beach, FL | 2.0 | 2.0 | 1070 | $2,100 | $1.96 | 26d | 1 | 0.83mi |
| 229 SW 3rd Pl Dania, FL | 2.0 | 1.0 | 764 | $2,700 | $3.53 | 26d | 1 | 0.83mi |
| 713 SW 3rd Pl Unit 3 Dania Beach, FL | 2.0 | 1.0 | 775 | $1,595 | $2.06 | 26d | 1 | 0.83mi |
| 608 NE 2nd St Dania, FL | 2.0 | 2.0 | 1020 | $2,400 | $2.35 | 7d | 2 | 0.86mi |
| 753 SW 3rd Pl Unit 753 Dania Beach, FL | 3.0 | 2.0 | 1014 | $2,800 | $2.76 | 15d | 1 | 0.86mi |
| 367 Phippen Waiters Rd Unit back Dania Beach, FL | 2.0 | 1.0 | 932 | $2,300 | $2.47 | 0d | 1 | 0.87mi |
| 624 NE 2nd St Dania Beach, FL | 1.0–2.0 | 1.0–2.0 | 931 | $2,995 | $3.22 | 4d | 3 | 0.88mi |
| 600 E Dania Beach Blvd Dania, FL | 3.0 | 1.0–2.0 | 951 | $3,643 | $3.83 | 0d | 34 | 0.88mi |
| 601 E Dania Beach Blvd Dania, FL | 3.0 | 1.0–2.0 | 942 | $4,343 | $4.61 | 0d | 33 | 0.94mi |
| 2000 Stirling Rd Hollywood, FL | 1.0–3.0 | 1.0–2.0 | 993 | $4,027 | $4.06 | 0d | 18 | 0.95mi |
| 602 SE 2nd Ave Dania, FL | 2.0 | 1.0 | 1000 | $1,950 | $1.95 | 26d | 1 | 1.10mi |
| 694 SW 7th Ter Dania Beach, FL | 2.0 | 1.0 | 935 | $1,795 | $1.92 | 9d | 1 | 1.11mi |
| 262 SW 9th St Unit 1 Dania Beach, FL | 2.0 | 1.0 | 1000 | $1,995 | $2.00 | 15d | 1 | 1.19mi |
| 262 SW 9th St Unit 1 Dania Beach, FL | 2.0 | 1.0 | 1000 | $1,899 | $1.90 | 6d | 1 | 1.19mi |
| 32 SE 8th St Dania, FL | 2.0 | 1.0 | 1088 | $2,700 | $2.48 | 26d | 1 | 1.20mi |
| 2227 Cody St Unit 1505757P Hollywood, FL | 4.0 | 3.0 | 1097 | $4,458 | $4.06 | 9d | 1 | 1.25mi |
| 990 Phippen Rd Unit 1-2 Dania Beach, FL | 2.0 | 1.0 | 825 | $1,850 | $2.24 | 26d | 1 | 1.27mi |
| 257 SW 12th St Unit 1 Dania Beach, FL | 2.0 | 1.0 | 638 | $2,250 | $3.53 | 9d | 1 | 1.38mi |
| 48 SW 13th St Unit 1 Dania Beach, FL | 2.0 | 1.0 | 1000 | $2,499 | $2.50 | 26d | 1 | 1.41mi |
| 50 SW 13th St Dania Beach, FL | 2.0 | 1.0 | 1000 | $2,499 | $2.50 | 23d | 1 | 1.41mi |
| 55 SW 13th St Unit A Dania Beach, FL | 2.0 | 1.0 | 850 | $2,350 | $2.76 | 22d | 1 | 1.45mi |
Listing history 34 events
-
2026-06-21days on market $355,000 Active 37 DOM
-
2026-06-18days on market $355,000 Active 34 DOM
-
2026-06-17days on market $355,000 Active 33 DOM
-
2026-06-16days on market $355,000 Active 32 DOM
-
2026-06-15days on market $355,000 Active 31 DOM
-
2026-06-13days on market $355,000 Active 29 DOM
-
2026-06-09days on market $355,000 Active 25 DOM
-
2026-06-08days on market $355,000 Active 24 DOM
-
2026-06-07days on market $355,000 Active 23 DOM
-
2026-06-04days on market $355,000 Active 20 DOM
-
2026-06-03days on market $355,000 Active 19 DOM
-
2026-06-02remarks 120-char remark
-
2026-06-02days on market $355,000 Active 18 DOM
-
2026-06-01days on market $355,000 Active 17 DOM
-
2026-05-31days on market $355,000 Active 16 DOM
-
2026-05-15price $355,000
-
2026-05-13$355 Active
-
2023-10-31status Active
-
2023-04-28$300,000 Active
-
2021-08-06historical
-
2021-08-01status Active
-
2021-06-10$270,000 Active
-
2020-06-02historical
-
2019-07-15price $215,000
-
2019-07-08$220,000 Active
-
2019-06-12soldstatus $160,000
-
2018-06-22historical
-
2018-05-04$225,000 Active
-
2011-11-23soldstatus $23,500
-
2011-09-07$22,700
-
2005-02-25soldstatus $119,900
-
2003-12-22soldstatus $95,000
-
2003-03-27soldstatus $54,000
-
2000-07-13soldstatus $11,000
ⓘ Source: listings_history table (triggers on properties + properties_extension) + one-shot
backfill from property_details.listing_events for pre-trigger history.
Tax reassessment forecast FL · Resets to sale price
- Current annual tax
- $4,814 · $401/mo
- Projected year-2 tax
- $4,814 · $401/mo
- Expected delta
- $0/yr ($0/mo · 0.0%)
ⓘ Screening estimate from a state-policy table — verify with the county assessor before closing.
Climate risk First Street
- Flood 1/10 Low FEMA zone X (unshaded) · 0% chance over 30 yrs
- Wildfire 3/10 Moderate
- Heat 10/10 Extreme 7 d/yr ≥105°F today · 28 d/yr by 30 yrs out
- Wind 10/10 Extreme 99% chance of damaging wind over 30 yrs
- Air quality 2/10 Low 1 unhealthy d/yr today · 1 by 30 yrs out
Nearby sold comps map
Loading sold comps map…
Walkable amenities ~0.75 mi
Loading nearby amenities…
Taxation est. · year 1
- Rental income
- $32,411
- − Mortgage interest
- −$19,886
- − Property taxes
- −$4,814
- − Insurance
- −$1,775
- − Repairs & maintenance
- −$2,593
- − Management
- −$2,593
- − Depreciation
- −$10,327
- Taxable loss
- −$9,577
- Est. tax savings @ 24.0%
- +$2,298
- After-tax cash flow
- $-1,026/yr
For passive investors: Depreciation is non-cash, so a rental often shows a tax loss while cash-flowing — sheltering income. Rental losses are passive: they offset passive income freely, and up to $25,000/yr can offset ordinary (W-2) income if you actively participate and your MAGI is under $100k (phasing out to $0 by $150k); unused losses carry forward. On sale, claimed depreciation is recaptured at up to 25%, and gains may owe capital-gains tax (a 1031 exchange can defer both). Figures are a year-1 estimate at your 24.0% rate — not tax advice; consult a CPA.
Schools (NCES district)
- District
- Broward
- NCES district ID
- 1200180
- Math proficiency
- 42% ▼ -18.00%
- Reading proficiency
- 53% ▼ -5.00%
- Median HH income
- $52,139
- Composite
- 40.88/100
- National rank
- #3621
- State rank
- #46 of 73 in FL
Livability — Dania Beach
- Score
- 77/100
- State rank
- #180
- US rank
- #2806
Category grades
Schools grade is shown separately in the Schools card above.
Census & demographics
- Census place
- Dania Beach, FL
- County
- Broward County · 1,963,430 people
- City population
- 17,094
- Metro
- Miami-Fort Lauderdale-Pompano Beach, FL
- Population (ZIP)
- 17,094
- Household income
- $52,574
- Rent vs Own
- Severe rent burden
- 1999.0
Population outlook (Broward County) Hauer SSP2
- Today (2025)
- 2,207,033 people
- By 2030
- 2,360,704 · +7.0%
- By 2040
- 2,661,208 · +20.6%
- By 2050
- 2,946,698 · +33.5%
- By 2075
- 3,602,273 · +63.2%
- By 2100
- 3,970,984 · +79.9%
Race, ethnicity, and origin ACS 2023
- Neighborhood character
- Diverse neighborhood (Simpson 0.68)
- Race & ethnicity
- White 42% Hispanic / Latino 28% Black 24% Two or more races 19% Asian 1%
- Hispanic origin (detail)
- Puerto Rican 5% Cuban 7% Dominican 3%
- Common ancestry
- Romanian 3% Lithuanian 2% Hispanic 2%
- Foreign-born
- 28% · Canada, Jamaica, China
- Languages at home
- 60% English-only · Spanish 25% Other Indo-European 4% French/Haitian/Cajun 4%
Political lean MEDSL · Broward
- 2024 margin
- D (+17.0) · D 58.0% · R 41.0%
- 2008→2024 swing
- -17.8pp toward R · 2008: 34.7pp · 2024: 17.0pp
- All cycles
- 2024: D+17.0 2020: D+29.8 2016: D+35.0 2012: D+34.9 2008: D+34.7
Not yet ingested
- Civics
- —
Market trends
- HPI YoY
- ▼ -377.03%
- Current HPI
- 335.6607
- Rent YoY
- ▼ -1.66%
- Metro
- Miami-Fort Lauderdale-Pompano Beach, FL
- State GDP YoY
- ▲ 3.28%
- F500 in state
- 36
Industry mix (Fortune 500 HQ in FL)
| Industry | F500 HQs | Revenue |
|---|---|---|
| Industrial Technology | 2 | $29B |
|
||
| Insurance | 2 | $17B |
|
||
| Retail | 1 | $60B |
|
||
| Technology Distribution | 1 | $58B |
|
||
| Homebuilding | 1 | $35B |
|
||
| Technology Manufacturing | 1 | $35B |
|
||
Price history
+3127.3% since first listed19 events — show timeline
- 2026-05-15 Price Changed $355,000 MARMLS
- 2026-05-13 Listed $355 MARMLS
- 2023-10-31 Relisted — MARMLS
- 2023-04-28 Listed $300,000 MARMLS
- 2021-08-06 Listing Removed — MARMLS
- 2021-08-01 Relisted — MARMLS
- 2021-06-10 Listed $270,000 MARMLS
- 2020-06-02 Listing Removed — MARMLS
- 2019-07-15 Price Changed $215,000 MARMLS
- 2019-07-08 Listed $220,000 MARMLS
- 2019-06-12 Sold (Public Records) $160,000 Public Records
- 2018-06-22 Listing Removed — MARMLS
- 2018-05-04 Listed $225,000 MARMLS
- 2011-11-23 Sold (MLS) $23,500 MARMLS
- 2011-09-07 Listed $22,700 MARMLS
- 2005-02-25 Sold (Public Records) $119,900 Public Records
- 2003-12-22 Sold (Public Records) $95,000 Public Records
- 2003-03-27 Sold (Public Records) $54,000 Public Records
- 2000-07-13 Sold (Public Records) $11,000 Public Records
Property tax history
+11.1%/yrLatest (2025): $4,814 · +13.4% YoY. Source: county tax records.
Cash-flow waterfall
monthlySold comps — $/sqft
last 12 mo · ≤1 miLoading sold comps…