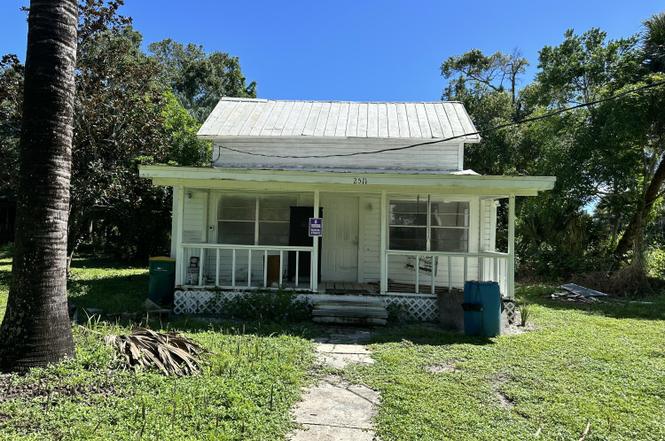
2511 Bruce D Buggs St · Melbourne, FL
Flood risk 3/10 · Minor
- FEMA flood zone
- X (unshaded)
- Chance of flooding over 30 yrs
- 0.09%
- Est. flood insurance / yr
- $507 – $1,088
Fire risk 1/10 · Minimal
- Est. fire insurance / yr
- $947 – $1,759
Heat risk 10/10 · Severe
- Hot days now (above 105°F)
- 7 days/yr
- Hot days in 30 yrs
- 23 days/yr
Wind risk 10/10 · Severe
- Chance of severe wind over 30 yrs
- 99.0%
Air-quality risk 1/10 · Minimal
- Unhealthy air days now
- 0 days/yr
- Unhealthy air days in 30 yrs
- 0 days/yr
Risk factors via First Street. Map © Google.
Why this score? — see what drove the B- grade
The composite is a weighted blend of 9 inputs, each scored 0–100. Each bar is that input's sub-score; the figure is the points it added to the 100-point composite (weight × sub-score).
- Cash flow +30.0/30.0
- DSCR +10.0/10.0
- 1% rule +8.8/10.0
- ARV discount +7.5/15.0
- Schools +4.7/10.0
- Rent growth +2.9/5.0
- Livability +2.5/5.0
- Condition / age +2.5/5.0
- Appreciation +0.0/10.0
$125,000
🖨 Deal sheet 📄 Offer letter ✓ Due diligence
Listing remarks
Craftsman Fixer-Upper on Rare . 68-Acre Lot! Step into the charm and character of this older Craftsman-style home, complete with a huge front porch. Set on an expansive . 68-acre lot—a true rarity in this area—this property offers endless possibilities for renovation, restoration, or new construction. The existing home requires a total renovation, making it an ideal opportunity for investors, builders, or buyers looking to customize a unique residence with classic appeal. Key Features: Charming Craftsman-style home Large front porch with tons of potential Oversized . 68-acre lot—rare for the area Renovate the existing structure or build brand-new Buyer to verify buil
Key facts
- Sewer available
- 68-acre lot
- Public water
Tags
Neighborhood map
What this means for you Summary
Snapshot
- This is a 2-bed/1.0-bath single-family listed at $125k.
Deal economics
- At list price, monthly cash flow is $555 ($7k/yr) — positive.
- The deal already cash-flows at list — no discount required.
- Meets the 1% rule at list price ($2k rent vs $125k).
- Recommended offer: $114k (9.0% below list) — sets the bar for market timing.
Location & tenants
- Location reads: area grade B — affects rentability + tenant quality, not the cash-flow math above.
- Brevard (suburban): math 53% / reading 57% proficiency, ranked #19 of 73 in FL (top 26%) — acceptable for families but not a draw, mixed tenant base, ~2y average lease.
- Zoned schools: Harbor City Elementary School (math 57% / reading 47%, grade C-, #990 of 2,144 statewide, top 48%, 403 students, 70% FRL); Stone Magnet Middle School (math 33% / reading 35%, grade F, #426 of 571 statewide, top 75%, 670 students, 69% FRL); Melbourne Senior High School (math 43% / reading 57%, grade D+, #175 of 667 statewide, top 27%, 2,249 students, 31% FRL).
- Market conditions: Rents rising (+1.7%/yr); 202 active listings in the ZIP; 27 comparable units currently listed for rent nearby; rentals at typical pace (median 23d on market — plan ~3-4 weeks tenant-placement turnaround); 4,602 units permitted in Brevard County in 2024 (702 in 5+ unit buildings).
- This rent runs 38% of the median local income ($55k/yr) — at the standard rent-burdened threshold; future hikes will face affordability resistance.
Forward outlook
- Local home prices are declining (-3.0%/yr); year-one equity from $864 of loan paydown is wiped out by about $4k of value loss. Plan a longer hold.
- Brevard County population projected at +15% by 2050 — modest demand growth; plan on rents tracking national, not racing it.
- At projected returns (-3.0% appreciation + 1.7% rent growth), your $35k cash investment doubles in ~7 years — after that, you're playing with house money.
Negotiation context
- It's been on market 98 days — a 9% lower offer ($114k) is reasonable based on typical stale-listing flexibility.
- 3 sale attempts; this cycle's ask has dropped $25k (17%) from the opening price — seller is motivated, your offer sets the floor, not the list.
- Current owner paid $70k; list at $125k implies a 79% gain — meaningful room to come down on a strong offer.
Risks & watch-outs
- Watch-outs: built in 1934 — expect roof / HVAC / electrical / plumbing capex.
- Climate carrying-cost: severe wind risk, 99% chance of damaging wind over 30y; extreme-heat days projected 7→23/yr by 2055 (HVAC capex compounding) — expect insurance premiums to compound above CPI over the hold.
Questions for the listing agent
- It's been on market 98 days. Have you received any prior offers? Is the seller open to a 9% concession, seller financing, or rate buy-down credit?
- Built in 1934 — when were the roof, HVAC, electrical panel, plumbing, and water heater last replaced?
- Why hasn't it sold? Are there any deal-killer items the seller is aware of (foundation, flood, title, zoning, code violations)?
- Is there a deadline driving the sale (1031 exchange, divorce, estate, relocation)? That informs how much negotiation room exists.
- What's the average days-on-market for RENTAL listings here right now (not sales)? A rising rental-DOM trend means longer vacancies and softer asking-rent achievability than the comps imply.
- What's the recent tenant-quality profile in this submarket — average credit score on applications, eviction rate, late-payment / NSF rate, and stable-employment percentage? A property-management company in the area should have these aggregated.
- How much new for-sale + rental construction is in the pipeline within 1–3 miles? Heavy new supply typically softens prices + rents 12–24 months out; constrained supply supports both.
Investment metrics
- 1% rule
- 1.38% ✓
- Cap rate
- 11.62%
- Cash-on-cash
- 19.01%
- DSCR
- 1.85
- GRM
- 6.0
CMA / ARV
No comps found within radius.
Projected returns pro-forma
-3.0% appreciation · 1.7% rent growth · sell at horizon
- IRR
- 9.4%
- Equity multiple
- 1.37×
- Total profit
- $12,829
- Equity at exit
- $18,638
- IRR
- 17.5%
- Equity multiple
- 2.36×
- Total profit
- $47,705
- Equity at exit
- $10,808
Cash invested: $35,000 (down + closing). Projections, not guarantees.
Landlord ↔ Tenant lean methodology
- Overall (STATE)
- 87 Strongly Landlord-Friendly
- State Florida
- 87 Strongly Landlord-Friendly · R+3
- County
- — inherits STATE
- City
- — inherits STATE
ZIP-level market 32901
- Home prices YoY
- -31.0%
- Rents YoY
- 1.7%
- Active inventory
- 202
- Price-to-rent
- 6.0×
Monthly cashflow live
- Estimated rent
- $1,729 high interval (Pro) →
- Mortgage (P&I)
- −$656
- Tax from tax record
- −$103 /mo · $1,241/yr
- Insurance
- −$52
- HOA
- −$0
- Vacancy / Maint / Mgmt
- −$363
- Net cashflow
- $555
Break-even live
UW: 25.0% down · 7.5% · 30yr · 1.5% tax · 5.0% vac · 8.0% maint · 8.0% mgmt
Financing live
Cash to close
- Down payment
- $31,250
- Closing costs
- $3,750
- Reserves months
- —
- Total cash needed
- —
Loan-product check · same deal, 3 products live
Conventional
25% down · 7.5% · 30yr
- Down + closing
- —
- Monthly P&I
- —
- Monthly cashflow
- —
- DSCR
- —
- Eligible?
- —
Personal DTI + credit; lowest rate.
DSCR
20% down · 8.5% · 30yr
- Down + closing
- —
- Monthly P&I
- —
- Monthly cashflow
- —
- DSCR
- —
- Eligible?
- —
No personal income docs; deal must DSCR.
Hard money
10% down · 12.0% · 12mo
- Down + closing
- —
- Monthly P&I
- —
- Monthly cashflow
- —
- DSCR
- —
- Eligible?
- —
Short-term bridge; refi at stabilization.
Rent comps 27 comps
| Address | Beds | Baths | Sqft | Rent | $/sqft | DOM | Units | Dist |
|---|---|---|---|---|---|---|---|---|
| 1002 Brothers Ave Unit 101 Melbourne, FL | 1.0 | 1.0 | 700 | $1,445 | $2.06 | 23d | 1 | 0.30mi |
| 2700 Carlson Cir Melbourne, FL | 1.0–2.0 | 1.0–2.0 | 879 | $1,242 | $1.41 | 23d | 1 | 0.47mi |
| 603 E New Haven Ave Melbourne, FL | 1.0 | 1.0 | 1118 | $1,575 | $1.41 | 14d | 1 | 0.51mi |
| 635 E New Haven Ave Melbourne, FL | 1.0–2.0 | 1.0–2.0 | 899 | $2,700 | $3.00 | 23d | 1 | 0.51mi |
| 248 E University Blvd Melbourne, FL | 1.0–2.0 | 1.0 | 720 | $1,449 | $2.01 | 14d | 5 | 0.57mi |
| 512 E Strawbridge Ave Melbourne, FL | 3.0 | 1.0 | 1487 | $2,400 | $1.61 | 21d | 1 | 0.64mi |
| 3101 Wiley Ave Melbourne, FL | 3.0 | 2.0 | 1185 | $1,499 | $1.26 | 23d | 1 | 0.66mi |
| 533 E Lincoln Ave Melbourne, FL | 2.0 | 1.0 | 796 | $1,800 | $2.26 | 23d | 1 | 0.69mi |
| 343 Talbot St Melbourne, FL | 3.0 | 2.0 | 1355 | $1,699 | $1.25 | 23d | 1 | 0.69mi |
| 100 E University Blvd Melbourne, FL | 1.0–3.0 | 1.0–1.5 | 756 | $1,437 | $1.90 | 13d | 16 | 0.77mi |
| 3104 Swift St Melbourne, FL | 3.0 | 1.0 | 1379 | $1,750 | $1.27 | 23d | 1 | 0.77mi |
| 3008 Hanson Ave Melbourne, FL | 1.0 | 1.0 | 840 | $1,125 | $1.34 | 23d | 1 | 0.81mi |
| 21 Rosevere Way Melbourne, FL | 3.0 | 2.0 | 1467 | $1,900 | $1.30 | 14d | 1 | 0.84mi |
| 1914 Fletcher St Melbourne, FL | 2.0 | 2.0 | 907 | $1,700 | $1.87 | 23d | 1 | 0.88mi |
| 3151 S Babcock St Melbourne, FL | 1.0–2.0 | 1.0–2.0 | 807 | $1,595 | $1.98 | 14d | 10 | 0.93mi |
| 300 Amherst Ave Melbourne, FL | 3.0 | 2.0 | 1353 | $2,050 | $1.52 | 14d | 1 | 1.08mi |
| 212 Dubber Rd Melbourne, FL | 3.0 | 2.0 | 1230 | $2,000 | $1.63 | 23d | 1 | 1.09mi |
| 2900 Vassar St Melbourne, FL | 3.0 | 2.0 | 1316 | $1,925 | $1.46 | 14d | 1 | 1.13mi |
| 1921 Park Ave Melbourne, FL | 3.0 | 1.0 | 900 | $1,775 | $1.97 | 23d | 1 | 1.13mi |
| 300 Rutgers Ave Melbourne, FL | 3.0 | 1.0 | 912 | $1,850 | $2.03 | 23d | 1 | 1.23mi |
| 309 Rutgers Ave Melbourne, FL | 3.0 | 1.0 | 912 | $1,700 | $1.86 | 21d | 1 | 1.29mi |
| 2331 Commerce Park Dr NE Palm Bay, FL | 1.0–3.0 | 1.0–2.0 | 1094 | $1,736 | $1.59 | 13d | 33 | 1.36mi |
| 208 Seminole Ave W Unit 1 Melbourne, FL | 2.0 | 1.0 | 966 | $2,900 | $3.00 | 23d | 1 | 1.39mi |
| 3522 D'Avinci Way Melbourne, FL | 2.0 | 2.0 | 875 | $1,625 | $1.86 | 23d | 1 | 1.40mi |
| 3502 D'Avinci Way Melbourne, FL | 2.0–3.0 | 2.0 | 998 | $1,480 | $1.48 | 14d | 15 | 1.43mi |
| 3595 Misty Oak Dr Melbourne, FL | 1.0–2.0 | 1.0–2.0 | 747 | $1,550 | $2.07 | 13d | 6 | 1.44mi |
| 2643B Kingswood Dr NE Palm Bay, FL | 3.0 | 1.0 | 1000 | $1,650 | $1.65 | 19d | 1 | 1.45mi |
Listing history 9 events
-
2026-03-16status Pending
-
2026-02-16status Active
-
2026-01-27status Pending
-
2026-01-13price $125,000
-
2025-11-06$150,000 Active
-
2025-05-16historical
-
2025-04-28$335,000 Active
-
2023-08-23soldstatus $70,000
-
1990-03-01soldstatus $18,000
ⓘ Source: listings_history table (triggers on properties + properties_extension) + one-shot
backfill from property_details.listing_events for pre-trigger history.
Tax reassessment forecast FL · Resets to sale price
- Current annual tax
- $1,241 · $103/mo
- Projected year-2 tax
- $1,241 · $103/mo
- Expected delta
- $0/yr ($0/mo · 0.0%)
ⓘ Screening estimate from a state-policy table — verify with the county assessor before closing.
Climate risk First Street
- Flood 3/10 Moderate FEMA zone X (unshaded) · 9% chance over 30 yrs
- Wildfire 1/10 Low
- Heat 10/10 Extreme 7 d/yr ≥105°F today · 23 d/yr by 30 yrs out
- Wind 10/10 Extreme 99% chance of damaging wind over 30 yrs
- Air quality 1/10 Low 0 unhealthy d/yr today · 0 by 30 yrs out
Nearby sold comps map
Loading sold comps map…
Walkable amenities ~0.75 mi
Loading nearby amenities…
Taxation est. · year 1
- Rental income
- $20,743
- − Mortgage interest
- −$7,002
- − Property taxes
- −$1,241
- − Insurance
- −$625
- − Repairs & maintenance
- −$1,659
- − Management
- −$1,659
- − Depreciation
- −$3,636
- Taxable income
- $4,920
- Est. tax owed @ 24.0%
- −$1,181
- After-tax cash flow
- $5,474/yr
For passive investors: Depreciation is non-cash, so a rental often shows a tax loss while cash-flowing — sheltering income. Rental losses are passive: they offset passive income freely, and up to $25,000/yr can offset ordinary (W-2) income if you actively participate and your MAGI is under $100k (phasing out to $0 by $150k); unused losses carry forward. On sale, claimed depreciation is recaptured at up to 25%, and gains may owe capital-gains tax (a 1031 exchange can defer both). Figures are a year-1 estimate at your 24.0% rate — not tax advice; consult a CPA.
Schools (NCES district)
- District
- Brevard
- NCES district ID
- 1200150
- Math proficiency
- 53% ▼ -9.00%
- Reading proficiency
- 57% ▼ -4.00%
- Median HH income
- $49,426
- Composite
- 46.86/100
- National rank
- #2370
- State rank
- #19 of 73 in FL
Livability — Melbourne
No livability data for this city. (Only ~50 U.S. cities are tracked.)
Census & demographics
- Census place
- Melbourne, FL
- County
- Brevard County · 602,871 people
- City population
- 178,420
- Metro
- Palm Bay-Melbourne-Titusville, FL
- Population (ZIP)
- 28,923
- Household income
- $54,651
- Rent vs Own
- Severe rent burden
- 2018.0
Population outlook (Brevard County) Hauer SSP2
- Today (2025)
- 623,254 people
- By 2030
- 648,420 · +4.0%
- By 2040
- 690,009 · +10.7%
- By 2050
- 715,669 · +14.8%
- By 2075
- 775,744 · +24.5%
- By 2100
- 776,687 · +24.6%
Race, ethnicity, and origin ACS 2023
- Neighborhood character
- Diverse neighborhood (Simpson 0.56)
- Race & ethnicity
- White 62% Black 18% Hispanic / Latino 11% Two or more races 8% Asian 4%
- Hispanic origin (detail)
- Mexican 2% Puerto Rican 4%
- Common ancestry
- Romanian 4% Lithuanian 3% Slovak 1%
- Foreign-born
- 14% · Canada, Vietnam, Jamaica
- Languages at home
- 85% English-only · Spanish 7% Other Indo-European 2% Vietnamese 2%
Political lean MEDSL · Brevard
- 2024 margin
- Strong R (+20.8) · D 39.1% · R 59.9% · Other 1.0%
- 2008→2024 swing
- -10.4pp toward R · 2008: -10.4pp · 2024: -20.8pp
- All cycles
- 2024: R+20.8 2020: R+16.4 2016: R+19.8 2012: R+12.7 2008: R+10.4
Not yet ingested
- Civics
- —
Market trends
- HPI YoY
- ▼ -145.13%
- Current HPI
- 322.934
- Rent YoY
- ▲ 1.70%
- Metro
- Palm Bay-Melbourne-Titusville, FL
- State GDP YoY
- ▲ 3.28%
- F500 in state
- 36
Industry mix (Fortune 500 HQ in FL)
| Industry | F500 HQs | Revenue |
|---|---|---|
| Industrial Technology | 2 | $29B |
|
||
| Insurance | 2 | $17B |
|
||
| Retail | 1 | $60B |
|
||
| Technology Distribution | 1 | $58B |
|
||
| Homebuilding | 1 | $35B |
|
||
| Technology Manufacturing | 1 | $35B |
|
||
Price history
+594.4% since first listed9 events — show timeline
- 2026-03-16 Pending — SCMLS
- 2026-02-16 Relisted — SCMLS
- 2026-01-27 Pending — SCMLS
- 2026-01-13 Price Changed $125,000 SCMLS
- 2025-11-06 Listed $150,000 SCMLS
- 2025-05-16 Listing Removed — Stellar MLS as Distributed by MLS Grid
- 2025-04-28 Listed $335,000 Stellar MLS as Distributed by MLS Grid
- 2023-08-23 Sold (Public Records) $70,000 Public Records
- 1990-03-01 Sold (Public Records) $18,000 Public Records
Property tax history
+7.0%/yrLatest (2025): $1,241 · +12.4% YoY. Source: county tax records.
Cash-flow waterfall
monthlySold comps — $/sqft
last 12 mo · ≤1 miLoading sold comps…