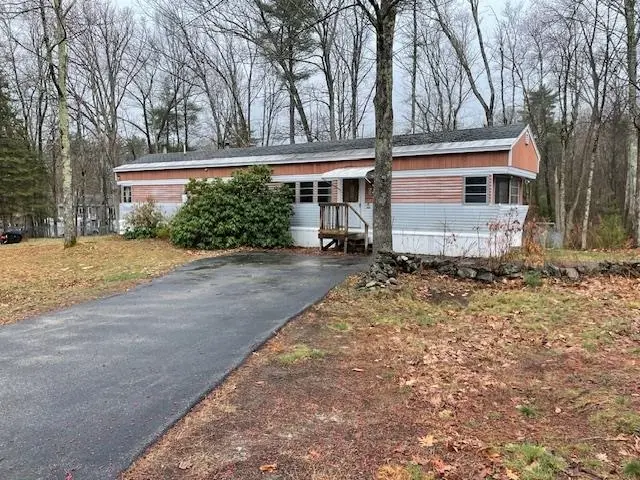
10 Fox Ln · Rochester, NH
Flood risk 1/10 · Minimal
- FEMA flood zone
- X (unshaded)
- Chance of flooding over 30 yrs
- 0.0%
- Est. flood insurance / yr
- $507 – $1,088
Fire risk 1/10 · Minimal
- Est. fire insurance / yr
- $507 – $941
Heat risk 3/10 · Minor
- Hot days now (above 97°F)
- 7 days/yr
- Hot days in 30 yrs
- 15 days/yr
Wind risk 4/10 · Minor
- Chance of severe wind over 30 yrs
- 17.0%
Air-quality risk 2/10 · Minimal
- Unhealthy air days now
- 1 days/yr
- Unhealthy air days in 30 yrs
- 1 days/yr
Risk factors via First Street. Map © Google.
Why this score? — see what drove the C grade
The composite is a weighted blend of 9 inputs, each scored 0–100. Each bar is that input's sub-score; the figure is the points it added to the 100-point composite (weight × sub-score).
- Cash flow +27.6/30.0
- DSCR +9.7/10.0
- 1% rule +7.7/10.0
- Livability +4.2/5.0
- Rent growth +3.6/5.0
- Schools +2.7/10.0
- Condition / age +2.5/5.0
- ARV discount +0.9/15.0
- Appreciation +0.0/10.0
$160,000
🖨 Deal sheet 📄 Offer letter ✓ Due diligence
Listing remarks
NO FEES and you own the lot! This well-maintained Windsor (1977) manufactured home set in a wooded neighborhood offers 924 square feet of living space, with 2 bedrooms and 2 bathrooms. The main living area has new subflooring and new carpeting. The home sits on a concrete slab, with concrete piers and new anchors. HUD certified. Updates include a furnace, just three years old, and a washer and dryer that are one year old. Step outside to enjoy the spacious deck, built with durable composite decking designed for long-lasting, low-maintenance use. The fenced . 48 acre lot also includes an above ground pool. There is a shed for extra storage and paved parking for up to four vehicles, plus an
Key facts
- New carpeting
- Concrete slab
- Well insulated
Tags
Property features AI
Finance
- Other: Mobile serial number ZW17014-5972; Located in Rochester City School District
- HOA & community: No HOA fee listed
Exterior
- Parking: Paved driveway
- Utilities: Public water; Septic (1000 gallon); 150 amp electric service; Cable internet available
- Home design: Single wide mobile home; Entry level: main level; Mobile make Windsor, model Singlewide Deluxe (2 bed, 2 bath)
- Construction: Wood frame construction; Asphalt shingle roof; Built in 1977
- Exterior features: Level and wooded lot; Near shopping; Paved driveway; Public paved road frontage (approximately 150 feet)
Interior
- Kitchen: Gas stove
- Bedrooms: Two bedrooms on the main level
- Flooring: Carpet; Vinyl
- Bathrooms: 2 full bathrooms
- Heating & cooling: Hot water baseboard heating; Central air conditioning
- Interior features: 4 total rooms; Carpet and vinyl flooring
Neighborhood map
What this means for you Summary
Snapshot
- This is a 2-bed/2.0-bath manufactured listed at $160k.
Deal economics
- At list price, monthly cash flow is $475 ($6k/yr) — positive.
- The deal already cash-flows at list — no discount required.
- Meets the 1% rule at list price ($2k rent vs $160k).
- Cap rate 9.9% vs local median 3.6% in Rochester — top-decile yield for the area; either an underpriced asset or a hidden risk that comps aren't pricing in. Stress-test before assuming the spread holds.
Location & tenants
- Location reads 84/100 on livability (#8 in NH, #698 nationally) — a professional / high-income tenant draw. Strengths: crime A+, commute A+, cost of living A+; Watch: amenities C-.
- Rochester School District (suburban): math 27% / reading 35% proficiency, ranked #83 of 98 in NH (top 85%) — families likely to look elsewhere, expect single-tenant / working-renter base with shorter leases.
- Market conditions: Rents rising fast (+4.2%/yr); 108 active listings in the ZIP; solid renter incomes; 951 units permitted in Strafford County in 2024 (551 in 5+ unit buildings).
- This rent runs 31% of the median local income ($79k/yr) — at the standard rent-burdened threshold; future hikes will face affordability resistance.
Forward outlook
- Local home prices are declining (-3.0%/yr); year-one equity from $1k of loan paydown is wiped out by about $5k of value loss. Plan a longer hold.
- Strafford County population projected at +7% by 2050 — modest demand growth; plan on rents tracking national, not racing it.
- At projected returns (-3.0% appreciation + 4.2% rent growth), your $45k cash investment doubles in ~8 years — after that, you're playing with house money.
Negotiation context
- Only 7 days on market — expect competitive offers; lowballing is unlikely to land.
- Current owner paid $40k; list at $160k implies a 300% gain — meaningful room to come down on a strong offer.
Questions for the listing agent
- Built in 1977 — when were the roof, HVAC, electrical panel, plumbing, and water heater last replaced?
- Is there a deadline driving the sale (1031 exchange, divorce, estate, relocation)? That informs how much negotiation room exists.
- What's the average days-on-market for RENTAL listings here right now (not sales)? A rising rental-DOM trend means longer vacancies and softer asking-rent achievability than the comps imply.
- What's the recent tenant-quality profile in this submarket — average credit score on applications, eviction rate, late-payment / NSF rate, and stable-employment percentage? A property-management company in the area should have these aggregated.
- How much new for-sale + rental construction is in the pipeline within 1–3 miles? Heavy new supply typically softens prices + rents 12–24 months out; constrained supply supports both.
Investment metrics
- 1% rule
- 1.27% ✓
- Cap rate
- 9.86%
- Cash-on-cash
- 12.73%
- DSCR
- 1.57
- GRM
- 6.6
CMA / ARV
- ARV (on-the-fly)
- $139,524
- Comps found
- 12
Show comp detail 12 sales within ~0.75 mi
| Address | Dist | Beds/Ba | Sqft | Sold | Price | $/sf | Match |
|---|---|---|---|---|---|---|---|
| 10 Fox Ln | 0.00mi | 2/2.0 | 924 (0%) | 0mo | $176,000 | $190 | 100 |
| 36 Melrose Dr | 0.28mi | 3/1.5 (+1) | 924 (0%) | 4mo | $75,000 | $81 | 76 |
| 133 Daffodil Hill Ln | 0.37mi | 2/2.0 | 931 (+1%) | 10mo | $115,000 | $124 | 73 |
| 38 Joshua St | 0.49mi | 2/2.0 | 924 (0%) | 9mo | $139,900 | $151 | 70 |
| 87 Betts Rd | 0.31mi | 2/1.0 | 1,008 (+9%) | 0mo | $255,000 | $253 | 66 |
| 28 Joshua St | 0.47mi | 3/1.0 (+1) | 896 (-3%) | 5mo | $55,500 | $62 | 60 |
| 17 Wildflower Way | 0.41mi | 3/1.0 (+1) | 960 (+4%) | 8mo | $215,000 | $224 | 59 |
| 58 Tonka St | 0.57mi | 2/1.0 | 928 (+0%) | 12mo | $150,000 | $162 | 59 |
| 7 Gina Dr | 0.21mi | 3/2.0 (+1) | 1,040 (+13%) | 10mo | $250,000 | $240 | 56 |
| 55 Joshua St | 0.59mi | 2/2.0 | 980 (+6%) | 8mo | $135,000 | $138 | 56 |
| 67 Daffodil Hill Ln | 0.62mi | 2/1.0 | 924 (0%) | 16mo | $117,000 | $127 | 54 |
| 40 Joshua St | 0.50mi | 2/1.0 | 1,020 (+10%) | 7mo | $58,100 | $57 | 50 |
Match score weights: distance 35% · size 25% · config 20% · recency 20%. Top-matched comps best support the ARV.
Projected returns pro-forma
-3.0% appreciation · 4.22% rent growth · sell at horizon
- IRR
- 3.9%
- Equity multiple
- 1.15×
- Total profit
- $6,923
- Equity at exit
- $23,857
- IRR
- 14.6%
- Equity multiple
- 2.25×
- Total profit
- $55,828
- Equity at exit
- $13,834
Cash invested: $44,800 (down + closing). Projections, not guarantees.
Landlord ↔ Tenant lean methodology
- Overall (STATE)
- 56 Moderately Landlord-Leaning
- State New Hampshire
- 56 Moderately Landlord-Leaning · D+1
- County
- — inherits STATE
- City
- — inherits STATE
ZIP-level market 03867
- Home prices YoY
- -22.0%
- Rents YoY
- 4.2%
- Active inventory
- 108
- Price-to-rent
- 6.6×
Monthly cashflow live
- Estimated rent
- $2,033 medium interval (Pro) →
- Mortgage (P&I)
- −$839
- Tax from tax record
- −$225 /mo · $2,697/yr
- Insurance
- −$67
- HOA
- −$0
- Vacancy / Maint / Mgmt
- −$427
- Net cashflow
- $475
Break-even live
UW: 25.0% down · 7.5% · 30yr · 1.5% tax · 5.0% vac · 8.0% maint · 8.0% mgmt
Financing live
Cash to close
- Down payment
- $40,000
- Closing costs
- $4,800
- Reserves months
- —
- Total cash needed
- —
Loan-product check · same deal, 3 products live
Conventional
25% down · 7.5% · 30yr
- Down + closing
- —
- Monthly P&I
- —
- Monthly cashflow
- —
- DSCR
- —
- Eligible?
- —
Personal DTI + credit; lowest rate.
DSCR
20% down · 8.5% · 30yr
- Down + closing
- —
- Monthly P&I
- —
- Monthly cashflow
- —
- DSCR
- —
- Eligible?
- —
No personal income docs; deal must DSCR.
Hard money
10% down · 12.0% · 12mo
- Down + closing
- —
- Monthly P&I
- —
- Monthly cashflow
- —
- DSCR
- —
- Eligible?
- —
Short-term bridge; refi at stabilization.
Listing history 5 events
-
2026-05-06status Pending
-
2026-05-03historical Active with Contract
-
2026-04-26status Pending
-
2026-04-22$160,000 Active
-
1997-08-15soldstatus $40,000
ⓘ Source: listings_history table (triggers on properties + properties_extension) + one-shot
backfill from property_details.listing_events for pre-trigger history.
Tax reassessment forecast NH · Partial reset (capped growth)
- Current annual tax
- $2,697 · $225/mo
- Projected year-2 tax
- $3,092 · $258/mo
- Expected delta
- +$396/yr (+$33/mo · 14.7%)
ⓘ Screening estimate from a state-policy table — verify with the county assessor before closing.
Climate risk First Street
- Flood 1/10 Low FEMA zone X (unshaded) · 0% chance over 30 yrs
- Wildfire 1/10 Low
- Heat 3/10 Moderate 7 d/yr ≥97°F today · 15 d/yr by 30 yrs out
- Wind 4/10 Moderate 17% chance of damaging wind over 30 yrs
- Air quality 2/10 Low 1 unhealthy d/yr today · 1 by 30 yrs out
Nearby sold comps map
Loading sold comps map…
Walkable amenities ~0.75 mi
Loading nearby amenities…
Taxation est. · year 1
- Rental income
- $24,393
- − Mortgage interest
- −$8,962
- − Property taxes
- −$2,697
- − Insurance
- −$800
- − Repairs & maintenance
- −$1,951
- − Management
- −$1,951
- − Depreciation
- −$4,655
- Taxable income
- $3,376
- Est. tax owed @ 24.0%
- −$810
- After-tax cash flow
- $4,895/yr
For passive investors: Depreciation is non-cash, so a rental often shows a tax loss while cash-flowing — sheltering income. Rental losses are passive: they offset passive income freely, and up to $25,000/yr can offset ordinary (W-2) income if you actively participate and your MAGI is under $100k (phasing out to $0 by $150k); unused losses carry forward. On sale, claimed depreciation is recaptured at up to 25%, and gains may owe capital-gains tax (a 1031 exchange can defer both). Figures are a year-1 estimate at your 24.0% rate — not tax advice; consult a CPA.
Schools (NCES district)
- District
- Rochester School District
- NCES district ID
- 3305940
- Math proficiency
- 27% ▼ -15.00%
- Reading proficiency
- 35% ▼ -14.00%
- Median HH income
- $51,080
- Composite
- 27.11/100
- National rank
- #7039
- State rank
- #83 of 98 in NH
Livability — Rochester
- Score
- 84/100
- State rank
- #8
- US rank
- #698
Category grades
Schools grade is shown separately in the Schools card above.
Census & demographics
- Census place
- Rochester, NH
- County
- Strafford County · 75,181 people
- City population
- 22,732
- Metro
- Boston-Cambridge-Newton, MA-NH
- Population (ZIP)
- 22,732
- Household income
- $78,674
- Rent vs Own
- Severe rent burden
- 663.0
Population outlook (Strafford County) Hauer SSP2
- Today (2025)
- 132,503 people
- By 2030
- 135,377 · +2.2%
- By 2040
- 139,609 · +5.4%
- By 2050
- 141,803 · +7.0%
- By 2075
- 149,280 · +12.7%
- By 2100
- 148,667 · +12.2%
Race, ethnicity, and origin ACS 2023
- Neighborhood character
- Predominantly White (93%)
- Race & ethnicity
- White 93% Two or more races 4% Hispanic / Latino 2% Asian 1%
- Common ancestry
- Lithuanian 12% Romanian 2% Serbian 2%
- Foreign-born
- 3% · Canada
- Languages at home
- 96% English-only · Spanish 1% French/Haitian/Cajun 1%
Political lean MEDSL · Strafford
- 2024 margin
- D (+12.1) · D 55.5% · R 43.5% · Other 1.0%
- 2008→2024 swing
- -8.3pp toward R · 2008: 20.4pp · 2024: 12.1pp
- All cycles
- 2024: D+12.1 2020: D+15.2 2016: D+8.6 2012: D+14.5 2008: D+20.4
Not yet ingested
- Civics
- —
Market trends
- HPI YoY
- ▼ -107.34%
- Current HPI
- 379.5755
- Rent YoY
- ▲ 4.22%
- Metro
- Boston-Cambridge-Newton, MA-NH
- State GDP YoY
- —
- F500 in state
- 0
Price history
+300.0% since first listed5 events — show timeline
- 2026-05-06 Pending — PrimeMLS
- 2026-05-03 Contingent — PrimeMLS
- 2026-04-26 Pending — PrimeMLS
- 2026-04-22 Listed $160,000 PrimeMLS
- 1997-08-15 Sold (Public Records) $40,000 Public Records
Property tax history
+3.6%/yrLatest (2025): $2,697 · +3.0% YoY. Source: county tax records.
Cash-flow waterfall
monthlySold comps — $/sqft
last 12 mo · ≤1 miLoading sold comps…