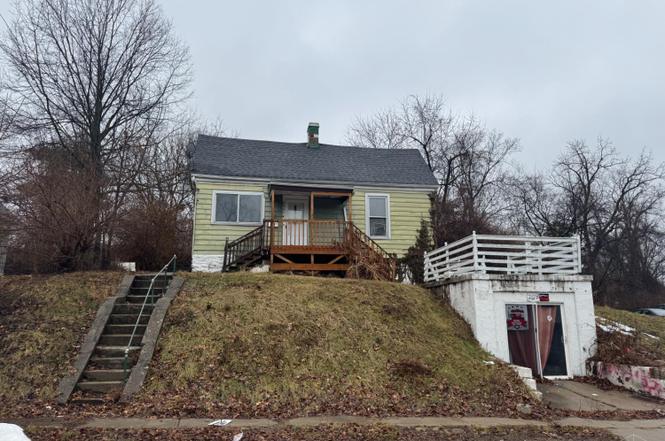
6501 Coleridge Ave · Cincinnati, OH
Flood risk 1/10 · Minimal
- FEMA flood zone
- X (unshaded)
- Chance of flooding over 30 yrs
- 0.0%
- Est. flood insurance / yr
- $473 – $860
Fire risk 1/10 · Minimal
- Est. fire insurance / yr
- $713 – $1,323
Heat risk 4/10 · Minor
- Hot days now (above 103°F)
- 7 days/yr
- Hot days in 30 yrs
- 19 days/yr
Wind risk 2/10 · Minimal
- Chance of severe wind over 30 yrs
- 1.0%
Air-quality risk 4/10 · Minor
- Unhealthy air days now
- 4 days/yr
- Unhealthy air days in 30 yrs
- 5 days/yr
Risk factors via First Street. Map © Google.
Why this score? — see what drove the B- grade
The composite is a weighted blend of 9 inputs, each scored 0–100. Each bar is that input's sub-score; the figure is the points it added to the 100-point composite (weight × sub-score).
- Cash flow +25.5/30.0
- ARV discount +15.0/15.0
- DSCR +8.4/10.0
- 1% rule +6.9/10.0
- Rent growth +4.4/5.0
- Livability +4.0/5.0
- Schools +2.5/10.0
- Condition / age +2.5/5.0
- Appreciation +0.0/10.0
$149,900
🖨 Deal sheet (PDF) 📄 Offer letter ✓ Due diligence
Listing remarks MLS
Two Story, 3 Bedrooms, 2 Full Baths, Large Living & Dining Room, Full Basement, Enclosed Porch, Attached Garage, Level Yard.
Key facts
- Hvac updated
- Electric updated
- 7,536 sq ft lot
Tags
Property features AI
Finance
- Other: Lot size approximately 0.173 acres; Located in Kennedy Hts.; directions: Montgomery Road to Coleridge Ave
- HOA & community: No HOA
Exterior
- Parking: Front garage (1 car)
- Utilities: Public water; Public sewer; Natural gas service; Gas water heater
- Home design: Traditional single-family home; One story
- Construction: Other foundation
- Exterior features: Aluminum windows; Shingle roof; Aluminum siding; Residential zoning
Interior
- Bedrooms: 3 bedrooms on main level
- Bathrooms: 2 full bathrooms on main level
- Heating & cooling: Gas heating; Cooling: Other
- Interior features: 6 total rooms; Full basement
Neighborhood map
What this means for you Summary
Snapshot
- This is a 3-bed/2.0-bath single-family listed at $150k.
Deal economics
- At list price, monthly cash flow is $349 ($4k/yr) — positive.
- The deal already cash-flows at list — no discount required.
- Meets the 1% rule at list price ($2k rent vs $150k).
- Recommended offer: $132k (12.0% below list) — sets the bar for market timing.
- Cap rate 9.1% vs local median 3.9% in Cincinnati — top-decile yield for the area; either an underpriced asset or a hidden risk that comps aren't pricing in. Stress-test before assuming the spread holds.
Location & tenants
- Location reads 80/100 on livability (#130 in OH, #1,856 nationally) — a professional / high-income tenant draw. Strengths: amenities A+, commute A+, cost of living A+; Watch: employment D, crime F.
- Cincinnati Public Schools (urban): math 25% / reading 36% proficiency, ranked #581 of 656 in OH (top 89%) — families likely to look elsewhere, expect single-tenant / working-renter base with shorter leases; 70% free/reduced lunch — lower-income household profile, screen leases tightly.
- Market conditions: Rents rising fast (+7.7%/yr); 30 active listings in the ZIP; 21 comparable units currently listed for rent nearby; rentals at typical pace (median 25d on market — plan ~3-4 weeks tenant-placement turnaround); solid renter incomes; 801 units permitted in Hamilton County in 2024 (190 in 5+ unit buildings).
Forward outlook
- Local home prices are declining (-3.0%/yr); year-one equity from $1k of loan paydown is wiped out by about $4k of value loss. Plan a longer hold.
- At projected returns (-3.0% appreciation + 7.7% rent growth), your $42k cash investment doubles in ~8 years — after that, you're playing with house money.
Negotiation context
- It's been on market 129 days — a 12% lower offer ($132k) is reasonable based on typical stale-listing flexibility.
- 14 sale attempts since 27y ago; this cycle's ask has dropped $25k (14%) from the opening price — seller is motivated, your offer sets the floor, not the list.
- Current owner paid $20k; list at $150k implies a 650% gain — meaningful room to come down on a strong offer.
Risks & watch-outs
- Watch-outs: built in 1896 — expect roof / HVAC / electrical / plumbing capex.
Questions for the listing agent
- It's been on market 129 days. Have you received any prior offers? Is the seller open to a 12% concession, seller financing, or rate buy-down credit?
- Built in 1896 — when were the roof, HVAC, electrical panel, plumbing, and water heater last replaced?
- Why hasn't it sold? Are there any deal-killer items the seller is aware of (foundation, flood, title, zoning, code violations)?
- Is there a deadline driving the sale (1031 exchange, divorce, estate, relocation)? That informs how much negotiation room exists.
- Schools are B-rated — typically a magnet for longer-tenancy family renters. What's the average tenant stay here, and is there a school-zone premium baked into asking?
- Crime grade is F in this area — have there been break-ins, vandalism, or insurance claims at this property in the last 3 years? What carrier currently insures it and at what premium?
- What's the average days-on-market for RENTAL listings here right now (not sales)? A rising rental-DOM trend means longer vacancies and softer asking-rent achievability than the comps imply.
- What's the recent tenant-quality profile in this submarket — average credit score on applications, eviction rate, late-payment / NSF rate, and stable-employment percentage? A property-management company in the area should have these aggregated.
- How much new for-sale + rental construction is in the pipeline within 1–3 miles? Heavy new supply typically softens prices + rents 12–24 months out; constrained supply supports both.
Investment metrics
- 1% rule
- 1.19% ✓
- Cap rate
- 9.09%
- Cash-on-cash
- 9.97%
- DSCR
- 1.44
- GRM
- 7.0
CMA / ARV
- ARV (on-the-fly)
- $293,664
- Comps found
- 12
Show comp detail 12 sales within ~0.75 mi
| Address | Dist | Beds/Ba | Sqft | Sold | Price | $/sf | Match |
|---|---|---|---|---|---|---|---|
| 6414 Red Bank Rd | 0.15mi | 3/2.5 | 1,280 (-2%) | 5mo | $170,000 | $133 | 83 |
| 3708 Zinsle Ave | 0.08mi | 2/1.5 (-1) | 1,272 (-3%) | 4mo | $252,000 | $198 | 82 |
| 3848 Odin Ave | 0.28mi | 3/2.0 | 1,404 (+7%) | 1mo | $315,000 | $224 | 75 |
| 6745 Belkenton Ave | 0.32mi | 3/2.0 | 1,364 (+4%) | 4mo | $263,500 | $193 | 75 |
| 6140 Grand Vista Ave | 0.64mi | 3/1.5 | 1,402 (+7%) | 2mo | $396,000 | $282 | 54 |
| 6047 Kennedy Ave | 0.44mi | 3/2.5 | 1,457 (+11%) | 6mo | $315,000 | $216 | 54 |
| 6163 Grand Vista Ave | 0.68mi | 3/2.0 | 1,419 (+8%) | 1mo | $275,000 | $194 | 53 |
| 6221 Hedge Ave | 0.34mi | 2/1.0 (-1) | 1,152 (-12%) | 3mo | $215,000 | $187 | 52 |
| 6808 Sampson Ln | 0.68mi | 2/1.5 (-1) | 1,267 (-3%) | 6mo | $288,500 | $228 | 51 |
| 6515 Iris Ave | 0.34mi | 4/1.5 (+1) | 1,487 (+13%) | 6mo | $375,138 | $252 | 50 |
| 6733 Stoll Ln | 0.74mi | 3/1.5 | 1,440 (+10%) | 0mo | $352,500 | $245 | 47 |
| 3331 Arrow Ave | 0.72mi | 2/1.0 (-1) | 1,179 (-10%) | 0mo | $310,000 | $263 | 40 |
Match score weights: distance 35% · size 25% · config 20% · recency 20%. Top-matched comps best support the ARV.
Projected returns pro-forma
-3.0% appreciation · 7.74% rent growth · sell at horizon
- IRR
- 4.0%
- Equity multiple
- 1.16×
- Total profit
- $6,861
- Equity at exit
- $22,351
- IRR
- 17.6%
- Equity multiple
- 2.79×
- Total profit
- $75,009
- Equity at exit
- $12,961
Cash invested: $41,972 (down + closing). Projections, not guarantees.
Landlord ↔ Tenant lean methodology
- Overall (STATE)
- 73 Landlord-Friendly
- State Ohio
- 73 Landlord-Friendly · R+6
- County
- — inherits STATE
- City
- — inherits STATE
ZIP-level market 45213
- Rents YoY
- 7.7%
- Active inventory
- 30
- Price-to-rent
- 7.0×
Monthly cashflow live
- Estimated rent
- $1,780 high interval (Pro) →
- Mortgage (P&I)
- −$786
- Tax from tax record
- −$209 /mo · $2,506/yr
- Insurance
- −$62
- HOA
- −$0
- Vacancy / Maint / Mgmt
- −$374
- Net cashflow
- $349
Break-even live
Sensitivity live
| Price | -10% $434 | -5% $391 | +0% $349 | +5% $306 | +10% $264 |
|---|---|---|---|---|---|
| Rent | -10% $208 | -5% $279 | +0% $349 | +5% $419 | +10% $489 |
| Rate | -1.0pp $424 | -0.5pp $387 | base $349 | +0.5pp $310 | +1.0pp $270 |
UW: 25.0% down · 7.5% · 30yr · 1.5% tax · 5.0% vac · 8.0% maint · 8.0% mgmt
Financing live
Cash to close
- Down payment
- $37,475
- Closing costs
- $4,497
- Reserves months
- —
- Total cash needed
- —
Loan-product check · same deal, 3 products live
Conventional
25% down · 7.5% · 30yr
- Down + closing
- —
- Monthly P&I
- —
- Monthly cashflow
- —
- DSCR
- —
- Eligible?
- —
Personal DTI + credit; lowest rate.
DSCR
20% down · 8.5% · 30yr
- Down + closing
- —
- Monthly P&I
- —
- Monthly cashflow
- —
- DSCR
- —
- Eligible?
- —
No personal income docs; deal must DSCR.
Hard money
10% down · 12.0% · 12mo
- Down + closing
- —
- Monthly P&I
- —
- Monthly cashflow
- —
- DSCR
- —
- Eligible?
- —
Short-term bridge; refi at stabilization.
Rent comps 21 comps
| Address | Beds | Baths | Sqft | Rent | $/sqft | DOM | Units | Dist |
|---|---|---|---|---|---|---|---|---|
| 3701 Iona Ave Cincinnati, OH | 2.0 | 1.5 | 900 | $1,475 | $1.64 | 24d | 1 | 0.22mi |
| 3647 Northdale Pl Unit 3657-2 Cincinnati, OH | 2.0 | 1.0 | 1000 | $1,195 | $1.20 | 24d | 1 | 0.33mi |
| 3642 Northdale Pl Unit 2 Cincinnati, OH | 2.0 | 1.0 | 900 | $1,250 | $1.39 | 15d | 1 | 0.35mi |
| 3942 Standish Ave Cincinnati, OH | 3.0 | 3.0 | 1279 | $2,750 | $2.15 | 44d | 1 | 0.45mi |
| 6830 Withany Ave Cincinnati, OH | 3.0 | 1.0 | 972 | $1,795 | $1.85 | 24d | 1 | 0.47mi |
| 6015 Red Bank Rd Cincinnati, OH | 3.0 | 2.0 | 1175 | $1,600 | $1.36 | 5d | 1 | 0.49mi |
| 3501 Section Rd Cincinnati, OH | 2.0–3.0 | 2.0 | 1140 | $1,695 | $1.49 | 4d | 5 | 0.55mi |
| 6142 Dryden Ave Unit 4 Cincinnati, OH | 2.0 | 1.0 | 950 | $1,250 | $1.32 | 24d | 1 | 0.60mi |
| 5821 Valley View Ave Cincinnati, OH | 3.0 | 1.0 | 1574 | $1,700 | $1.08 | 24d | 1 | 0.71mi |
| 6847 Stewart Rd Cincinnati, OH | 1.0–2.0 | 1.0–2.0 | 777 | $2,165 | $2.78 | 2d | 11 | 0.87mi |
| 5805 Woodmont Ave Cincinnati, OH | 4.0 | 2.5 | 1681 | $2,495 | $1.48 | 15d | 1 | 0.99mi |
| 5601 Viewpointe Dr Cincinnati, OH | 2.0–3.0 | 2.0 | 1102 | $2,293 | $2.08 | 2d | 24 | 1.02mi |
| 3163 Woodford Rd Cincinnati, OH | 1.0–2.0 | 1.0–1.5 | 862 | $1,399 | $1.62 | 2d | 14 | 1.03mi |
| 7505 Montgomery Rd #14 Cincinnati, OH | 3.0 | 1.0 | 1032 | $1,595 | $1.55 | 24d | 1 | 1.05mi |
| 5500 Ehrling Rd Cincinnati, OH | 3.0 | 2.0 | 1408 | $2,031 | $1.44 | 24d | 1 | 1.06mi |
| 2929 Cortelyou Pl Cincinnati, OH | 2.0 | 1.0 | 1198 | $1,425 | $1.19 | 24d | 1 | 1.09mi |
| 5552 Ehrling Rd Cincinnati, OH | 3.0 | 2.0 | 1254 | $2,105 | $1.68 | 2d | 1 | 1.10mi |
| 6020 Montgomery Rd Cincinnati, OH | 2.0 | 1.0–2.0 | 893 | $3,199 | $3.58 | 2d | 25 | 1.13mi |
| 3167 Auten Ave Cincinnati, OH | 3.0 | 1.5 | 1260 | $2,000 | $1.59 | 15d | 1 | 1.20mi |
| 2858 Losantiville Ave Cincinnati, OH | 2.0 | 2.5 | 1800 | $1,950 | $1.08 | 24d | 1 | 1.25mi |
| 7710 Plainfield Rd Cincinnati, OH | 2.0 | 1.0 | 1100 | $1,835 | $1.67 | 44d | 1 | 1.39mi |
Listing history 43 events
-
2026-06-21days on market $149,900 Active 129 DOM
-
2026-06-18days on market $149,900 Active 126 DOM
-
2026-06-17days on market $149,900 Active 125 DOM
-
2026-06-16days on market $149,900 Active 124 DOM
-
2026-06-15days on market $149,900 Active 123 DOM
-
2026-06-13days on market $149,900 Active 121 DOM
-
2026-06-13days on market $149,900 Active 120 DOM
-
2026-06-09days on market $149,900 Active 117 DOM
-
2026-06-08days on market $149,900 Active 116 DOM
-
2026-06-07days on market $149,900 Active 115 DOM
-
2026-06-03days on market $149,900 Active 111 DOM
-
2026-06-02days on market $149,900 Active 110 DOM
-
2026-06-01days on market $149,900 Active 109 DOM
-
2026-05-31days on market $149,900 Active 108 DOM
-
2026-04-20price $149,900
-
2026-02-12$175,000 Active
-
2018-08-14soldstatus $20,000 Sold 128-char remark
Show marketing remark (128 chars)
Two Story, 3 Bedrooms, 2 Full Baths, Large Living & Dining Room, Full Basement, Enclosed Porch, Attached Garage, Level Yard.
-
2018-07-16historical Accept Backup Offers 128-char remark
Show marketing remark (128 chars)
Two Story, 3 Bedrooms, 2 Full Baths, Large Living & Dining Room, Full Basement, Enclosed Porch, Attached Garage, Level Yard.
-
2018-07-09status Active 128-char remark
Show marketing remark (128 chars)
Two Story, 3 Bedrooms, 2 Full Baths, Large Living & Dining Room, Full Basement, Enclosed Porch, Attached Garage, Level Yard.
-
2018-06-28historical Accept Backup Offers 128-char remark
Show marketing remark (128 chars)
Two Story, 3 Bedrooms, 2 Full Baths, Large Living & Dining Room, Full Basement, Enclosed Porch, Attached Garage, Level Yard.
-
2018-06-26status Active 128-char remark
Show marketing remark (128 chars)
Two Story, 3 Bedrooms, 2 Full Baths, Large Living & Dining Room, Full Basement, Enclosed Porch, Attached Garage, Level Yard.
-
2018-06-15historical Accept Backup Offers 128-char remark
Show marketing remark (128 chars)
Two Story, 3 Bedrooms, 2 Full Baths, Large Living & Dining Room, Full Basement, Enclosed Porch, Attached Garage, Level Yard.
-
2018-06-06status Active 128-char remark
Show marketing remark (128 chars)
Two Story, 3 Bedrooms, 2 Full Baths, Large Living & Dining Room, Full Basement, Enclosed Porch, Attached Garage, Level Yard.
-
2018-04-19historical Accept Backup Offers 128-char remark
Show marketing remark (128 chars)
Two Story, 3 Bedrooms, 2 Full Baths, Large Living & Dining Room, Full Basement, Enclosed Porch, Attached Garage, Level Yard.
-
2018-04-03$29,900 Active 128-char remark
Show marketing remark (128 chars)
Two Story, 3 Bedrooms, 2 Full Baths, Large Living & Dining Room, Full Basement, Enclosed Porch, Attached Garage, Level Yard.
-
2005-07-04historical
-
2005-06-08soldstatus $35,000
-
2005-05-16$34,900
-
2005-03-11$39,900
-
2005-03-07historical
-
2005-01-25$46,900
-
2005-01-15historical
-
2004-12-16$53,900
-
2004-12-04historical
-
2004-11-04$57,900
-
2004-10-31historical
-
2004-07-13$61,900
-
2002-06-24historical
-
2002-06-19historical
-
2002-03-29$84,900
-
2002-02-01historical
-
2001-10-26$115,000
-
1999-05-26$89,900
ⓘ Source: listings_history table (triggers on properties + properties_extension) + one-shot
backfill from property_details.listing_events for pre-trigger history.
Tax reassessment forecast OH · Partial reset (capped growth)
- Current annual tax
- $2,506 · $209/mo
- Projected year-2 tax
- $2,506 · $209/mo
- Expected delta
- $0/yr ($0/mo · 0.0%)
ⓘ Screening estimate from a state-policy table — verify with the county assessor before closing.
Climate risk First Street
- Flood 1/10 Low FEMA zone X (unshaded) · 0% chance over 30 yrs
- Wildfire 1/10 Low
- Heat 4/10 Moderate 7 d/yr ≥103°F today · 19 d/yr by 30 yrs out
- Wind 2/10 Low 100% chance of damaging wind over 30 yrs
- Air quality 4/10 Moderate 4 unhealthy d/yr today · 5 by 30 yrs out
Nearby sold comps map
Loading sold comps map…
Walkable amenities ~0.75 mi
Loading nearby amenities…
Taxation est. · year 1
- Rental income
- $21,360
- − Mortgage interest
- −$8,397
- − Property taxes
- −$2,506
- − Insurance
- −$750
- − Repairs & maintenance
- −$1,709
- − Management
- −$1,709
- − Depreciation
- −$4,361
- Taxable income
- $1,930
- Est. tax owed @ 24.0%
- −$463
- After-tax cash flow
- $3,723/yr
For passive investors: Depreciation is non-cash, so a rental often shows a tax loss while cash-flowing — sheltering income. Rental losses are passive: they offset passive income freely, and up to $25,000/yr can offset ordinary (W-2) income if you actively participate and your MAGI is under $100k (phasing out to $0 by $150k); unused losses carry forward. On sale, claimed depreciation is recaptured at up to 25%, and gains may owe capital-gains tax (a 1031 exchange can defer both). Figures are a year-1 estimate at your 24.0% rate — not tax advice; consult a CPA.
Schools (NCES district)
- District
- Cincinnati Public Schools
- NCES district ID
- 3904375
- Math proficiency
- 25% ▼ -19.00%
- Reading proficiency
- 36% ▼ -14.00%
- Median HH income
- $35,743
- Composite
- 25.21/100
- National rank
- #7508
- State rank
- #581 of 656 in OH
Livability — Cincinnati
- Score
- 80/100
- State rank
- #130
- US rank
- #1856
Category grades
Schools grade is shown separately in the Schools card above.
Census & demographics
- Census place
- Cincinnati, OH
- County
- Hamilton County · 701,295 people
- City population
- 505,555
- Metro
- Cincinnati, OH-KY-IN
- Population (ZIP)
- 11,139
- Household income
- $76,356
- Rent vs Own
- Severe rent burden
- 376.0
Population outlook (Hamilton County) Hauer SSP2
- Today (2025)
- 826,054 people
- By 2030
- 830,947 · +0.6%
- By 2040
- 832,319 · +0.8%
- By 2050
- 822,428 · -0.4%
- By 2075
- 788,688 · -4.5%
- By 2100
- 710,674 · -14.0%
Race, ethnicity, and origin ACS 2023
- Neighborhood character
- Diverse neighborhood (Simpson 0.55)
- Race & ethnicity
- White 60% Black 29% Two or more races 5% Hispanic / Latino 2% Asian 2%
- Common ancestry
- Romanian 2% Italian 2% Iranian 1%
- Foreign-born
- 3% · China, Canada
- Languages at home
- 96% English-only · Spanish 2% Chinese 1%
Political lean MEDSL · Hamilton
- 2024 margin
- D (+14.9) · D 57.0% · R 42.1%
- 2008→2024 swing
- +7.9pp toward D · 2008: 7.0pp · 2024: 14.9pp
- All cycles
- 2024: D+14.9 2020: D+15.9 2016: D+9.5 2012: D+4.9 2008: D+7.0
Not yet ingested
- Civics
- —
Market trends
- HPI YoY
- ▼ -245.11%
- Current HPI
- 282.4409
- Rent YoY
- ▲ 7.74%
- Metro
- Cincinnati, OH-KY-IN
- State GDP YoY
- ▲ 1.98%
- F500 in state
- 48
Industry mix (Fortune 500 HQ in OH)
| Industry | F500 HQs | Revenue |
|---|---|---|
| Insurance | 3 | $145B |
|
||
| Industrial Machinery | 3 | $49B |
|
||
| Financial Services | 3 | $24B |
|
||
| Consumer Goods | 2 | $93B |
|
||
| Aerospace / Defense | 2 | $47B |
|
||
| Utilities | 2 | $33B |
|
||
Price history
+66.7% since first listed29 events — show timeline
- 2026-04-20 Price Changed $149,900 Cincy MLS
- 2026-02-12 Listed $175,000 Cincy MLS
- 2018-08-14 Sold (MLS) $20,000 Cincy MLS
- 2018-07-16 Contingent — Cincy MLS
- 2018-07-09 Relisted — Cincy MLS
- 2018-06-28 Contingent — Cincy MLS
- 2018-06-26 Relisted — Cincy MLS
- 2018-06-15 Contingent — Cincy MLS
- 2018-06-06 Relisted — Cincy MLS
- 2018-04-19 Contingent — Cincy MLS
- 2018-04-03 Listed $29,900 Cincy MLS
- 2005-07-04 Listing Removed — Cincy MLS
- 2005-06-08 Sold (MLS) $35,000 Cincy MLS
- 2005-05-16 Listed $34,900 Cincy MLS
- 2005-03-11 Listed $39,900 Cincy MLS
- 2005-03-07 Listing Removed — Cincy MLS
- 2005-01-25 Listed $46,900 Cincy MLS
- 2005-01-15 Listing Removed — Cincy MLS
- 2004-12-16 Listed $53,900 Cincy MLS
- 2004-12-04 Listing Removed — Cincy MLS
- 2004-11-04 Listed $57,900 Cincy MLS
- 2004-10-31 Listing Removed — Cincy MLS
- 2004-07-13 Listed $61,900 Cincy MLS
- 2002-06-24 Listing Removed — Cincy MLS
- 2002-06-19 Listing Removed — Cincy MLS
- 2002-03-29 Listed $84,900 Cincy MLS
- 2002-02-01 Listing Removed — Cincy MLS
- 2001-10-26 Listed $115,000 Cincy MLS
- 1999-05-26 Listed $89,900 Cincy MLS
Property tax history
+5.9%/yrLatest (2025): $2,506 · +0.1% YoY. Source: county tax records.
Cash-flow waterfall
monthlySold comps — $/sqft
last 12 mo · ≤1 miLoading sold comps…