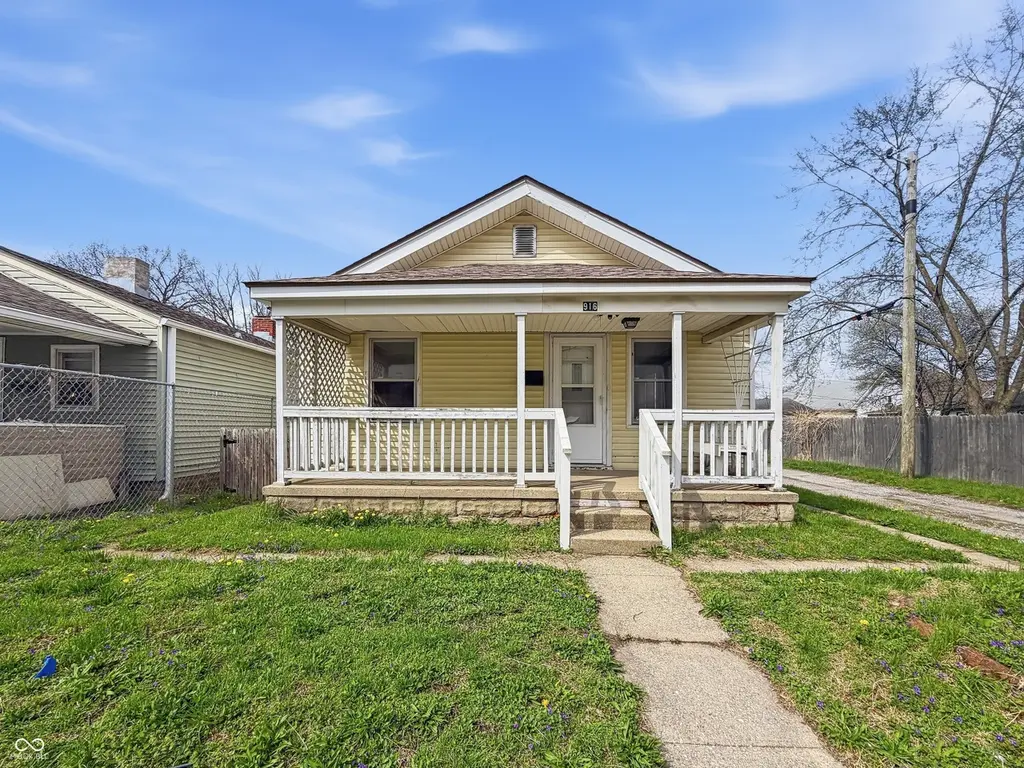
916 E Beecher St · Indianapolis city (balance), IN
Flood risk 6/10 · Moderate
- FEMA flood zone
- X (shaded)
- Chance of flooding over 30 yrs
- 0.71%
- Est. flood insurance / yr
- $507 – $1,088
Fire risk 1/10 · Minimal
- Est. fire insurance / yr
- $717 – $1,331
Heat risk 4/10 · Minor
- Hot days now (above 101°F)
- 7 days/yr
- Hot days in 30 yrs
- 19 days/yr
Wind risk 2/10 · Minimal
- Chance of severe wind over 30 yrs
- 0.0%
Air-quality risk 3/10 · Minor
- Unhealthy air days now
- 2 days/yr
- Unhealthy air days in 30 yrs
- 3 days/yr
Risk factors via First Street. Map © Google.
Why this score? — see what drove the C+ grade
The composite is a weighted blend of 9 inputs, each scored 0–100. Each bar is that input's sub-score; the figure is the points it added to the 100-point composite (weight × sub-score).
- Cash flow +22.6/30.0
- ARV discount +15.0/15.0
- DSCR +7.2/10.0
- 1% rule +6.4/10.0
- Rent growth +3.2/5.0
- Livability +2.5/5.0
- Condition / age +2.5/5.0
- Schools +1.4/10.0
- Appreciation +0.0/10.0
$129,650
🖨 Deal sheet 📄 Offer letter ✓ Due diligence
Listing remarks MLS
This inviting ranch-style home offers a comfortable layout and a welcoming feel the moment you arrive. With just the right amount of space and thoughtful design, it's easy to picture settling in and making it your own. Whether you're downsizing or looking for a place with charm and simplicity, this one is worth a closer look. Built in 1918, this single-level home offers 1,248 square feet of living space and features low-maintenance vinyl siding paired with vinyl windows for added efficiency. Inside, you'll find 2 bedrooms and 2 bathrooms, providing flexibility and convenience for everyday living. A 2-car carport adds practical covered parking, rounding out a property that blends comfort, functionality, and potential.
Key facts
- 3,659 sq ft lot
- Built 1918
- Listed 64 days
Neighborhood map
What this means for you Summary
Snapshot
- This is a 2-bed/2.0-bath single-family listed at $130k.
Deal economics
- At list price, monthly cash flow is $220 ($3k/yr) — positive.
- The deal already cash-flows at list — no discount required.
- Meets the 1% rule at list price ($1k rent vs $130k).
- Recommended offer: $122k (6.0% below list) — sets the bar for market timing.
- Cap rate 8.3% vs local median 4.4% in Indianapolis city (balance) — top-decile yield for the area; either an underpriced asset or a hidden risk that comps aren't pricing in. Stress-test before assuming the spread holds.
Location & tenants
- Location reads: area grade C — affects rentability + tenant quality, not the cash-flow math above.
- Indianapolis Public Schools (urban): math 14% / reading 20% proficiency, ranked #286 of 301 in IN (top 95%) — low school quality limits family demand, transient renter base, plan for 1-2y turnover; 77% free/reduced lunch — lower-income household profile, screen leases tightly.
- Market conditions: Rents rising (+2.9%/yr); 493 active listings in the ZIP; 40 comparable units currently listed for rent nearby; rentals at typical pace (median 24d on market — plan ~3-4 weeks tenant-placement turnaround); 1,906 units permitted in Marion County in 2024 (621 in 5+ unit buildings).
- This rent runs 31% of the median local income ($57k/yr) — at the standard rent-burdened threshold; future hikes will face affordability resistance.
Forward outlook
- Local home prices are declining (-3.0%/yr); year-one equity from $896 of loan paydown is wiped out by about $4k of value loss. Plan a longer hold.
- Marion County population projected at +18% by 2050 — long-run rental-demand tailwind backs the buy-and-hold thesis.
Negotiation context
- It's been on market 64 days — a 6% lower offer ($122k) is reasonable based on typical stale-listing flexibility.
Risks & watch-outs
- Watch-outs: built in 1918 — expect roof / HVAC / electrical / plumbing capex.
- Climate carrying-cost: major flood risk — expect insurance premiums to compound above CPI over the hold.
Questions for the listing agent
- It's been on market 64 days. Have you received any prior offers? Is the seller open to a 6% concession, seller financing, or rate buy-down credit?
- Built in 1918 — when were the roof, HVAC, electrical panel, plumbing, and water heater last replaced?
- Why hasn't it sold? Are there any deal-killer items the seller is aware of (foundation, flood, title, zoning, code violations)?
- Is there a deadline driving the sale (1031 exchange, divorce, estate, relocation)? That informs how much negotiation room exists.
- What's the average days-on-market for RENTAL listings here right now (not sales)? A rising rental-DOM trend means longer vacancies and softer asking-rent achievability than the comps imply.
- What's the recent tenant-quality profile in this submarket — average credit score on applications, eviction rate, late-payment / NSF rate, and stable-employment percentage? A property-management company in the area should have these aggregated.
- How much new for-sale + rental construction is in the pipeline within 1–3 miles? Heavy new supply typically softens prices + rents 12–24 months out; constrained supply supports both.
Investment metrics
- 1% rule
- 1.14% ✓
- Cap rate
- 8.33%
- Cash-on-cash
- 7.26%
- DSCR
- 1.32
- GRM
- 7.3
CMA / ARV
- ARV (median comp)
- $186,922
- List price
- $129,650
- Delta
- -30.64%
- Verdict
- UNDERPRICED
- Comps
- 20 within 1.0 mi
Show comp detail 12 sales within ~0.75 mi
| Address | Dist | Beds/Ba | Sqft | Sold | Price | $/sf | Match |
|---|---|---|---|---|---|---|---|
| 1869 New St | 0.02mi | 3/2.0 (+1) | 1,280 (+3%) | 1mo | $337,000 | $263 | 89 |
| 413 E Caven St | 0.34mi | 2/2.0 | 1,192 (-4%) | 1mo | $200,000 | $168 | 76 |
| 1127 E Kelly St | 0.51mi | 2/2.0 | 1,280 (+3%) | 2mo | $185,000 | $145 | 70 |
| 225 E Minnesota St | 0.51mi | 2/1.0 | 1,270 (+2%) | 1mo | $185,000 | $146 | 68 |
| 1237 E Pleasant Run Parkway South Dr | 0.45mi | 2/1.0 | 1,344 (+8%) | 1mo | $150,000 | $112 | 61 |
| 1234 E Pleasant Run Parkway North Dr | 0.48mi | 2/2.0 | 1,115 (-11%) | 1mo | $215,000 | $193 | 59 |
| 1413 S New Jersey St | 0.52mi | 2/2.0 | 1,103 (-12%) | 1mo | $180,000 | $163 | 56 |
| 1441 S New Jersey St | 0.49mi | 2/1.0 | 1,111 (-11%) | 1mo | $205,000 | $185 | 54 |
| 1426 E Bradbury Ave | 0.71mi | 3/2.0 (+1) | 1,320 (+6%) | 1mo | $208,000 | $158 | 51 |
| 726 Sanders St | 0.63mi | 3/2.0 (+1) | 1,404 (+12%) | 3mo | $330,000 | $235 | 42 |
| 2027 Spruce St | 0.58mi | 3/2.0 (+1) | 1,432 (+15%) | 1mo | $210,000 | $147 | 42 |
| 35 Iowa St | 0.75mi | 3/2.5 (+1) | 1,400 (+12%) | 2mo | $239,000 | $171 | 36 |
Match score weights: distance 35% · size 25% · config 20% · recency 20%. Top-matched comps best support the ARV.
Projected returns pro-forma
-3.0% appreciation · 2.88% rent growth · sell at horizon
- IRR
- -5.3%
- Equity multiple
- 0.80×
- Total profit
- $-7,148
- Equity at exit
- $19,331
- IRR
- 4.3%
- Equity multiple
- 1.31×
- Total profit
- $11,276
- Equity at exit
- $11,210
Cash invested: $36,302 (down + closing). Projections, not guarantees.
Landlord ↔ Tenant lean methodology
- Overall (STATE)
- 90 Strongly Landlord-Friendly
- State Indiana
- 90 Strongly Landlord-Friendly · R+11
- County
- — inherits STATE
- City
- — inherits STATE
ZIP-level market 46203
- Home prices YoY
- -26.7%
- Rents YoY
- 2.9%
- Active inventory
- 493
- Price-to-rent
- 7.3×
Monthly cashflow live
- Estimated rent
- $1,478 high interval (Pro) →
- Mortgage (P&I)
- −$680
- Tax from tax record
- −$214 /mo · $2,574/yr
- Insurance
- −$54
- HOA
- −$0
- Vacancy / Maint / Mgmt
- −$310
- Net cashflow
- $220
Break-even live
UW: 25.0% down · 7.5% · 30yr · 1.5% tax · 5.0% vac · 8.0% maint · 8.0% mgmt
Financing live
Cash to close
- Down payment
- $32,412
- Closing costs
- $3,890
- Reserves months
- —
- Total cash needed
- —
Loan-product check · same deal, 3 products live
Conventional
25% down · 7.5% · 30yr
- Down + closing
- —
- Monthly P&I
- —
- Monthly cashflow
- —
- DSCR
- —
- Eligible?
- —
Personal DTI + credit; lowest rate.
DSCR
20% down · 8.5% · 30yr
- Down + closing
- —
- Monthly P&I
- —
- Monthly cashflow
- —
- DSCR
- —
- Eligible?
- —
No personal income docs; deal must DSCR.
Hard money
10% down · 12.0% · 12mo
- Down + closing
- —
- Monthly P&I
- —
- Monthly cashflow
- —
- DSCR
- —
- Eligible?
- —
Short-term bridge; refi at stabilization.
Rent comps 40 comps
| Address | Beds | Baths | Sqft | Rent | $/sqft | DOM | Units | Dist |
|---|---|---|---|---|---|---|---|---|
| 823 Iowa St Indianapolis, IN | 2.0 | 1.0 | 812 | $1,100 | $1.35 | 44d | 1 | 0.13mi |
| 1833 Orleans St Unit 1 Indianapolis, IN | 3.0 | 1.0 | 1260 | $1,350 | $1.07 | 44d | 1 | 0.16mi |
| 1861 Barth Ave Unit 1861 Indianapolis, IN | 2.0 | 1.0 | 1300 | $1,600 | $1.23 | 23d | 1 | 0.17mi |
| 620 E Beecher St Indianapolis, IN | 3.0 | 2.0 | 1072 | $1,639 | $1.53 | 20d | 1 | 0.19mi |
| 2103 Ringgold Ave Indianapolis, IN | 1.0 | 1.0 | 1090 | $775 | $0.71 | 14d | 1 | 0.22mi |
| 944 E Minnesota St Indianapolis, IN | 2.0 | 2.0 | 944 | $1,299 | $1.38 | 44d | 1 | 0.22mi |
| 2109 Singleton St Indianapolis, IN | 3.0 | 2.0 | 1340 | $2,100 | $1.57 | 7d | 1 | 0.29mi |
| 438 E Beecher St Indianapolis, IN | 3.0 | 2.5 | 1500 | $1,450 | $0.97 | 23d | 1 | 0.30mi |
| 835 Weghorst St Unit 837 Indianapolis, IN | 3.0 | 1.5 | 1500 | $1,399 | $0.93 | 23d | 1 | 0.32mi |
| 512 E Minnesota St Unit 203 Indianapolis, IN | 2.0 | 1.0 | 903 | $1,195 | $1.32 | 23d | 1 | 0.33mi |
| 1011 E Raymond St Indianapolis, IN | 2.0 | 2.0 | 1100 | $1,350 | $1.23 | 23d | 1 | 0.35mi |
| 1514 Ringgold Ave Indianapolis, IN | 3.0 | 1.0 | 1064 | $1,295 | $1.22 | 44d | 1 | 0.39mi |
| 1437 S East St Indianapolis, IN | 2.0 | 2.0 | 1114 | $1,425 | $1.28 | 44d | 1 | 0.45mi |
| 1439 South East St Indianapolis, IN | 2.0 | 2.0 | 1114 | $1,425 | $1.28 | 20d | 1 | 0.45mi |
| 2020 Boyd Ave Indianapolis, IN | 3.0 | 1.5 | 1160 | $1,450 | $1.25 | 23d | 1 | 0.49mi |
| 2018 Boyd Ave Indianapolis, IN | 3.0 | 1.5 | 1160 | $1,350 | $1.16 | 44d | 1 | 0.49mi |
| 1742 Thaddeus St Unit 1742-A Indianapolis, IN | 3.0 | 2.0 | 1350 | $1,600 | $1.19 | 14d | 1 | 0.50mi |
| 224 Iowa St Indianapolis, IN | 3.0 | 1.0 | 1254 | $1,450 | $1.16 | 23d | 1 | 0.51mi |
| 1436 S New Jersey St Unit A Indianapolis, IN | 3.0 | 2.5 | 1300 | $2,100 | $1.62 | 23d | 1 | 0.51mi |
| 726 Parkway Ave Indianapolis, IN | 3.0 | 2.0 | 1150 | $2,195 | $1.91 | 17d | 1 | 0.51mi |
| 1026 Orange St Indianapolis, IN | 2.0 | 2.0 | 1007 | $1,600 | $1.59 | 16d | 1 | 0.52mi |
| 1024 Orange St Indianapolis, IN | 2.0 | 2.0 | 1007 | $1,650 | $1.64 | 44d | 1 | 0.52mi |
| 1045 Orange St Indianapolis, IN | 2.0 | 1.0 | 1232 | $2,200 | $1.79 | 44d | 1 | 0.52mi |
| 1045 Orange St Indianapolis, IN | 2.0 | 1.0 | 1232 | $2,000 | $1.62 | 23d | 1 | 0.52mi |
| 1729 Thaddeus St Unit 1729-B Indianapolis, IN | 3.0 | 2.0 | 1350 | $1,600 | $1.19 | 14d | 1 | 0.53mi |
| 614 Parkway Ave Indianapolis, IN | 3.0 | 2.0 | 1360 | $1,900 | $1.40 | 22d | 1 | 0.54mi |
| 2209 Ransdell St Indianapolis, IN | 2.0 | 1.0 | 710 | $900 | $1.27 | 44d | 1 | 0.54mi |
| 1247 Wright St Indianapolis, IN | 3.0 | 1.5 | 1247 | $1,750 | $1.40 | 18d | 1 | 0.56mi |
| 1318 Shelby St Unit B 120% AMI Indianapolis, IN | 1.0 | 1.0 | 1116 | $1,350 | $1.21 | 23d | 1 | 0.57mi |
| 1409 S Alabama St Indianapolis, IN | 2.0 | 1.0 | 949 | $1,245 | $1.31 | 44d | 1 | 0.59mi |
| 1407 S Alabama St Indianapolis, IN | 2.0 | 1.0 | 949 | $1,150 | $1.21 | 44d | 1 | 0.59mi |
| 1035 Sanders St Unit 163 Indianapolis, IN | 2.0 | 1.0 | 1481 | $1,921 | $1.30 | 44d | 1 | 0.59mi |
| 2236 Ransdell St Indianapolis, IN | 2.0 | 1.0 | 850 | $1,150 | $1.35 | 44d | 1 | 0.61mi |
| 1756 Delaware St Indianapolis, IN | 3.0 | 2.0 | 1014 | $1,300 | $1.28 | 44d | 1 | 0.61mi |
| 1756 S Delaware St Unit 1754 Indianapolis, IN | 3.0 | 2.0 | 1014 | $1,300 | $1.28 | 14d | 1 | 0.61mi |
| 704 Sanders St Indianapolis, IN | 2.0 | 1.0 | 1290 | $1,275 | $0.99 | 23d | 1 | 0.62mi |
| 1140 Shelby St Apt 515 Indianapolis, IN | 2.0 | 2.0 | 1181 | $2,090 | $1.77 | 23d | 1 | 0.66mi |
| 932 E Morris St Indianapolis, IN | 2.0 | 2.0 | 1483 | $1,900 | $1.28 | 3d | 1 | 0.67mi |
| 736 E Morris St Indianapolis, IN | 2.0 | 1.5 | 1500 | $1,195 | $0.80 | 4d | 1 | 0.68mi |
| 436 Sanders St Indianapolis, IN | 1.0 | 1.0 | 800 | $800 | $1.00 | 7d | 1 | 0.69mi |
Listing history 16 events
-
2026-06-18days on market $129,650 Active 64 DOM
-
2026-06-17days on market $129,650 Active 63 DOM
-
2026-06-16days on market $129,650 Active 62 DOM
-
2026-06-15days on market $129,650 Active 61 DOM
-
2026-06-13days on market $129,650 Active 59 DOM
-
2026-06-13pricedays on market $129,650 Active 58 DOM
-
2026-06-09days on market $139,650 Active 55 DOM
-
2026-06-08days on market $139,650 Active 54 DOM
-
2026-06-07days on market $139,650 Active 53 DOM
-
2026-06-03days on market $139,650 Active 49 DOM
-
2026-06-02days on market $139,650 Active 48 DOM
-
2026-06-01days on market $139,650 Active 47 DOM
-
2026-05-31days on market $139,650 Active 46 DOM
-
2026-05-08price $139,650 729-char remark
Show marketing remark (729 chars)
This inviting ranch-style home offers a comfortable layout and a welcoming feel the moment you arrive. With just the right amount of space and thoughtful design, it's easy to picture settling in and making it your own. Whether you're downsizing or looking for a place with charm and simplicity, this one is worth a closer look. Built in 1918, this single-level home offers 1,248 square feet of living space and features low-maintenance vinyl siding paired with vinyl windows for added efficiency. Inside, you'll find 2 bedrooms and 2 bathrooms, providing flexibility and convenience for everyday living. A 2-car carport adds practical covered parking, rounding out a property that blends comfort, functionality, and potential.
-
2026-04-22price $144,650 729-char remark
Show marketing remark (729 chars)
This inviting ranch-style home offers a comfortable layout and a welcoming feel the moment you arrive. With just the right amount of space and thoughtful design, it's easy to picture settling in and making it your own. Whether you're downsizing or looking for a place with charm and simplicity, this one is worth a closer look. Built in 1918, this single-level home offers 1,248 square feet of living space and features low-maintenance vinyl siding paired with vinyl windows for added efficiency. Inside, you'll find 2 bedrooms and 2 bathrooms, providing flexibility and convenience for everyday living. A 2-car carport adds practical covered parking, rounding out a property that blends comfort, functionality, and potential.
-
2026-04-15$154,650 Active 729-char remark
Show marketing remark (729 chars)
This inviting ranch-style home offers a comfortable layout and a welcoming feel the moment you arrive. With just the right amount of space and thoughtful design, it's easy to picture settling in and making it your own. Whether you're downsizing or looking for a place with charm and simplicity, this one is worth a closer look. Built in 1918, this single-level home offers 1,248 square feet of living space and features low-maintenance vinyl siding paired with vinyl windows for added efficiency. Inside, you'll find 2 bedrooms and 2 bathrooms, providing flexibility and convenience for everyday living. A 2-car carport adds practical covered parking, rounding out a property that blends comfort, functionality, and potential.
ⓘ Source: listings_history table (triggers on properties + properties_extension) + one-shot
backfill from property_details.listing_events for pre-trigger history.
Tax reassessment forecast IN · Partial reset (capped growth)
- Current annual tax
- $2,574 · $214/mo
- Projected year-2 tax
- $2,574 · $214/mo
- Expected delta
- $0/yr ($0/mo · 0.0%)
ⓘ Screening estimate from a state-policy table — verify with the county assessor before closing.
Climate risk First Street
- Flood 6/10 Major FEMA zone X (shaded) · 71% chance over 30 yrs
- Wildfire 1/10 Low
- Heat 4/10 Moderate 7 d/yr ≥101°F today · 19 d/yr by 30 yrs out
- Wind 2/10 Low 0% chance of damaging wind over 30 yrs
- Air quality 3/10 Moderate 2 unhealthy d/yr today · 3 by 30 yrs out
Nearby sold comps map
Loading sold comps map…
Walkable amenities ~0.75 mi
Loading nearby amenities…
Taxation est. · year 1
- Rental income
- $17,741
- − Mortgage interest
- −$7,262
- − Property taxes
- −$2,574
- − Insurance
- −$648
- − Repairs & maintenance
- −$1,419
- − Management
- −$1,419
- − Depreciation
- −$3,772
- Taxable income
- $647
- Est. tax owed @ 24.0%
- −$155
- After-tax cash flow
- $2,480/yr
For passive investors: Depreciation is non-cash, so a rental often shows a tax loss while cash-flowing — sheltering income. Rental losses are passive: they offset passive income freely, and up to $25,000/yr can offset ordinary (W-2) income if you actively participate and your MAGI is under $100k (phasing out to $0 by $150k); unused losses carry forward. On sale, claimed depreciation is recaptured at up to 25%, and gains may owe capital-gains tax (a 1031 exchange can defer both). Figures are a year-1 estimate at your 24.0% rate — not tax advice; consult a CPA.
Schools (NCES district)
- District
- Indianapolis Public Schools
- NCES district ID
- 1804770
- Math proficiency
- 14% ▼ -7.00%
- Reading proficiency
- 20% ▼ -3.00%
- Median HH income
- $32,034
- Composite
- 13.69/100
- National rank
- #9499
- State rank
- #286 of 301 in IN
Livability — Indianapolis city (balance)
No livability data for this city. (Only ~50 U.S. cities are tracked.)
Census & demographics
- Census place
- Indianapolis city (balance), IN
- County
- Marion County · 998,460 people
- City population
- 881,119
- Metro
- Indianapolis-Carmel-Anderson, IN
- Population (ZIP)
- 37,758
- Household income
- $57,393
- Rent vs Own
- Severe rent burden
- 1499.0
Population outlook (Marion County) Hauer SSP2
- Today (2025)
- 1,025,572 people
- By 2030
- 1,065,727 · +3.9%
- By 2040
- 1,141,577 · +11.3%
- By 2050
- 1,208,920 · +17.9%
- By 2075
- 1,367,288 · +33.3%
- By 2100
- 1,438,201 · +40.2%
Race, ethnicity, and origin ACS 2023
- Neighborhood character
- Predominantly White (69%)
- Race & ethnicity
- White 69% Hispanic / Latino 14% Black 12% Two or more races 8% Asian 2% Native American 1%
- Hispanic origin (detail)
- Mexican 12% Puerto Rican 1%
- Common ancestry
- Slovak 2% Lithuanian 2% Italian 1%
- Foreign-born
- 8% · Canada
- Languages at home
- 88% English-only · Spanish 10% Other Indo-European 1%
Political lean MEDSL · Marion
- 2024 margin
- Strong D (+27.7) · D 63.0% · R 35.3% · Other 1.7%
- 2008→2024 swing
- -0.7pp no change · 2008: 28.4pp · 2024: 27.7pp
- All cycles
- 2024: D+27.7 2020: D+29.1 2016: D+22.8 2012: D+22.2 2008: D+28.4
Not yet ingested
- Civics
- —
Market trends
- HPI YoY
- ▼ -127.37%
- Current HPI
- 349.579
- Rent YoY
- ▲ 2.88%
- Metro
- Indianapolis-Carmel-Anderson, IN
- State GDP YoY
- ▲ 2.90%
- F500 in state
- 18
Industry mix (Fortune 500 HQ in IN)
| Industry | F500 HQs | Revenue |
|---|---|---|
| Industrial Machinery | 2 | $37B |
|
||
| Healthcare | 1 | $177B |
|
||
| Pharmaceuticals | 1 | $45B |
|
||
| Metals / Steel | 1 | $18B |
|
||
| Agriculture | 1 | $17B |
|
||
| Packaging | 1 | $12B |
|
||
Price history
-9.7% since first listed3 events — show timeline
- 2026-05-08 Price Changed $139,650 MIBOR as Distributed by MLS Grid
- 2026-04-22 Price Changed $144,650 MIBOR as Distributed by MLS Grid
- 2026-04-15 Listed $154,650 MIBOR as Distributed by MLS Grid
Property tax history
+64.2%/yrLatest (2025): $2,574 · -4.6% YoY. Source: county tax records.
Cash-flow waterfall
monthlySold comps — $/sqft
last 12 mo · ≤1 miLoading sold comps…