504 Hunt Ave · Columbia, MO
Flood risk 1/10 · Minimal
- FEMA flood zone
- X (unshaded)
- Chance of flooding over 30 yrs
- 0.0%
- Est. flood insurance / yr
- $473 – $860
Fire risk 1/10 · Minimal
- Est. fire insurance / yr
- $1,054 – $1,958
Heat risk 4/10 · Minor
- Hot days now (above 107°F)
- 7 days/yr
- Hot days in 30 yrs
- 18 days/yr
Wind risk 2/10 · Minimal
- Chance of severe wind over 30 yrs
- —
Air-quality risk 2/10 · Minimal
- Unhealthy air days now
- 1 days/yr
- Unhealthy air days in 30 yrs
- 1 days/yr
Risk factors via First Street. Map © Google.
Why this score? — see what drove the D- grade
The composite is a weighted blend of 9 inputs, each scored 0–100. Each bar is that input's sub-score; the figure is the points it added to the 100-point composite (weight × sub-score).
- Cash flow +12.8/30.0
- ARV discount +5.8/15.0
- Livability +4.2/5.0
- Rent growth +4.0/5.0
- DSCR +3.8/10.0
- Schools +3.1/10.0
- 1% rule +2.7/10.0
- Condition / age +2.5/5.0
- Appreciation +0.0/10.0
$150,000
🖨 Deal sheet (PDF) 📄 Offer letter ✓ Due diligence
Listing remarks MLS
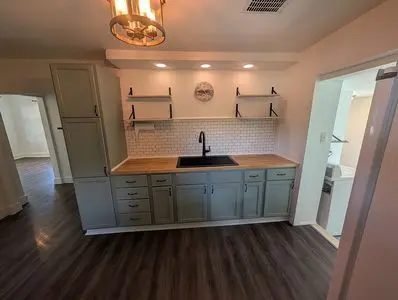
Cute 2 Bedroom Bungalow that has been updated right in the heart of Columbia, Missouri. This property would be great for an investor or 1st time home-buyer. Contact listing agent for more information and showings. SOLD ''AS-IS''
Key facts
- Fully renovated
- New furnace
- Privacy fence
Tags
Neighborhood map
What this means for you Summary
Snapshot
- This is a 2-bed/1.0-bath single-family listed at $150k.
Deal economics
- At list price, monthly cash flow is $-13 ($-152/yr) — negative.
- To cash-flow at today's rent, offer at most $148k (1.5% below list).
- To meet the 1% rule (rent ≥ 1% of price), the offer needs to be $115k (23.1% below list).
- Recommended offer: $115k (23.1% below list) — sets the bar for 1% rule.
- Cap rate 6.2% vs local median 2.9% in Columbia — top-decile yield for the area; either an underpriced asset or a hidden risk that comps aren't pricing in. Stress-test before assuming the spread holds.
Location & tenants
- Location reads 83/100 on livability (#9 in MO, #862 nationally) — a professional / high-income tenant draw. Strengths: amenities A+, commute A+, cost of living A+; Watch: crime D+.
- Columbia 93 (urban): math 30% / reading 43% proficiency, ranked #194 of 324 in MO (top 60%) — families likely to look elsewhere, expect single-tenant / working-renter base with shorter leases.
- Market conditions: Rents rising fast (+6.1%/yr); 459 active listings in the ZIP; 7 comparable units currently listed for rent nearby; rentals at typical pace (median 14d on market — plan ~3-4 weeks tenant-placement turnaround); solid renter incomes; 1,303 units permitted in Boone County in 2024 (549 in 5+ unit buildings).
- This rent is only 17% of the median local income ($80k/yr) — well below the 30% rent-burden line; pricing power to push rent on renewal without tenant pushback.
Forward outlook
- Local home prices are declining (-3.0%/yr); year-one equity from $1k of loan paydown is wiped out by about $4k of value loss. Plan a longer hold.
- Boone County population projected at +36% by 2050 — long-run rental-demand tailwind backs the buy-and-hold thesis.
Negotiation context
- It's been on market 16 days — a 2% lower offer ($148k) is reasonable based on typical stale-listing flexibility.
- 7 sale attempts since 27y ago with the ask held roughly flat each time — persistent listings suggest the price (not the market) is what's stuck; bring a comps-based counter.
Risks & watch-outs
- Watch-outs: built in 1947 — expect roof / HVAC / electrical / plumbing capex.
Questions for the listing agent
- What do current leases actually rent for vs. the listed asking? Can we see a recent rent roll and the last 12 months of T-12 income?
- Built in 1947 — when were the roof, HVAC, electrical panel, plumbing, and water heater last replaced?
- Is there a deadline driving the sale (1031 exchange, divorce, estate, relocation)? That informs how much negotiation room exists.
- Schools are B-rated — typically a magnet for longer-tenancy family renters. What's the average tenant stay here, and is there a school-zone premium baked into asking?
- Crime grade is D in this area — have there been break-ins, vandalism, or insurance claims at this property in the last 3 years? What carrier currently insures it and at what premium?
- The area grade is low — what's the realistic commute time and amenity access for the typical tenant pool here? Any planned neighborhood developments (good or bad) we should know about?
- What's the average days-on-market for RENTAL listings here right now (not sales)? A rising rental-DOM trend means longer vacancies and softer asking-rent achievability than the comps imply.
- What's the recent tenant-quality profile in this submarket — average credit score on applications, eviction rate, late-payment / NSF rate, and stable-employment percentage? A property-management company in the area should have these aggregated.
- How much new for-sale + rental construction is in the pipeline within 1–3 miles? Heavy new supply typically softens prices + rents 12–24 months out; constrained supply supports both.
Investment metrics
- 1% rule
- 0.77% ✗
- Cap rate
- 6.19%
- Cash-on-cash
- -0.36%
- DSCR
- 0.98
- GRM
- 10.8
CMA / ARV
- ARV (on-the-fly)
- $144,480
- Comps found
- 8
Show comp detail 8 sales within ~0.75 mi
| Address | Dist | Beds/Ba | Sqft | Sold | Price | $/sf | Match |
|---|---|---|---|---|---|---|---|
| 1304 W Worley St | 0.14mi | 2/1.0 | 728 (+8%) | 5mo | $160,000 | $220 | 76 |
| 801 Clinkscales Rd | 0.19mi | 2/1.0 | 720 (+7%) | 11mo | $176,000 | $244 | 70 |
| 407 Auburn Ln | 0.15mi | 2/1.0 | 754 (+12%) | 8mo | $137,000 | $182 | 66 |
| 605 Pennant St | 0.07mi | 2/1.0 | 768 (+14%) | 20mo | $65,900 | $86 | 56 |
| 607 Ridgeway Ave | 0.67mi | 2/1.0 | 728 (+8%) | 7mo | $175,000 | $240 | 49 |
| 604 W Worley St | 0.74mi | 2/1.0 | 676 (+1%) | 20mo | $110,000 | $163 | 48 |
| 719 Mikel St | 0.66mi | 2/1.0 | 764 (+14%) | 0mo | $155,000 | $203 | 46 |
| 207 Pinewood Dr | 0.32mi | 2/1.0 | 768 (+14%) | 22mo | $165,000 | $215 | 43 |
Match score weights: distance 35% · size 25% · config 20% · recency 20%. Top-matched comps best support the ARV.
Projected returns pro-forma
-3.0% appreciation · 6.09% rent growth · sell at horizon
- IRR
- -13.9%
- Equity multiple
- 0.49×
- Total profit
- $-21,471
- Equity at exit
- $22,365
- IRR
- -1.2%
- Equity multiple
- 0.91×
- Total profit
- $-3,787
- Equity at exit
- $12,969
Cash invested: $42,000 (down + closing). Projections, not guarantees.
Landlord ↔ Tenant lean methodology
- Overall (STATE)
- 81 Strongly Landlord-Friendly
- State Missouri
- 81 Strongly Landlord-Friendly · R+10
- County
- — inherits STATE
- City
- — inherits STATE
ZIP-level market 65203
- Rents YoY
- 6.1%
- Active inventory
- 459
- Price-to-rent
- 10.8×
Monthly cashflow live
- Estimated rent
- $1,153 high interval (Pro) →
- Mortgage (P&I)
- −$787
- Tax from tax record
- −$75 /mo · $896/yr
- Insurance
- −$62
- HOA
- −$0
- Vacancy / Maint / Mgmt
- −$242
- Net cashflow
- $-13
Break-even live
Sensitivity live
| Price | -10% $72 | -5% $30 | +0% $-13 | +5% $-55 | +10% $-98 |
|---|---|---|---|---|---|
| Rent | -10% $-104 | -5% $-58 | +0% $-13 | +5% $33 | +10% $78 |
| Rate | -1.0pp $63 | -0.5pp $25 | base $-13 | +0.5pp $-52 | +1.0pp $-91 |
UW: 25.0% down · 7.5% · 30yr · 1.5% tax · 5.0% vac · 8.0% maint · 8.0% mgmt
Financing live
Cash to close
- Down payment
- $37,500
- Closing costs
- $4,500
- Reserves months
- —
- Total cash needed
- —
Loan-product check · same deal, 3 products live
Conventional
25% down · 7.5% · 30yr
- Down + closing
- —
- Monthly P&I
- —
- Monthly cashflow
- —
- DSCR
- —
- Eligible?
- —
Personal DTI + credit; lowest rate.
DSCR
20% down · 8.5% · 30yr
- Down + closing
- —
- Monthly P&I
- —
- Monthly cashflow
- —
- DSCR
- —
- Eligible?
- —
No personal income docs; deal must DSCR.
Hard money
10% down · 12.0% · 12mo
- Down + closing
- —
- Monthly P&I
- —
- Monthly cashflow
- —
- DSCR
- —
- Eligible?
- —
Short-term bridge; refi at stabilization.
Rent comps 7 comps
| Address | Beds | Baths | Sqft | Rent | $/sqft | DOM | Units | Dist |
|---|---|---|---|---|---|---|---|---|
| 305 Tiger Ln Columbia, MO | 1.0–2.0 | 1.0 | 615 | $1,120 | $1.82 | 14d | 13 | 0.60mi |
| 2012 W Ash St Columbia, MO | 1.0–2.0 | 1.0 | 680 | $1,115 | $1.64 | 14d | 15 | 0.64mi |
| 607 Ridgeway Ave Columbia, MO | 2.0 | 1.0 | 728 | $1,300 | $1.79 | 44d | 1 | 0.66mi |
| 924 W Texas Ave Unit B Columbia, MO | 2.0 | 1.0 | 662 | $750 | $1.13 | 14d | 1 | 0.71mi |
| 111 N Stadium Blvd Columbia, MO | 1.0–2.0 | 1.0 | 628 | $875 | $1.39 | 14d | 11 | 0.82mi |
| 309 Alexander Ave Columbia, MO | 2.0 | 1.0 | 728 | $1,200 | $1.65 | 14d | 1 | 0.92mi |
| 1502 Parkade Blvd Unit 2 Columbia, MO | 2.0 | 1.0 | 700 | $950 | $1.36 | 44d | 1 | 1.03mi |
Listing history 13 events
-
2026-06-19days on market $150,000 Active 16 DOM
-
2026-06-18days on market $150,000 Active 15 DOM
-
2026-06-17days on market $150,000 Active 14 DOM
-
2026-06-16days on market $150,000 Active 13 DOM
-
2026-06-15days on market $150,000 Active 12 DOM
-
2026-06-14days on market $150,000 Active 10 DOM
-
2026-06-13days on market $150,000 Active 9 DOM
-
2026-06-10days on market $150,000 Active 7 DOM
-
2026-06-09days on market $150,000 Active 6 DOM
-
2026-06-08days on market $150,000 Active 5 DOM
-
2026-06-07days on market $150,000 Active 4 DOM
-
2026-06-05remarks 255-char remark
-
2026-06-05$150,000 Active 1 DOM
ⓘ Source: listings_history table (triggers on properties + properties_extension) + one-shot
backfill from property_details.listing_events for pre-trigger history.
Tax reassessment forecast MO · Resets to sale price
- Current annual tax
- $896 · $75/mo
- Projected year-2 tax
- $1,455 · $121/mo
- Expected delta
- +$559/yr (+$47/mo · 62.4%)
ⓘ Screening estimate from a state-policy table — verify with the county assessor before closing.
Climate risk First Street
- Flood 1/10 Low FEMA zone X (unshaded) · 0% chance over 30 yrs
- Wildfire 1/10 Low
- Heat 4/10 Moderate 7 d/yr ≥107°F today · 18 d/yr by 30 yrs out
- Wind 2/10 Low
- Air quality 2/10 Low 1 unhealthy d/yr today · 1 by 30 yrs out
Nearby sold comps map
Loading sold comps map…
Walkable amenities ~0.75 mi
Loading nearby amenities…
Taxation est. · year 1
- Rental income
- $13,839
- − Mortgage interest
- −$8,402
- − Property taxes
- −$896
- − Insurance
- −$750
- − Repairs & maintenance
- −$1,107
- − Management
- −$1,107
- − Depreciation
- −$4,364
- Taxable loss
- −$2,787
- Est. tax savings @ 24.0%
- +$669
- After-tax cash flow
- $516/yr
For passive investors: Depreciation is non-cash, so a rental often shows a tax loss while cash-flowing — sheltering income. Rental losses are passive: they offset passive income freely, and up to $25,000/yr can offset ordinary (W-2) income if you actively participate and your MAGI is under $100k (phasing out to $0 by $150k); unused losses carry forward. On sale, claimed depreciation is recaptured at up to 25%, and gains may owe capital-gains tax (a 1031 exchange can defer both). Figures are a year-1 estimate at your 24.0% rate — not tax advice; consult a CPA.
Schools (NCES district)
- District
- Columbia 93
- NCES district ID
- 2901000
- Math proficiency
- 30% ▼ -12.00%
- Reading proficiency
- 43% ▼ -4.00%
- Median HH income
- $46,547
- Composite
- 31.21/100
- National rank
- #6036
- State rank
- #194 of 324 in MO
Livability — Columbia
- Score
- 83/100
- State rank
- #9
- US rank
- #862
Category grades
Schools grade is shown separately in the Schools card above.
Census & demographics
- Census place
- Columbia, MO
- County
- Boone County · 158,877 people
- City population
- 158,877
- Metro
- Columbia, MO
- Population (ZIP)
- 61,539
- Household income
- $79,960
- Rent vs Own
- Severe rent burden
- 1991.0
Population outlook (Boone County) Hauer SSP2
- Today (2025)
- 202,891 people
- By 2030
- 217,799 · +7.3%
- By 2040
- 246,789 · +21.6%
- By 2050
- 276,116 · +36.1%
- By 2075
- 348,426 · +71.7%
- By 2100
- 400,856 · +97.6%
Race, ethnicity, and origin ACS 2023
- Neighborhood character
- Predominantly White (77%)
- Race & ethnicity
- White 77% Black 9% Asian 6% Two or more races 5% Hispanic / Latino 3%
- Common ancestry
- Italian 3% Slovak 2% Romanian 2%
- Foreign-born
- 7% · China, South Korea, Canada
- Languages at home
- 91% English-only · Chinese 2% Spanish 2% Korean 1%
Political lean MEDSL · Boone
- 2024 margin
- Lean D (+9.8) · D 53.9% · R 44.1% · Other 2.1%
- 2008→2024 swing
- -2.2pp toward R · 2008: 12.0pp · 2024: 9.8pp
- All cycles
- 2024: D+9.8 2020: D+12.5 2016: D+5.9 2012: D+3.1 2008: D+12.0
Not yet ingested
- Civics
- —
Market trends
- HPI YoY
- ▼ -274.18%
- Current HPI
- 194.3615
- Rent YoY
- ▲ 6.09%
- Metro
- Columbia, MO
- State GDP YoY
- ▲ 1.84%
- F500 in state
- 20
Industry mix (Fortune 500 HQ in MO)
| Industry | F500 HQs | Revenue |
|---|---|---|
| Healthcare | 1 | $163B |
|
||
| Insurance | 1 | $21B |
|
||
| Industrial Technology | 1 | $17B |
|
||
| Retail | 1 | $16B |
|
||
| Industrial Distribution | 1 | $10B |
|
||
| Utilities | 1 | $9B |
|
||
Price history
+36.5% since first listed15 events — show timeline
- 2026-06-04 Listed $150,000 FSBO.com
- 2022-03-14 Sold (Public Records) — Public Records
- 2022-03-14 Sold (MLS) — CBORMLS
- 2022-02-14 Listed $100,000 CBORMLS
- 2019-09-17 Sold (Public Records) — Public Records
- 2019-09-13 Sold (MLS) — CBORMLS
- 2009-07-02 Sold (Public Records) — Public Records
- 2009-01-09 Sold (MLS) — Heartland MLS as Distributed by MLS Grid
- 2008-06-13 Listed $34,400 Heartland MLS as Distributed by MLS Grid
- 2004-11-28 Listed $62,900 CBORMLS
- 2004-08-30 Listed $71,500 CBORMLS
- 1999-06-03 Sold (MLS) — CBORMLS
- 1999-05-28 Sold (MLS) — CBORMLS
- 1999-03-25 Listed $39,900 CBORMLS
- 1999-03-19 Listed $109,900 CBORMLS
Property tax history
+4.3%/yrLatest (2025): $896 · +11.1% YoY. Source: county tax records.
Cash-flow waterfall
monthlySold comps — $/sqft
last 12 mo · ≤1 miLoading sold comps…