6 Woodvale St · Noyack, NY
Flood risk 1/10 · Minimal
- FEMA flood zone
- X (unshaded)
- Chance of flooding over 30 yrs
- 0.0%
- Est. flood insurance / yr
- $473 – $860
Fire risk 2/10 · Minimal
- Est. fire insurance / yr
- $691 – $1,283
Heat risk 4/10 · Minor
- Hot days now (above 90°F)
- 7 days/yr
- Hot days in 30 yrs
- 19 days/yr
Wind risk 8/10 · Major
- Chance of severe wind over 30 yrs
- 80.0%
Air-quality risk 3/10 · Minor
- Unhealthy air days now
- 2 days/yr
- Unhealthy air days in 30 yrs
- 3 days/yr
Risk factors via First Street. Map © Google.
Why this score? — see what drove the B+ grade
The composite is a weighted blend of 9 inputs, each scored 0–100. Each bar is that input's sub-score; the figure is the points it added to the 100-point composite (weight × sub-score).
- Cash flow +30.0/30.0
- 1% rule +10.0/10.0
- DSCR +10.0/10.0
- Appreciation +9.6/10.0
- Schools +5.6/10.0
- Rent growth +5.0/5.0
- Livability +2.9/5.0
- Condition / age +2.5/5.0
- ARV discount +0.0/15.0
$1,575,000
🖨 Deal sheet 📄 Offer letter ✓ Due diligence
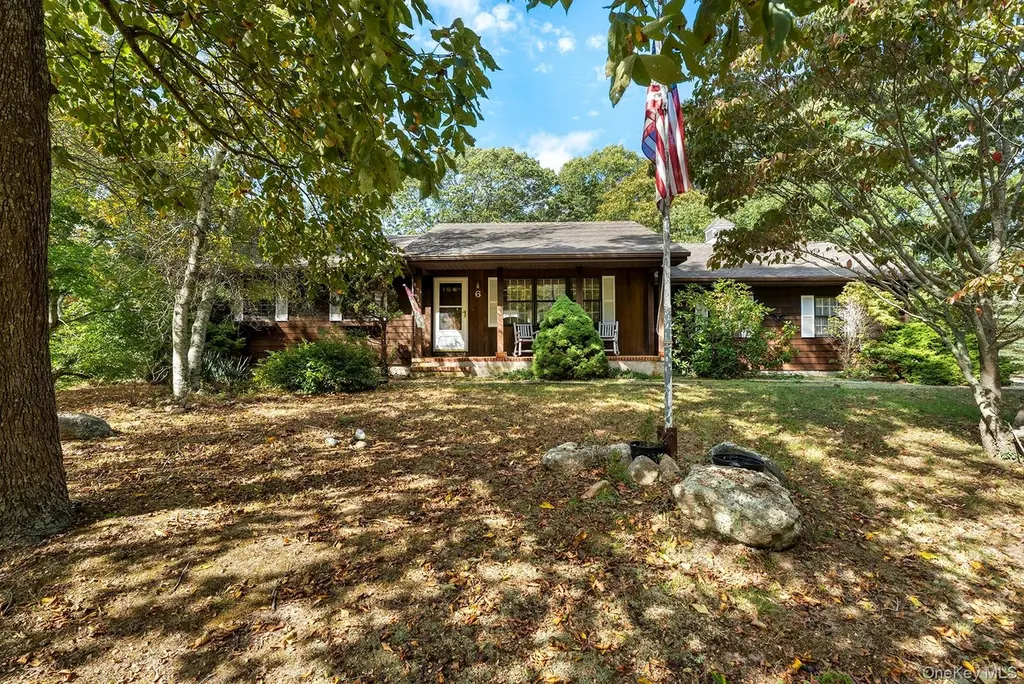
Listing remarks
The Ranch The one and only owners built this house for themselves; they just don't make them like they used to - welcome to the ranch. This 3-bedroom 2 bath house includes an attached two car garage, front porch, rear deck, and outdoor shower. The gentle rolling 1.1-acre property allows for expansion.
Key facts
- Front porch
- Outdoor shower
- Rear deck
Tags
Property features AI
Exterior
- Parking: Private parking; 2-car garage
- Utilities: Cesspool sewer; Electricity connected; Water connected
- Home design: Single family residence
- Construction: Unfinished attic; Basement with storage
- Exterior features: Not waterfront
Interior
- Kitchen: Electric oven; Refrigerator
- Bedrooms: Includes a first-floor bedroom
- Flooring: Carpet
- Bathrooms: 2 full bathrooms
- Heating & cooling: Baseboard heating; Wall/window air conditioning units
- Interior features: First-floor bedroom; First-floor full bathroom; Ceiling fans; Deck; Unfinished attic; Basement used for storage
- Laundry & utility: Laundry room; Washer; Dryer
Neighborhood map
What this means for you Summary
Snapshot
- This is a 3-bed/2.0-bath single-family listed at $1.57M.
Deal economics
- At list price, monthly cash flow is $8k ($94k/yr) — positive.
- The deal already cash-flows at list — no discount required.
- Meets the 1% rule at list price ($24k rent vs $1.57M).
- Cap rate 12.2% vs local median 7.1% in Noyack — top-decile yield for the area; either an underpriced asset or a hidden risk that comps aren't pricing in. Stress-test before assuming the spread holds.
Location & tenants
- Location reads 57/100 on livability (#1,084 in NY) — a working-class tenant base; expect higher turnover. Strengths: crime A+, employment A+; Watch: housing D+, amenities F, commute F.
- Sag Harbor Union Free School District (suburban): math 54% / reading 70% proficiency, ranked #175 of 590 in NY (top 30%) — acceptable for families but not a draw, mixed tenant base, ~2y average lease; only 8% free/reduced lunch — higher-income household profile.
- Zoned schools: Sag Harbor Elementary School (math 47% / reading 72%, grade B-, #745 of 2,108 statewide, top 39%, 426 students, 22% FRL); Pierson Middle/High School (math 61% / reading 72%, grade B, #763 of 1,100 statewide, top 69%, 525 students, 25% FRL) — zoned schools average 24% FRL vs 8% district-wide (16 pts higher); higher-poverty schools than district average — tighter screening recommended.
- Market conditions: Rents rising fast (+10.8%/yr); 65 active listings in the ZIP; 2 comparable units currently listed for rent nearby; high-income renter base; 1,366 units permitted in Suffolk County in 2024 (216 in 5+ unit buildings).
- At $23,667/mo this rent would consume 222% of the median local household income ($128k/yr) (locally 95% of renters already pay >50% of income on rent) — very limited rent-growth headroom before tenants either downsize or default.
Forward outlook
- In year one you build about $156k of equity ($11k loan paydown + $145k appreciation (9.2% local appreciation)).
- Suffolk County population projected to shrink 5% by 2050 — rents likely to lag national; underwrite the cash flow, not the appreciation.
- At projected returns (9.2% appreciation + 8.0% rent growth), your $441k cash investment doubles in ~2 years — after that, you're playing with house money.
- By year 2, paydown + projected appreciation supports a ~$250k cash-out refi (75% LTV) — recoverable capital for the next deal without selling this one.
Negotiation context
- Only 13 days on market — expect competitive offers; lowballing is unlikely to land.
Risks & watch-outs
- Climate carrying-cost: severe wind risk, 80% chance of damaging wind over 30y — expect insurance premiums to compound above CPI over the hold.
Questions for the listing agent
- Is there a deadline driving the sale (1031 exchange, divorce, estate, relocation)? That informs how much negotiation room exists.
- What's the average days-on-market for RENTAL listings here right now (not sales)? A rising rental-DOM trend means longer vacancies and softer asking-rent achievability than the comps imply.
- What's the recent tenant-quality profile in this submarket — average credit score on applications, eviction rate, late-payment / NSF rate, and stable-employment percentage? A property-management company in the area should have these aggregated.
- How much new for-sale + rental construction is in the pipeline within 1–3 miles? Heavy new supply typically softens prices + rents 12–24 months out; constrained supply supports both.
Investment metrics
- 1% rule
- 1.50% ✓
- Cap rate
- 12.25%
- Cash-on-cash
- 21.26%
- DSCR
- 1.95
- GRM
- 5.5
CMA / ARV
- ARV (on-the-fly)
- $1,171,368
- Comps found
- 2
Show comp detail 2 sales within ~0.75 mi
| Address | Dist | Beds/Ba | Sqft | Sold | Price | $/sf | Match |
|---|---|---|---|---|---|---|---|
| 4528 Noyac Rd | 0.54mi | 3/2.0 | 1,268 (+7%) | 2mo | $1,250,000 | $986 | 62 |
| 22 Pine Crest Ln | 0.62mi | 2/1.0 (-1) | 1,233 (+4%) | 13mo | $1,210,000 | $981 | 45 |
Match score weights: distance 35% · size 25% · config 20% · recency 20%. Top-matched comps best support the ARV.
Projected returns pro-forma
9.19% appreciation · 8.0% rent growth · sell at horizon
- IRR
- 41.7%
- Equity multiple
- 4.16×
- Total profit
- $1,393,906
- Equity at exit
- $1,326,433
- IRR
- 38.5%
- Equity multiple
- 10.08×
- Total profit
- $4,005,189
- Equity at exit
- $2,767,518
Cash invested: $441,000 (down + closing). Projections, not guarantees.
Landlord ↔ Tenant lean methodology
- Overall (STATE)
- 15 Strongly Tenant-Friendly
- State New York
- 15 Strongly Tenant-Friendly · D+10
- County
- — inherits STATE
- City
- — inherits STATE
ZIP-level market 11963
- Home prices YoY
- 1.9%
- Rents YoY
- 10.8%
- Active inventory
- 65
- Price-to-rent
- 5.5×
Monthly cashflow live
- Estimated rent
- $23,667 medium interval (Pro) →
- Mortgage (P&I)
- −$8,259
- Tax est. 1.5%
- −$1,969 /mo · $23,625/yr
- Insurance
- −$656
- HOA
- −$0
- Vacancy / Maint / Mgmt
- −$4,970
- Net cashflow
- $7,813
Break-even live
UW: 25.0% down · 7.5% · 30yr · 1.5% tax · 5.0% vac · 8.0% maint · 8.0% mgmt
Financing live
Cash to close
- Down payment
- $393,750
- Closing costs
- $47,250
- Reserves months
- —
- Total cash needed
- —
Loan-product check · same deal, 3 products live
Conventional
25% down · 7.5% · 30yr
- Down + closing
- —
- Monthly P&I
- —
- Monthly cashflow
- —
- DSCR
- —
- Eligible?
- —
Personal DTI + credit; lowest rate.
DSCR
20% down · 8.5% · 30yr
- Down + closing
- —
- Monthly P&I
- —
- Monthly cashflow
- —
- DSCR
- —
- Eligible?
- —
No personal income docs; deal must DSCR.
Hard money
10% down · 12.0% · 12mo
- Down + closing
- —
- Monthly P&I
- —
- Monthly cashflow
- —
- DSCR
- —
- Eligible?
- —
Short-term bridge; refi at stabilization.
Rent comps 2 comps
| Address | Beds | Baths | Sqft | Rent | $/sqft | DOM | Units | Dist |
|---|---|---|---|---|---|---|---|---|
| 364 Main St Unit B Sag Harbor, NY | 3.0 | 1.0 | 1200 | $35,000 | $29.17 | 22d | 1 | 0.94mi |
| 47 Cliff Dr Sag Harbor, NY | 3.0 | 2.0 | 1360 | $8,000 | $5.88 | 19d | 1 | 1.41mi |
Listing history 2 events
-
2026-04-29status Pending
-
2026-04-14$1,575,000 Active
ⓘ Source: listings_history table (triggers on properties + properties_extension) + one-shot
backfill from property_details.listing_events for pre-trigger history.
Climate risk First Street
- Flood 1/10 Low FEMA zone X (unshaded) · 0% chance over 30 yrs
- Wildfire 2/10 Low
- Heat 4/10 Moderate 7 d/yr ≥90°F today · 19 d/yr by 30 yrs out
- Wind 8/10 Severe 80% chance of damaging wind over 30 yrs
- Air quality 3/10 Moderate 2 unhealthy d/yr today · 3 by 30 yrs out
Nearby sold comps map
Loading sold comps map…
Walkable amenities ~0.75 mi
Loading nearby amenities…
Taxation est. · year 1
- Rental income
- $284,007
- − Mortgage interest
- −$88,224
- − Property taxes
- −$23,625
- − Insurance
- −$7,875
- − Repairs & maintenance
- −$22,721
- − Management
- −$22,721
- − Depreciation
- −$45,818
- Taxable income
- $73,023
- Est. tax owed @ 24.0%
- −$17,525
- After-tax cash flow
- $76,226/yr
For passive investors: Depreciation is non-cash, so a rental often shows a tax loss while cash-flowing — sheltering income. Rental losses are passive: they offset passive income freely, and up to $25,000/yr can offset ordinary (W-2) income if you actively participate and your MAGI is under $100k (phasing out to $0 by $150k); unused losses carry forward. On sale, claimed depreciation is recaptured at up to 25%, and gains may owe capital-gains tax (a 1031 exchange can defer both). Figures are a year-1 estimate at your 24.0% rate — not tax advice; consult a CPA.
Schools (NCES district)
- District
- Sag Harbor Union Free School District
- NCES district ID
- 3625380
- Math proficiency
- 54% ▼ -13.00%
- Reading proficiency
- 70% ▲ 7.00%
- Median HH income
- $81,547
- Composite
- 55.69/100
- National rank
- #1222
- State rank
- #175 of 590 in NY
Livability — Noyack
- Score
- 57/100
- State rank
- #1084
- US rank
- #21915
Category grades
Schools grade is shown separately in the Schools card above.
Census & demographics
- Census place
- Noyack, NY
- County
- Suffolk County · 679,920 people
- City population
- 8,114
- Metro
- New York-Newark-Jersey City, NY-NJ-PA
- Population (ZIP)
- 8,390
- Household income
- $127,746
- Rent vs Own
- Severe rent burden
- 95.0
Population outlook (Suffolk County) Hauer SSP2
- Today (2025)
- 1,505,262 people
- By 2030
- 1,498,318 · -0.5%
- By 2040
- 1,471,101 · -2.3%
- By 2050
- 1,424,848 · -5.3%
- By 2075
- 1,337,157 · -11.2%
- By 2100
- 1,217,720 · -19.1%
Race, ethnicity, and origin ACS 2023
- Neighborhood character
- Predominantly White (78%)
- Race & ethnicity
- White 78% Hispanic / Latino 13% Two or more races 11% Asian 4% Black 2%
- Hispanic origin (detail)
- Mexican 8%
- Common ancestry
- Scotch-Irish 4% Romanian 3% Italian 2%
- Foreign-born
- 13% · Canada, China, Jamaica
- Languages at home
- 81% English-only · Spanish 9% Other Indo-European 5% French/Haitian/Cajun 2%
Political lean MEDSL · Suffolk
- 2024 margin
- Lean R (+10.0) · D 45.0% · R 55.0%
- 2008→2024 swing
- -16.0pp toward R · 2008: 6.0pp · 2024: -10.0pp
- All cycles
- 2024: R+10.0 2020: R+0.0 2016: R+8.2 2012: D+2.9 2008: D+6.0
Not yet ingested
- Civics
- —
Market trends
- HPI YoY
- ▲ 9.19%
- Current HPI
- 499.3304
- Rent YoY
- ▲ 10.76%
- Metro
- New York-Newark-Jersey City, NY-NJ-PA
- State GDP YoY
- ▲ 2.60%
- F500 in state
- 92
Industry mix (Fortune 500 HQ in NY)
| Industry | F500 HQs | Revenue |
|---|---|---|
| Financial Services | 10 | $950B |
|
||
| Consumer Goods | 9 | $162B |
|
||
| Insurance | 4 | $225B |
|
||
| Telecommunications | 2 | $144B |
|
||
| Pharmaceuticals | 2 | $112B |
|
||
| Media / Entertainment | 2 | $69B |
|
||
Price history
2 events — show timeline
- 2026-04-29 Pending — OneKey® MLS as Distributed by MLS Grid
- 2026-04-14 Listed $1,575,000 OneKey® MLS as Distributed by MLS Grid
Property tax history
-4.0%/yrLatest (2022): $2,670 · +0.0% YoY. Source: county tax records.
Cash-flow waterfall
monthlySold comps — $/sqft
last 12 mo · ≤1 miLoading sold comps…