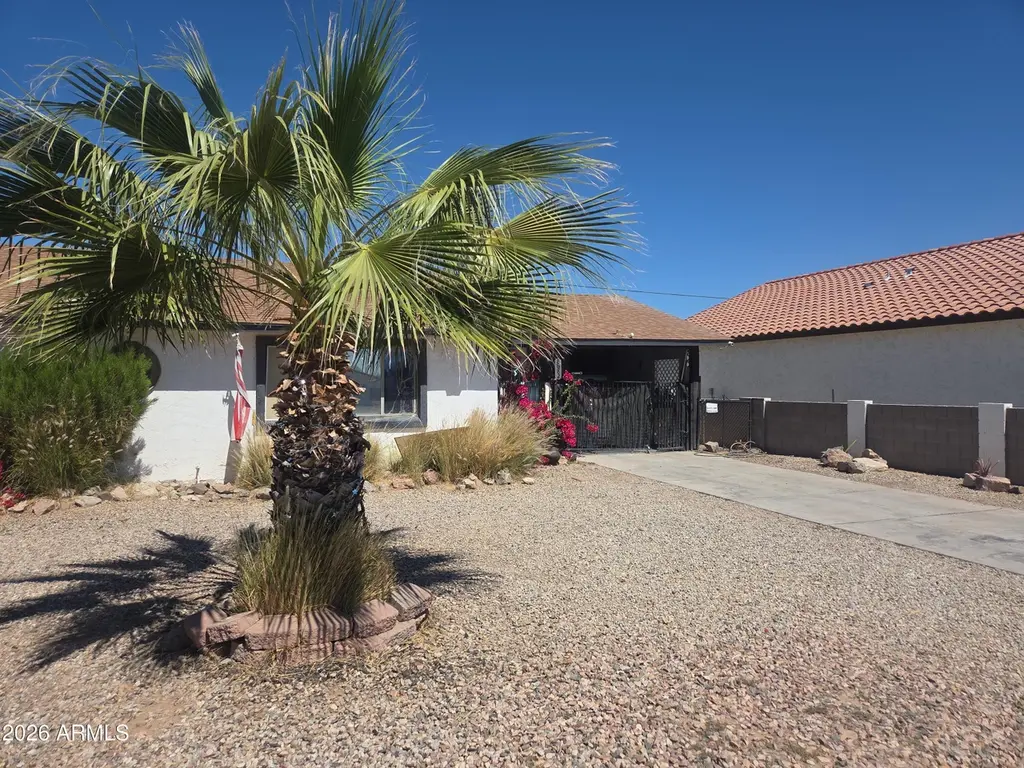
8682 W Santa Cruz Blvd · Arizona City, AZ
Flood risk 1/10 · Minimal
- FEMA flood zone
- X (unshaded)
- Chance of flooding over 30 yrs
- 0.0%
- Est. flood insurance / yr
- $507 – $1,088
Fire risk 5/10 · Moderate
- Est. fire insurance / yr
- $610 – $1,132
Heat risk 9/10 · Severe
- Hot days now (above 112°F)
- 6 days/yr
- Hot days in 30 yrs
- 17 days/yr
Wind risk 1/10 · Minimal
- Chance of severe wind over 30 yrs
- —
Air-quality risk 1/10 · Minimal
- Unhealthy air days now
- 0 days/yr
- Unhealthy air days in 30 yrs
- 0 days/yr
Risk factors via First Street. Map © Google.
Why this score? — see what drove the D+ grade
The composite is a weighted blend of 9 inputs, each scored 0–100. Each bar is that input's sub-score; the figure is the points it added to the 100-point composite (weight × sub-score).
- Cash flow +16.7/30.0
- ARV discount +15.0/15.0
- DSCR +5.2/10.0
- 1% rule +3.4/10.0
- Livability +2.8/5.0
- Rent growth +2.5/5.0
- Condition / age +2.5/5.0
- Schools +1.5/10.0
- Appreciation +0.3/10.0
$179,500
🖨 Deal sheet (PDF) 📄 Offer letter ✓ Due diligence
Listing remarks
Affordable opportunity with strong potential! No HOA Single-level home with gated carport and key updates including newer roof, A/C, and water heater. Tile flooring throughout and a spacious living area. Bonus room with private entry, patio access, and mini-split A/C offers flexibility as a third bedroom, office, or additional living space. Large backyard ready for your vision. Located just one block from the golf course--great opportunity to add value.
Key facts
- Gated carport
- Newer roof
- Large backyard
Tags
Property features AI
Finance
- HOA & community: No association fees
Exterior
- Parking: 1 covered parking space; 1 open parking space; 1 carport space
- Utilities: Private water company; Public sewer
- Home design: Single family residence; Fee simple ownership; Property listed as fixer
- Construction: Stucco and wood frame construction; Painted exterior; Composition roof with reflective coating
- Exterior features: Gravel/stone front yard; Gravel/stone backyard; Desert view; County-maintained road; Asphalt road surface
Interior
- Kitchen: Built-in microwave; Refrigerator; Garbage disposal; Kitchen island; Pantry
- Bedrooms: Up to 3 possible bedrooms
- Flooring: Tile
- Bathrooms: 2 full bathrooms
- Heating & cooling: Central air; Heating present
- Interior features: High-speed internet; Granite counters; Eat-in kitchen; Kitchen island; Pantry; Master bedroom with 3/4 bath
- Laundry & utility: Laundry inside
Neighborhood map
What this means for you Summary
Snapshot
- This is a 3-bed/2.0-bath single-family listed at $180k.
Deal economics
- At list price, monthly cash flow is $111 ($1k/yr) — positive.
- The deal already cash-flows at list — no discount required.
- To meet the 1% rule (rent ≥ 1% of price), the offer needs to be $151k (15.7% below list).
- Recommended offer: $151k (15.7% below list) — sets the bar for 1% rule.
- Cap rate 7.0% vs local median 4.2% in Arizona City — top-decile yield for the area; either an underpriced asset or a hidden risk that comps aren't pricing in. Stress-test before assuming the spread holds.
Location & tenants
- Location reads 56/100 on livability (#246 in AZ) — a working-class tenant base; expect higher turnover. Strengths: cost of living A+, housing A+; Watch: health & safety D, crime D-, amenities F.
- Casa Grande Union High School District (4453) (suburban): math 14% / reading 21% proficiency, ranked #193 of 249 in AZ (top 78%) — low school quality limits family demand, transient renter base, plan for 1-2y turnover.
- Zoned schools: Arizona City Elementary School (math 6% / reading 15%, grade F, #993 of 1,109 statewide, top 91%, 744 students, 87% FRL); Vista Grande High School (math 10% / reading 16%, grade F, #279 of 381 statewide, top 73%, 1,790 students, 54% FRL).
- Market conditions: 311 active listings in the ZIP; 20 comparable units currently listed for rent nearby; rentals leasing fast (median 5d on market — plan ~1-2 weeks tenant-placement turnaround); 9,504 units permitted in Pinal County in 2024 (776 in 5+ unit buildings).
Forward outlook
- Local home prices are declining (-3.0%/yr); year-one equity from $1k of loan paydown is wiped out by about $5k of value loss. Plan a longer hold.
Negotiation context
- It's been on market 92 days — a 9% lower offer ($163k) is reasonable based on typical stale-listing flexibility.
- 5 sale attempts since 3y ago with the ask held roughly flat each time — persistent listings suggest the price (not the market) is what's stuck; bring a comps-based counter.
- Current owner paid $30k; list at $180k implies a 496% gain — meaningful room to come down on a strong offer.
Risks & watch-outs
- Climate carrying-cost: moderate wildfire risk; extreme-heat days projected 6→17/yr by 2055 (HVAC capex compounding) — expect insurance premiums to compound above CPI over the hold.
Questions for the listing agent
- It's been on market 92 days. Have you received any prior offers? Is the seller open to a 16% concession, seller financing, or rate buy-down credit?
- Built in 1963 — when were the roof, HVAC, electrical panel, plumbing, and water heater last replaced?
- Why hasn't it sold? Are there any deal-killer items the seller is aware of (foundation, flood, title, zoning, code violations)?
- Is there a deadline driving the sale (1031 exchange, divorce, estate, relocation)? That informs how much negotiation room exists.
- Schools are F-rated, which usually means shorter tenancies and higher turnover. Who's the typical renter profile here, and what's been the actual vacancy rate?
- Crime grade is D in this area — have there been break-ins, vandalism, or insurance claims at this property in the last 3 years? What carrier currently insures it and at what premium?
- The area grade is low — what's the realistic commute time and amenity access for the typical tenant pool here? Any planned neighborhood developments (good or bad) we should know about?
- What's the average days-on-market for RENTAL listings here right now (not sales)? A rising rental-DOM trend means longer vacancies and softer asking-rent achievability than the comps imply.
- What's the recent tenant-quality profile in this submarket — average credit score on applications, eviction rate, late-payment / NSF rate, and stable-employment percentage? A property-management company in the area should have these aggregated.
- How much new for-sale + rental construction is in the pipeline within 1–3 miles? Heavy new supply typically softens prices + rents 12–24 months out; constrained supply supports both.
Investment metrics
- 1% rule
- 0.84% ✗
- Cap rate
- 7.03%
- Cash-on-cash
- 2.65%
- DSCR
- 1.12
- GRM
- 9.9
CMA / ARV
- ARV (on-the-fly)
- $277,146
- Comps found
- 12
Show comp detail 12 sales within ~0.75 mi
| Address | Dist | Beds/Ba | Sqft | Sold | Price | $/sf | Match |
|---|---|---|---|---|---|---|---|
| 14203 S Gleneagle Ln | 0.31mi | 3/2.0 | 1,656 (+6%) | 1mo | $249,990 | $151 | 74 |
| 8145 W Pineveta Dr | 0.34mi | 3/2.0 | 1,648 (+6%) | 2mo | $302,000 | $183 | 73 |
| 9051 W Magnum Dr | 0.49mi | 3/2.0 | 1,504 (-3%) | 1mo | $250,000 | $166 | 71 |
| 9474 W Tinajas Dr | 0.55mi | 3/2.0 | 1,489 (-4%) | 0mo | $280,000 | $188 | 67 |
| 8442 W Raven Dr | 0.32mi | 3/2.0 | 1,708 (+10%) | 3mo | $314,000 | $184 | 67 |
| 9564 W Santa Cruz Blvd | 0.55mi | 3/2.0 | 1,485 (-5%) | 2mo | $140,000 | $94 | 65 |
| 14543 S Rory Calhoun Dr | 0.54mi | 3/2.0 | 1,656 (+6%) | 2mo | $258,990 | $156 | 63 |
| 14234 S Country Club Way | 0.38mi | 3/2.5 | 1,713 (+10%) | 3mo | $305,000 | $178 | 61 |
| 9520 W Valview Pl | 0.55mi | 3/2.0 | 1,425 (-8%) | 2mo | $308,000 | $216 | 59 |
| 9438 W Troy Dr | 0.66mi | 3/2.0 | 1,467 (-6%) | 3mo | $250,000 | $170 | 57 |
| 14910 S Country Club Dr | 0.72mi | 4/2.0 (+1) | 1,600 (+3%) | 2mo | $353,000 | $221 | 55 |
| 14350 S Cienega Ln | 0.48mi | 4/2.0 (+1) | 1,775 (+14%) | 3mo | $240,000 | $135 | 47 |
Match score weights: distance 35% · size 25% · config 20% · recency 20%. Top-matched comps best support the ARV.
Projected returns pro-forma
-3.0% appreciation · 3.0% rent growth · sell at horizon
- IRR
- -12.2%
- Equity multiple
- 0.56×
- Total profit
- $-22,099
- Equity at exit
- $26,764
- IRR
- -3.1%
- Equity multiple
- 0.79×
- Total profit
- $-10,447
- Equity at exit
- $15,520
Cash invested: $50,260 (down + closing). Projections, not guarantees.
Landlord ↔ Tenant lean methodology
- Overall (STATE)
- 87 Strongly Landlord-Friendly
- State Arizona
- 87 Strongly Landlord-Friendly · R+3
- County
- — inherits STATE
- City
- — inherits STATE
ZIP-level market 85123
- Home prices YoY
- -3.2%
- Active inventory
- 311
- Price-to-rent
- 9.9×
Monthly cashflow live
- Estimated rent
- $1,513 high interval (Pro) →
- Mortgage (P&I)
- −$941
- Tax from tax record
- −$69 /mo · $823/yr
- Insurance
- −$75
- HOA
- −$0
- Vacancy / Maint / Mgmt
- −$318
- Net cashflow
- $111
Break-even live
Sensitivity live
| Price | -10% $212 | -5% $162 | +0% $111 | +5% $60 | +10% $9 |
|---|---|---|---|---|---|
| Rent | -10% $-9 | -5% $51 | +0% $111 | +5% $171 | +10% $230 |
| Rate | -1.0pp $201 | -0.5pp $157 | base $111 | +0.5pp $64 | +1.0pp $17 |
UW: 25.0% down · 7.5% · 30yr · 1.5% tax · 5.0% vac · 8.0% maint · 8.0% mgmt
Financing live
Cash to close
- Down payment
- $44,875
- Closing costs
- $5,385
- Reserves months
- —
- Total cash needed
- —
Loan-product check · same deal, 3 products live
Conventional
25% down · 7.5% · 30yr
- Down + closing
- —
- Monthly P&I
- —
- Monthly cashflow
- —
- DSCR
- —
- Eligible?
- —
Personal DTI + credit; lowest rate.
DSCR
20% down · 8.5% · 30yr
- Down + closing
- —
- Monthly P&I
- —
- Monthly cashflow
- —
- DSCR
- —
- Eligible?
- —
No personal income docs; deal must DSCR.
Hard money
10% down · 12.0% · 12mo
- Down + closing
- —
- Monthly P&I
- —
- Monthly cashflow
- —
- DSCR
- —
- Eligible?
- —
Short-term bridge; refi at stabilization.
Rent comps 20 comps
| Address | Beds | Baths | Sqft | Rent | $/sqft | DOM | Units | Dist |
|---|---|---|---|---|---|---|---|---|
| 8536 W Tinajas Dr Arizona City, AZ | 4.0 | 2.0 | 1224 | $1,475 | $1.21 | 26d | 1 | 0.21mi |
| 8339 W Santa Cruz Blvd Arizona City, AZ | 3.0 | 2.5 | 1178 | $1,225 | $1.04 | 26d | 1 | 0.27mi |
| 9254 W Pineveta Dr Arizona City, AZ | 2.0 | 2.0 | 1200 | $1,325 | $1.10 | 4d | 1 | 0.39mi |
| 9105 W Raven Dr Arizona City, AZ | 3.0 | 2.0 | 1239 | $1,500 | $1.21 | 12d | 1 | 0.40mi |
| 9033 W Oneida Dr Arizona City, AZ | 3.0 | 2.0 | 1215 | $1,500 | $1.23 | 26d | 1 | 0.40mi |
| 9301 W Century Dr Unit A (273) Arizona City, AZ | 3.0 | 2.0 | 1500 | $1,450 | $0.97 | 7d | 1 | 0.40mi |
| 13971 S Rosemont Rd Unit 2 (479) Arizona City, AZ | 3.0 | 2.5 | 1260 | $1,350 | $1.07 | 7d | 1 | 0.47mi |
| 10153 W Wenden Dr Arizona City, AZ | 3.0 | 2.0 | 2069 | $1,675 | $0.81 | 0d | 1 | 0.91mi |
| 8550 W Monaco Blvd Unit A (556) Arizona City, AZ | 3.0 | 2.0 | 1137 | $1,350 | $1.19 | 22d | 1 | 1.03mi |
| 10307 W Midnight Dr Arizona City, AZ | 3.0 | 2.0 | 1526 | $1,550 | $1.02 | 4d | 1 | 1.05mi |
| 15310 S Kline Pl Arizona City, AZ | 3.0 | 2.5 | 1826 | $2,150 | $1.18 | 0d | 1 | 1.05mi |
| 15147 S Yava Rd Unit A Arizona City, AZ | 3.0 | 2.5 | 1422 | $1,450 | $1.02 | 22d | 1 | 1.09mi |
| 14282 S Vera Cruz Rd Arizona City, AZ | 3.0 | 2.0 | 1202 | $1,500 | $1.25 | 18d | 1 | 1.10mi |
| 9088 W Rafael Dr Arizona City, AZ | 3.0 | 2.0 | 1336 | $1,550 | $1.16 | 0d | 1 | 1.22mi |
| 15610 S Moon Valley Rd Arizona City, AZ | 3.0 | 2.0 | 1656 | $1,600 | $0.97 | 0d | 1 | 1.28mi |
| 8764 W Reventon Dr Arizona City, AZ | 4.0 | 2.0 | 1603 | $1,350 | $0.84 | 0d | 1 | 1.28mi |
| 14735 S Amado Blvd Arizona City, AZ | 3.0 | 1.5 | 1155 | $1,650 | $1.43 | 0d | 1 | 1.33mi |
| 10800 W Carousel Dr Unit A Arizona City, AZ | 3.0 | 2.0 | 1300 | $1,250 | $0.96 | 0d | 1 | 1.35mi |
| 9321 W Hillcrest Pl Arizona City, AZ | 4.0 | 2.0 | 1420 | $1,750 | $1.23 | 0d | 1 | 1.39mi |
| 16001 S Bentley Dr Arizona City, AZ | 4.0 | 2.0 | 1209 | $1,475 | $1.22 | 0d | 1 | 1.46mi |
Listing history 34 events
-
2026-06-21days on market $179,500 Active 92 DOM
-
2026-06-18days on market $179,500 Active 89 DOM
-
2026-06-17days on market $179,500 Active 88 DOM
-
2026-06-16days on market $179,500 Active 87 DOM
-
2026-06-15days on market $179,500 Active 86 DOM
-
2026-06-13days on market $179,500 Active 84 DOM
-
2026-06-13days on market $179,500 Active 83 DOM
-
2026-06-09days on market $179,500 Active 80 DOM
-
2026-06-08days on market $179,500 Active 79 DOM
-
2026-06-07days on market $179,500 Active 78 DOM
-
2026-06-04days on market $179,500 Active 75 DOM
-
2026-06-03days on market $179,500 Active 74 DOM
-
2026-06-02days on market $179,500 Active 73 DOM
-
2026-06-01days on market $179,500 Active 72 DOM
-
2026-05-31days on market $179,500 Active 71 DOM
-
2026-03-20$179,500 Active
-
2025-06-07historical
-
2025-06-06status Active
-
2025-05-29historical Under Contract Accepting Backups
-
2025-05-09price $205,000
-
2025-05-09price $190,000
-
2025-03-31price $215,000
-
2025-02-12$230,000 Active
-
2023-09-25status Active
-
2023-09-22status Pending
-
2023-09-22historical
-
2023-09-04price $245,000
-
2023-07-31price $250,000
-
2023-07-10price $260,000
-
2023-06-09$272,000 Active
-
2018-03-23soldstatus $30,100
-
2014-06-11soldstatus $58,000
-
2008-04-29soldstatus $75,000
-
1996-09-13soldstatus $32,000
ⓘ Source: listings_history table (triggers on properties + properties_extension) + one-shot
backfill from property_details.listing_events for pre-trigger history.
Tax reassessment forecast AZ · Resets to sale price
- Current annual tax
- $823 · $69/mo
- Projected year-2 tax
- $1,185 · $99/mo
- Expected delta
- +$362/yr (+$30/mo · 44.0%)
ⓘ Screening estimate from a state-policy table — verify with the county assessor before closing.
Climate risk First Street
- Flood 1/10 Low FEMA zone X (unshaded) · 0% chance over 30 yrs
- Wildfire 5/10 Major
- Heat 9/10 Extreme 6 d/yr ≥112°F today · 17 d/yr by 30 yrs out
- Wind 1/10 Low
- Air quality 1/10 Low 0 unhealthy d/yr today · 0 by 30 yrs out
Nearby sold comps map
Loading sold comps map…
Walkable amenities ~0.75 mi
Loading nearby amenities…
Taxation est. · year 1
- Rental income
- $18,160
- − Mortgage interest
- −$10,055
- − Property taxes
- −$823
- − Insurance
- −$898
- − Repairs & maintenance
- −$1,453
- − Management
- −$1,453
- − Depreciation
- −$5,222
- Taxable loss
- −$1,742
- Est. tax savings @ 24.0%
- +$418
- After-tax cash flow
- $1,749/yr
For passive investors: Depreciation is non-cash, so a rental often shows a tax loss while cash-flowing — sheltering income. Rental losses are passive: they offset passive income freely, and up to $25,000/yr can offset ordinary (W-2) income if you actively participate and your MAGI is under $100k (phasing out to $0 by $150k); unused losses carry forward. On sale, claimed depreciation is recaptured at up to 25%, and gains may owe capital-gains tax (a 1031 exchange can defer both). Figures are a year-1 estimate at your 24.0% rate — not tax advice; consult a CPA.
Schools (NCES district)
- District
- Casa Grande Union High School District (4453)
- NCES district ID
- 0401740
- Math proficiency
- 14% ▼ -15.00%
- Reading proficiency
- 21% ▼ -10.00%
- Median HH income
- $45,373
- Composite
- 15.38/100
- National rank
- #9319
- State rank
- #193 of 249 in AZ
Livability — Arizona City
- Score
- 56/100
- State rank
- #246
- US rank
- #22768
Category grades
Schools grade is shown separately in the Schools card above.
Census & demographics
- Census place
- Arizona City, AZ
- County
- Pinal County · 399,947 people
- City population
- 10,003
- Metro
- Phoenix-Mesa-Chandler, AZ
- Population (ZIP)
- 10,003
- Household income
- $69,137
- Rent vs Own
- Severe rent burden
- 172.0
Population outlook (Pinal County) Hauer SSP2
- Today (2025)
- 437,574 people
- By 2030
- 446,903 · +2.1%
- By 2040
- 452,589 · +3.4%
- By 2050
- 444,126 · +1.5%
- By 2075
- 430,300 · -1.7%
- By 2100
- 393,536 · -10.1%
Race, ethnicity, and origin ACS 2023
- Neighborhood character
- Majority White (60%)
- Race & ethnicity
- White 60% Hispanic / Latino 32% Two or more races 11% Black 3%
- Hispanic origin (detail)
- Mexican 23% Puerto Rican 6%
- Common ancestry
- Lithuanian 3% Italian 2% Scottish 2%
- Foreign-born
- 8% · Canada, Jamaica
- Languages at home
- 81% English-only · Spanish 19%
Political lean MEDSL · Pinal
- 2024 margin
- Strong R (+22.1) · D 38.5% · R 60.6%
- 2008→2024 swing
- -7.6pp toward R · 2008: -14.5pp · 2024: -22.1pp
- All cycles
- 2024: R+22.1 2020: R+17.3 2016: R+19.3 2012: R+17.1 2008: R+14.5
Not yet ingested
- Civics
- —
Market trends
- HPI YoY
- ▼ -9.30%
- Current HPI
- 283.5405
- Rent YoY
- —
- Metro
- Phoenix-Mesa-Chandler, AZ
- State GDP YoY
- ▲ 4.54%
- F500 in state
- 20
Industry mix (Fortune 500 HQ in AZ)
| Industry | F500 HQs | Revenue |
|---|---|---|
| Technology | 2 | $13B |
|
||
| Mining / Metals | 1 | $23B |
|
||
| Environmental Services | 1 | $16B |
|
||
| Metals / Steel | 1 | $14B |
|
||
| Technology Distribution | 1 | $9B |
|
||
| Homebuilding | 1 | $8B |
|
||
Price history
+460.9% since first listed19 events — show timeline
- 2026-03-20 Listed $179,500 ARMLS
- 2025-06-07 Listing Removed — ARMLS
- 2025-06-06 Relisted — ARMLS
- 2025-05-29 Contingent — ARMLS
- 2025-05-09 Price Changed $205,000 ARMLS
- 2025-05-09 Price Changed $190,000 ARMLS
- 2025-03-31 Price Changed $215,000 ARMLS
- 2025-02-12 Listed $230,000 ARMLS
- 2023-09-25 Relisted — ARMLS
- 2023-09-22 Pending — ARMLS
- 2023-09-22 Listing Removed — ARMLS
- 2023-09-04 Price Changed $245,000 ARMLS
- 2023-07-31 Price Changed $250,000 ARMLS
- 2023-07-10 Price Changed $260,000 ARMLS
- 2023-06-09 Listed $272,000 ARMLS
- 2018-03-23 Sold (Public Records) $30,100 Public Records
- 2014-06-11 Sold (Public Records) $58,000 Public Records
- 2008-04-29 Sold (Public Records) $75,000 Public Records
- 1996-09-13 Sold (Public Records) $32,000 Public Records
Property tax history
+0.8%/yrLatest (2025): $823 · +4.4% YoY. Source: county tax records.
Cash-flow waterfall
monthlySold comps — $/sqft
last 12 mo · ≤1 miLoading sold comps…