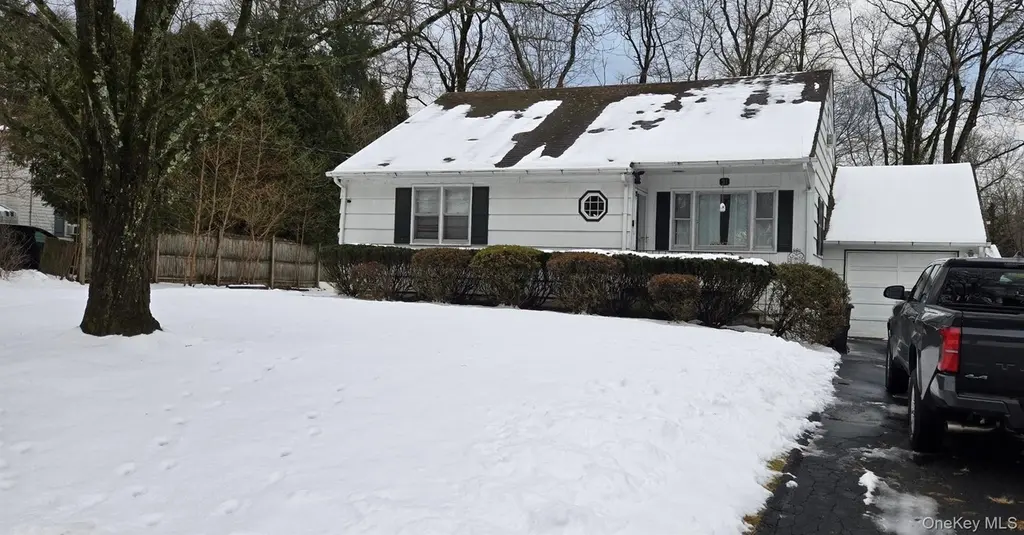
31 Parker Ave · New City, NY
Flood risk 1/10 · Minimal
- FEMA flood zone
- X (unshaded)
- Chance of flooding over 30 yrs
- 0.0%
- Est. flood insurance / yr
- $473 – $860
Fire risk 1/10 · Minimal
- Est. fire insurance / yr
- $691 – $1,283
Heat risk 5/10 · Moderate
- Hot days now (above 98°F)
- 7 days/yr
- Hot days in 30 yrs
- 14 days/yr
Wind risk 5/10 · Moderate
- Chance of severe wind over 30 yrs
- 26.0%
Air-quality risk 4/10 · Minor
- Unhealthy air days now
- 3 days/yr
- Unhealthy air days in 30 yrs
- 6 days/yr
Risk factors via First Street. Map © Google.
Why this score? — see what drove the C grade
The composite is a weighted blend of 9 inputs, each scored 0–100. Each bar is that input's sub-score; the figure is the points it added to the 100-point composite (weight × sub-score).
- Cash flow +15.7/30.0
- ARV discount +15.0/15.0
- Schools +6.9/10.0
- 1% rule +5.2/10.0
- DSCR +4.9/10.0
- Livability +4.0/5.0
- Rent growth +2.5/5.0
- Condition / age +2.5/5.0
- Appreciation +0.0/10.0
$588,000
🖨 Deal sheet 📄 Offer letter ✓ Due diligence
Listing remarks MLS
Well-maintained 4-bedroom, 2-bath Cape offering great potential with a full basement - A must see
Key facts
- 0.34 acre lot
- Built 1957
- Listed 154 days
Neighborhood map
What this means for you Summary
Snapshot
- This is a 4-bed/2.0-bath single-family listed at $588k.
Deal economics
- At list price, monthly cash flow is $263 ($3k/yr) — positive.
- The deal already cash-flows at list — no discount required.
- Meets the 1% rule at list price ($6k rent vs $588k).
- Recommended offer: $517k (12.0% below list) — sets the bar for market timing.
- Cap rate 6.8% vs local median 2.8% in New City — top-decile yield for the area; either an underpriced asset or a hidden risk that comps aren't pricing in. Stress-test before assuming the spread holds.
Location & tenants
- Location reads 80/100 on livability (#111 in NY, #1,835 nationally) — a professional / high-income tenant draw. Strengths: schools A+, commute A+, employment A+; Watch: amenities F, cost of living F.
- Clarkstown Central School District (suburban): math 72% / reading 75% proficiency, ranked #66 of 590 in NY (top 11%) — strong family-tenant draw, lease renewals of 3-5y typical; only 8% free/reduced lunch — higher-income household profile.
- Market conditions: 182 active listings in the ZIP; 1 comparable units currently listed for rent nearby; 429 units permitted in Rockland County in 2024 (231 in 5+ unit buildings).
Forward outlook
- Local home prices are declining (-3.0%/yr); year-one equity from $4k of loan paydown is wiped out by about $18k of value loss. Plan a longer hold.
- Rockland County population projected at +7% by 2050 — modest demand growth; plan on rents tracking national, not racing it.
Negotiation context
- It's been on market 154 days — a 12% lower offer ($517k) is reasonable based on typical stale-listing flexibility.
- 2 sale attempts since 20y ago with the ask held roughly flat each time — persistent listings suggest the price (not the market) is what's stuck; bring a comps-based counter.
- Current owner paid $504k; 17% above their basis — modest negotiation headroom, anchor on the comps not their cost.
Risks & watch-outs
- Watch-outs: built in 1957 — expect roof / HVAC / electrical / plumbing capex.
- Climate carrying-cost: moderate wind risk, 26% chance of damaging wind over 30y; extreme-heat days projected 7→14/yr by 2055 (HVAC capex compounding) — expect insurance premiums to compound above CPI over the hold.
Questions for the listing agent
- It's been on market 154 days. Have you received any prior offers? Is the seller open to a 12% concession, seller financing, or rate buy-down credit?
- Built in 1957 — when were the roof, HVAC, electrical panel, plumbing, and water heater last replaced?
- Why hasn't it sold? Are there any deal-killer items the seller is aware of (foundation, flood, title, zoning, code violations)?
- Is there a deadline driving the sale (1031 exchange, divorce, estate, relocation)? That informs how much negotiation room exists.
- Schools are A-rated — typically a magnet for longer-tenancy family renters. What's the average tenant stay here, and is there a school-zone premium baked into asking?
- What's the average days-on-market for RENTAL listings here right now (not sales)? A rising rental-DOM trend means longer vacancies and softer asking-rent achievability than the comps imply.
- What's the recent tenant-quality profile in this submarket — average credit score on applications, eviction rate, late-payment / NSF rate, and stable-employment percentage? A property-management company in the area should have these aggregated.
- How much new for-sale + rental construction is in the pipeline within 1–3 miles? Heavy new supply typically softens prices + rents 12–24 months out; constrained supply supports both.
Investment metrics
- 1% rule
- 1.02% ✓
- Cap rate
- 6.83%
- Cash-on-cash
- 1.92%
- DSCR
- 1.09
- GRM
- 8.2
CMA / ARV
- ARV (median comp)
- $842,636
- List price
- $588,000
- Delta
- -30.22%
- Verdict
- UNDERPRICED
- Comps
- 20 within 1.0 mi
Show comp detail 12 sales within ~0.75 mi
| Address | Dist | Beds/Ba | Sqft | Sold | Price | $/sf | Match |
|---|---|---|---|---|---|---|---|
| 122 Birch Ln | 0.24mi | 4/2.5 | 2,067 (+0%) | 5mo | $865,000 | $418 | 82 |
| 20 Grand St | 0.24mi | 4/2.0 | 1,873 (-9%) | 7mo | $672,000 | $359 | 68 |
| 5 Park Ter | 0.57mi | 4/2.5 | 2,002 (-3%) | 4mo | $600,000 | $300 | 63 |
| 5 Parker Ave | 0.11mi | 3/3.0 (-1) | 1,793 (-13%) | 4mo | $780,000 | $435 | 61 |
| 20 Badger St | 0.55mi | 4/2.0 | 2,256 (+10%) | 1mo | $500,000 | $222 | 58 |
| 46 Red Hill Rd | 0.37mi | 4/2.0 | 1,770 (-14%) | 5mo | $717,500 | $405 | 55 |
| 13 Lindbergh Ln | 0.38mi | 4/2.0 | 1,787 (-13%) | 8mo | $600,000 | $336 | 54 |
| 5 Raven Ter | 0.54mi | 3/2.0 (-1) | 1,883 (-9%) | 2mo | $700,000 | $372 | 54 |
| 127 Bellows Ln | 0.42mi | 4/2.5 | 2,300 (+12%) | 7mo | $885,000 | $385 | 53 |
| 63 Lindbergh Ln | 0.36mi | 3/3.0 (-1) | 1,780 (-14%) | 6mo | $707,000 | $397 | 46 |
| 183 New Hempstead Rd | 0.68mi | 4/3.5 | 2,308 (+12%) | 3mo | $745,000 | $323 | 40 |
| 101 New Valley Rd | 0.56mi | 3/1.5 (-1) | 1,774 (-14%) | 5mo | $600,000 | $338 | 40 |
Match score weights: distance 35% · size 25% · config 20% · recency 20%. Top-matched comps best support the ARV.
Projected returns pro-forma
-3.0% appreciation · 3.0% rent growth · sell at horizon
- IRR
- -13.2%
- Equity multiple
- 0.53×
- Total profit
- $-78,160
- Equity at exit
- $87,673
- IRR
- -4.1%
- Equity multiple
- 0.73×
- Total profit
- $-45,059
- Equity at exit
- $50,839
Cash invested: $164,640 (down + closing). Projections, not guarantees.
Landlord ↔ Tenant lean methodology
- Overall (STATE)
- 15 Strongly Tenant-Friendly
- State New York
- 15 Strongly Tenant-Friendly · D+10
- County
- — inherits STATE
- City
- — inherits STATE
ZIP-level market 10956
- Active inventory
- 182
- Price-to-rent
- 8.2×
Monthly cashflow live
- Estimated rent
- $6,000 medium interval (Pro) →
- Mortgage (P&I)
- −$3,084
- Tax from tax record
- −$1,148 /mo · $13,777/yr
- Insurance
- −$245
- HOA
- −$0
- Vacancy / Maint / Mgmt
- −$1,260
- Net cashflow
- $263
Break-even live
UW: 25.0% down · 7.5% · 30yr · 1.5% tax · 5.0% vac · 8.0% maint · 8.0% mgmt
Financing live
Cash to close
- Down payment
- $147,000
- Closing costs
- $17,640
- Reserves months
- —
- Total cash needed
- —
Loan-product check · same deal, 3 products live
Conventional
25% down · 7.5% · 30yr
- Down + closing
- —
- Monthly P&I
- —
- Monthly cashflow
- —
- DSCR
- —
- Eligible?
- —
Personal DTI + credit; lowest rate.
DSCR
20% down · 8.5% · 30yr
- Down + closing
- —
- Monthly P&I
- —
- Monthly cashflow
- —
- DSCR
- —
- Eligible?
- —
No personal income docs; deal must DSCR.
Hard money
10% down · 12.0% · 12mo
- Down + closing
- —
- Monthly P&I
- —
- Monthly cashflow
- —
- DSCR
- —
- Eligible?
- —
Short-term bridge; refi at stabilization.
Rent comps 1 comps
| Address | Beds | Baths | Sqft | Rent | $/sqft | DOM | Units | Dist |
|---|---|---|---|---|---|---|---|---|
| 72 Schriever Ln New City, NY | 4.0 | 2.5 | 2296 | $6,000 | $2.61 | 3d | 1 | 0.66mi |
Listing history 20 events
-
2026-06-18days on market $588,000 Active 154 DOM
-
2026-06-17days on market $588,000 Active 153 DOM
-
2026-06-16days on market $588,000 Active 152 DOM
-
2026-06-15days on market $588,000 Active 151 DOM
-
2026-06-13days on market $588,000 Active 149 DOM
-
2026-06-09days on market $588,000 Active 145 DOM
-
2026-06-08days on market $588,000 Active 144 DOM
-
2026-06-07days on market $588,000 Active 143 DOM
-
2026-06-04days on market $588,000 Active 140 DOM
-
2026-06-03days on market $588,000 Active 139 DOM
-
2026-06-02days on market $588,000 Active 138 DOM
-
2026-06-01days on market $588,000 Active 137 DOM
-
2026-05-31days on market $588,000 Active 136 DOM
-
2026-05-06price $588,000 97-char remark
Show marketing remark (97 chars)
Well-maintained 4-bedroom, 2-bath Cape offering great potential with a full basement - A must see
-
2026-03-03price $589,000 97-char remark
Show marketing remark (97 chars)
Well-maintained 4-bedroom, 2-bath Cape offering great potential with a full basement - A must see
-
2026-01-15$599,000 Active 97-char remark
Show marketing remark (97 chars)
Well-maintained 4-bedroom, 2-bath Cape offering great potential with a full basement - A must see
-
2006-10-16soldstatus $503,500
-
2006-10-09soldstatus $475,000 173-char remark
Show marketing remark (173 chars)
Lovely col/cape front porch, 4-bed, new baths, family fm 18x20,beautiful deck over looking private yard. basement ready to finish, DONT' MISS THIS ONE . .MOTIVATED SELLER. .
-
2006-08-21historical 173-char remark
Show marketing remark (173 chars)
Lovely col/cape front porch, 4-bed, new baths, family fm 18x20,beautiful deck over looking private yard. basement ready to finish, DONT' MISS THIS ONE . .MOTIVATED SELLER. .
-
2006-04-10$475,000 173-char remark
Show marketing remark (173 chars)
Lovely col/cape front porch, 4-bed, new baths, family fm 18x20,beautiful deck over looking private yard. basement ready to finish, DONT' MISS THIS ONE . .MOTIVATED SELLER. .
ⓘ Source: listings_history table (triggers on properties + properties_extension) + one-shot
backfill from property_details.listing_events for pre-trigger history.
Tax reassessment forecast NY · Partial reset (capped growth)
- Current annual tax
- $13,777 · $1,148/mo
- Projected year-2 tax
- $13,777 · $1,148/mo
- Expected delta
- $0/yr ($0/mo · 0.0%)
ⓘ Screening estimate from a state-policy table — verify with the county assessor before closing.
Climate risk First Street
- Flood 1/10 Low FEMA zone X (unshaded) · 0% chance over 30 yrs
- Wildfire 1/10 Low
- Heat 5/10 Major 7 d/yr ≥98°F today · 14 d/yr by 30 yrs out
- Wind 5/10 Major 26% chance of damaging wind over 30 yrs
- Air quality 4/10 Moderate 3 unhealthy d/yr today · 6 by 30 yrs out
Nearby sold comps map
Loading sold comps map…
Walkable amenities ~0.75 mi
Loading nearby amenities…
Taxation est. · year 1
- Rental income
- $72,000
- − Mortgage interest
- −$32,937
- − Property taxes
- −$13,777
- − Insurance
- −$2,940
- − Repairs & maintenance
- −$5,760
- − Management
- −$5,760
- − Depreciation
- −$17,105
- Taxable loss
- −$6,279
- Est. tax savings @ 24.0%
- +$1,507
- After-tax cash flow
- $4,668/yr
For passive investors: Depreciation is non-cash, so a rental often shows a tax loss while cash-flowing — sheltering income. Rental losses are passive: they offset passive income freely, and up to $25,000/yr can offset ordinary (W-2) income if you actively participate and your MAGI is under $100k (phasing out to $0 by $150k); unused losses carry forward. On sale, claimed depreciation is recaptured at up to 25%, and gains may owe capital-gains tax (a 1031 exchange can defer both). Figures are a year-1 estimate at your 24.0% rate — not tax advice; consult a CPA.
Schools (NCES district)
- District
- Clarkstown Central School District
- NCES district ID
- 3620340
- Math proficiency
- 72% ▼ -1.00%
- Reading proficiency
- 75% ▲ 6.00%
- Median HH income
- $115,765
- Composite
- 68.55/100
- National rank
- #342
- State rank
- #66 of 590 in NY
Livability — New City
- Score
- 80/100
- State rank
- #111
- US rank
- #1835
Category grades
Schools grade is shown separately in the Schools card above.
Census & demographics
- Census place
- New City, NY
- City population
- 31,420
- Population (ZIP)
- 31,420
Population outlook (Rockland County) Hauer SSP2
- Today (2025)
- 339,642 people
- By 2030
- 345,987 · +1.9%
- By 2040
- 357,178 · +5.2%
- By 2050
- 362,456 · +6.7%
- By 2075
- 367,281 · +8.1%
- By 2100
- 328,211 · -3.4%
Race, ethnicity, and origin ACS 2023
- Neighborhood character
- Diverse neighborhood (Simpson 0.60)
- Race & ethnicity
- White 58% Hispanic / Latino 19% Asian 13% Two or more races 10% Black 6%
- Hispanic origin (detail)
- Puerto Rican 7% Dominican 5%
- Common ancestry
- Romanian 4% Scotch-Irish 4% Italian 1%
- Foreign-born
- 23% · Canada, China, South Korea
- Languages at home
- 68% English-only · Spanish 13% Other Indo-European 5% Other Asian/Pacific 4%
Political lean MEDSL · Rockland
- 2024 margin
- R (+11.8) · D 44.1% · R 55.9%
- 2008→2024 swing
- -17.7pp toward R · 2008: 5.9pp · 2024: -11.8pp
- All cycles
- 2024: R+11.8 2020: D+1.7 2016: D+5.1 2012: D+6.6 2008: D+5.9
Not yet ingested
- Civics
- —
Market trends
- HPI YoY
- ▼ -530.90%
- Current HPI
- 261.6277
- Rent YoY
- —
- Metro
- —
- State GDP YoY
- ▲ 2.60%
- F500 in state
- 92
Industry mix (Fortune 500 HQ in NY)
| Industry | F500 HQs | Revenue |
|---|---|---|
| Financial Services | 10 | $950B |
|
||
| Consumer Goods | 9 | $162B |
|
||
| Insurance | 4 | $225B |
|
||
| Telecommunications | 2 | $144B |
|
||
| Pharmaceuticals | 2 | $112B |
|
||
| Media / Entertainment | 2 | $69B |
|
||
Price history
+23.8% since first listed7 events — show timeline
- 2026-05-06 Price Changed $588,000 OneKey® MLS as Distributed by MLS Grid
- 2026-03-03 Price Changed $589,000 OneKey® MLS as Distributed by MLS Grid
- 2026-01-15 Listed $599,000 OneKey® MLS as Distributed by MLS Grid
- 2006-10-16 Sold (Public Records) $503,500 Public Records
- 2006-10-09 Sold (MLS) $475,000 HGMLS
- 2006-08-21 Delisted — HGMLS
- 2006-04-10 Listed $475,000 HGMLS
Property tax history
+2.4%/yrLatest (2025): $13,777 · +3.4% YoY. Source: county tax records.
Cash-flow waterfall
monthlySold comps — $/sqft
last 12 mo · ≤1 miLoading sold comps…