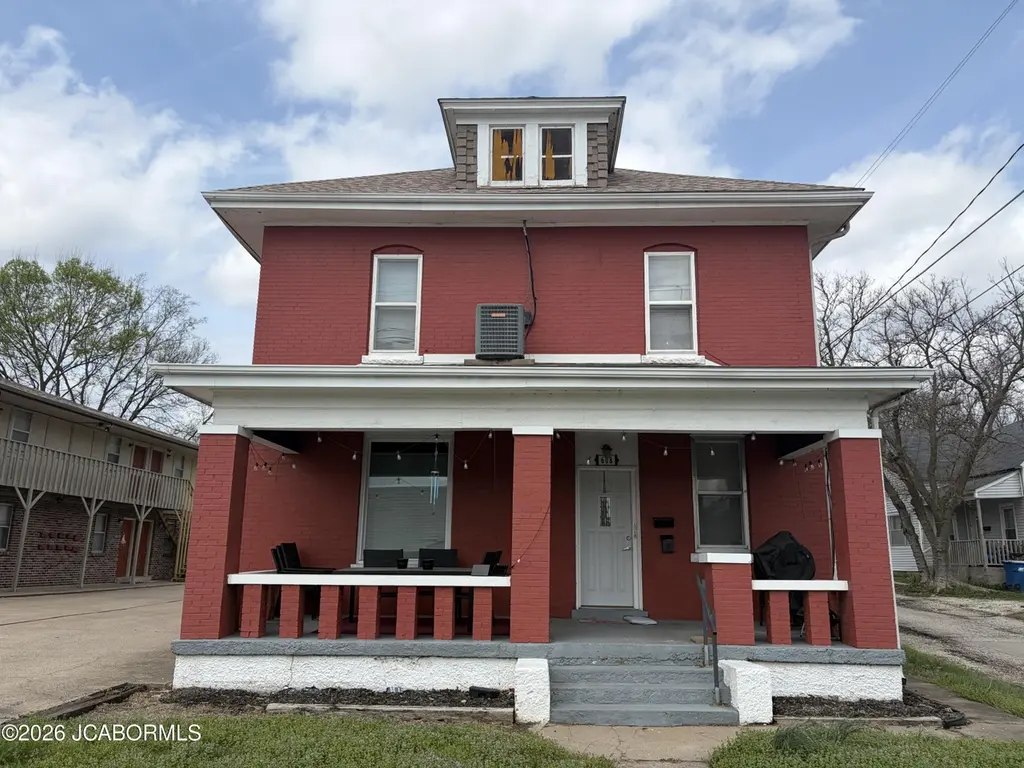
608 Washington St · Jefferson City, MO
Flood risk 1/10 · Minimal
- FEMA flood zone
- X (unshaded)
- Chance of flooding over 30 yrs
- 0.0%
- Est. flood insurance / yr
- $473 – $860
Fire risk 1/10 · Minimal
- Est. fire insurance / yr
- $1,054 – $1,958
Heat risk 5/10 · Moderate
- Hot days now (above 106°F)
- 7 days/yr
- Hot days in 30 yrs
- 19 days/yr
Wind risk 2/10 · Minimal
- Chance of severe wind over 30 yrs
- —
Air-quality risk 2/10 · Minimal
- Unhealthy air days now
- 0 days/yr
- Unhealthy air days in 30 yrs
- 1 days/yr
Risk factors via First Street. Map © Google.
Why this score? — see what drove the C- grade
The composite is a weighted blend of 9 inputs, each scored 0–100. Each bar is that input's sub-score; the figure is the points it added to the 100-point composite (weight × sub-score).
- Cash flow +19.7/30.0
- ARV discount +7.5/15.0
- DSCR +6.2/10.0
- 1% rule +4.3/10.0
- Livability +4.2/5.0
- Schools +3.5/10.0
- Rent growth +2.5/5.0
- Condition / age +2.5/5.0
- Appreciation +0.0/10.0
$150,000
🖨 Deal sheet (PDF) 📄 Offer letter ✓ Due diligence
Listing remarks MLS
Exceptional opportunity to acquire a well-maintained, fully leased rental property located in central / east Jefferson City neighborhood. This building consists of two 1-bedrm, 1-bath units, each currently occupied on month-to-month leases, offering immediate income w/ built-in flexibility for future rent optimization. Properties feature functional layouts, & strong rental history. Rents vary across units w/ potential for an investor seeking to align pricing with current market rates over time. Strategically positioned in established areas w/ access to shopping, dining, & transportation, this property appeals to a broad tenant base & supports long-term occupancy stability. Ideal for investors looking to expand their portfolio w/ income-producing assets or 1031 exchange buyers.
Key facts
- Access to shopping
- Access to dining
- 4,791 sq ft lot
Tags
Neighborhood map
What this means for you Summary
Snapshot
- This is a 3-bed/2.0-bath condo listed at $150k.
Deal economics
- At list price, monthly cash flow is $177 ($2k/yr) — positive.
- The deal already cash-flows at list — no discount required.
- To meet the 1% rule (rent ≥ 1% of price), the offer needs to be $140k (7.0% below list).
- Recommended offer: $140k (7.0% below list) — sets the bar for 1% rule.
- Cap rate 7.7% vs local median 3.7% in Jefferson City — top-decile yield for the area; either an underpriced asset or a hidden risk that comps aren't pricing in. Stress-test before assuming the spread holds.
Location & tenants
- Location reads 83/100 on livability (#7 in MO, #838 nationally) — a professional / high-income tenant draw. Strengths: cost of living A+, housing A+, health & safety A+; Watch: crime C-.
- Jefferson City (urban): math 34% / reading 48% proficiency, ranked #121 of 324 in MO (top 37%) — families likely to look elsewhere, expect single-tenant / working-renter base with shorter leases.
- Zoned schools: South Elem. (math 27% / reading 32%, grade F, #813 of 1,115 statewide, top 75%, 312 students, 99% FRL); Thomas Jefferson Middle (math 33% / reading 44%, grade F, #202 of 391 statewide, top 54%, 957 students, 52% FRL); Capital City High School (math 45% / reading 67%, grade C, #59 of 521 statewide, top 11%, 1,404 students, 41% FRL) — zoned schools average 64% FRL vs 44% district-wide (20 pts higher); higher-poverty schools than district average — tighter screening recommended.
- Market conditions: 192 active listings in the ZIP; 173 units permitted in Cole County in 2024 (0 in 5+ unit buildings).
Forward outlook
- Local home prices are declining (-3.0%/yr); year-one equity from $1k of loan paydown is wiped out by about $4k of value loss. Plan a longer hold.
- Cole County population projected to shrink 5% by 2050 — rents likely to lag national; underwrite the cash flow, not the appreciation.
Negotiation context
- Only 5 days on market — expect competitive offers; lowballing is unlikely to land.
- 2 sale attempts with the ask held roughly flat each time — persistent listings suggest the price (not the market) is what's stuck; bring a comps-based counter.
Risks & watch-outs
- Watch-outs: built in 1910 — expect roof / HVAC / electrical / plumbing capex.
- Climate carrying-cost: extreme-heat days projected 7→19/yr by 2055 (HVAC capex compounding) — expect insurance premiums to compound above CPI over the hold.
Questions for the listing agent
- Built in 1910 — when were the roof, HVAC, electrical panel, plumbing, and water heater last replaced?
- Any open or pending special assessments — roof, HVAC, plumbing, elevator, façade? What's the per-unit balance and payoff schedule, and is the seller paying it off at close or rolling it to the buyer?
- Is there a deadline driving the sale (1031 exchange, divorce, estate, relocation)? That informs how much negotiation room exists.
- Schools are B-rated — typically a magnet for longer-tenancy family renters. What's the average tenant stay here, and is there a school-zone premium baked into asking?
- What's the average days-on-market for RENTAL listings here right now (not sales)? A rising rental-DOM trend means longer vacancies and softer asking-rent achievability than the comps imply.
- What's the recent tenant-quality profile in this submarket — average credit score on applications, eviction rate, late-payment / NSF rate, and stable-employment percentage? A property-management company in the area should have these aggregated.
- How much new apartment / multifamily construction is in the pipeline within 1–3 miles? Heavy new supply (>2% of stock underway) typically softens rents 12–24 months out; light construction supports rent growth.
Investment metrics
- 1% rule
- 0.93% ✗
- Cap rate
- 7.71%
- Cash-on-cash
- 5.05%
- DSCR
- 1.22
- GRM
- 9.0
CMA / ARV
No comps found within radius.
Projected returns pro-forma
-3.0% appreciation · 3.0% rent growth · sell at horizon
- IRR
- -8.5%
- Equity multiple
- 0.69×
- Total profit
- $-13,089
- Equity at exit
- $22,365
- IRR
- 1.0%
- Equity multiple
- 1.07×
- Total profit
- $2,915
- Equity at exit
- $12,969
Cash invested: $42,000 (down + closing). Projections, not guarantees.
Landlord ↔ Tenant lean methodology
- Overall (STATE)
- 81 Strongly Landlord-Friendly
- State Missouri
- 81 Strongly Landlord-Friendly · R+10
- County
- — inherits STATE
- City
- — inherits STATE
ZIP-level market 65101
- Home prices YoY
- -29.1%
- Active inventory
- 192
- Price-to-rent
- 9.0×
Monthly cashflow live
- Estimated rent
- $1,396 medium interval (Pro) →
- Mortgage (P&I)
- −$787
- Tax from tax record
- −$77 /mo · $920/yr
- Insurance
- −$62
- HOA
- −$0
- Lot rent
- −$0
- Vacancy / Maint / Mgmt
- −$293
- Net cashflow
- $177
Break-even live
Sensitivity live
| Price | -10% $262 | -5% $219 | +0% $177 | +5% $134 | +10% $92 |
|---|---|---|---|---|---|
| Rent | -10% $67 | -5% $122 | +0% $177 | +5% $232 | +10% $287 |
| Rate | -1.0pp $252 | -0.5pp $215 | base $177 | +0.5pp $138 | +1.0pp $98 |
UW: 25.0% down · 7.5% · 30yr · 1.5% tax · 5.0% vac · 8.0% maint · 8.0% mgmt
Financing live
Cash to close
- Down payment
- $37,500
- Closing costs
- $4,500
- Reserves months
- —
- Total cash needed
- —
Loan-product check · same deal, 3 products live
Conventional
25% down · 7.5% · 30yr
- Down + closing
- —
- Monthly P&I
- —
- Monthly cashflow
- —
- DSCR
- —
- Eligible?
- —
Personal DTI + credit; lowest rate.
DSCR
20% down · 8.5% · 30yr
- Down + closing
- —
- Monthly P&I
- —
- Monthly cashflow
- —
- DSCR
- —
- Eligible?
- —
No personal income docs; deal must DSCR.
Hard money
10% down · 12.0% · 12mo
- Down + closing
- —
- Monthly P&I
- —
- Monthly cashflow
- —
- DSCR
- —
- Eligible?
- —
Short-term bridge; refi at stabilization.
HOA detail condo
- Monthly dues
- $0 · $0/yr
- Assessments
- None detected in remarks — confirm with the listing agent.
Listing history 4 events
-
2026-04-26status Pending
Show marketing remark (803 chars)
Exceptional opportunity to acquire a well-maintained, fully leased rental property located in central / east Jefferson City neighborhood. This building consists of two 1-bedrm, 1-bath units, each currently occupied on month-to-month leases, offering immediate income w/ built-in flexibility for future rent optimization. Properties feature functional layouts, & strong rental history. Rents vary across units w/ potential for an investor seeking to align pricing with current market rates over time. Strategically positioned in established areas w/ access to shopping, dining, & transportation, this property appeals to a broad tenant base & supports long-term occupancy stability. Ideal for investors looking to expand their portfolio w/ income-producing assets or 1031 exchange buyers.
-
2026-04-26status Pending 803-char remark
Show marketing remark (803 chars)
Exceptional opportunity to acquire a well-maintained, fully leased rental property located in central / east Jefferson City neighborhood. This building consists of two 1-bedrm, 1-bath units, each currently occupied on month-to-month leases, offering immediate income w/ built-in flexibility for future rent optimization. Properties feature functional layouts, & strong rental history. Rents vary across units w/ potential for an investor seeking to align pricing with current market rates over time. Strategically positioned in established areas w/ access to shopping, dining, & transportation, this property appeals to a broad tenant base & supports long-term occupancy stability. Ideal for investors looking to expand their portfolio w/ income-producing assets or 1031 exchange buyers.
-
2026-04-20$150,000 Active
Show marketing remark (803 chars)
Exceptional opportunity to acquire a well-maintained, fully leased rental property located in central / east Jefferson City neighborhood. This building consists of two 1-bedrm, 1-bath units, each currently occupied on month-to-month leases, offering immediate income w/ built-in flexibility for future rent optimization. Properties feature functional layouts, & strong rental history. Rents vary across units w/ potential for an investor seeking to align pricing with current market rates over time. Strategically positioned in established areas w/ access to shopping, dining, & transportation, this property appeals to a broad tenant base & supports long-term occupancy stability. Ideal for investors looking to expand their portfolio w/ income-producing assets or 1031 exchange buyers.
-
2026-04-20$150,000 Active 803-char remark
Show marketing remark (803 chars)
Exceptional opportunity to acquire a well-maintained, fully leased rental property located in central / east Jefferson City neighborhood. This building consists of two 1-bedrm, 1-bath units, each currently occupied on month-to-month leases, offering immediate income w/ built-in flexibility for future rent optimization. Properties feature functional layouts, & strong rental history. Rents vary across units w/ potential for an investor seeking to align pricing with current market rates over time. Strategically positioned in established areas w/ access to shopping, dining, & transportation, this property appeals to a broad tenant base & supports long-term occupancy stability. Ideal for investors looking to expand their portfolio w/ income-producing assets or 1031 exchange buyers.
ⓘ Source: listings_history table (triggers on properties + properties_extension) + one-shot
backfill from property_details.listing_events for pre-trigger history.
Tax reassessment forecast MO · Resets to sale price
- Current annual tax
- $920 · $77/mo
- Projected year-2 tax
- $1,455 · $121/mo
- Expected delta
- +$535/yr (+$45/mo · 58.2%)
ⓘ Screening estimate from a state-policy table — verify with the county assessor before closing.
Climate risk First Street
- Flood 1/10 Low FEMA zone X (unshaded) · 0% chance over 30 yrs
- Wildfire 1/10 Low
- Heat 5/10 Major 7 d/yr ≥106°F today · 19 d/yr by 30 yrs out
- Wind 2/10 Low
- Air quality 2/10 Low 0 unhealthy d/yr today · 1 by 30 yrs out
Nearby sold comps map
Loading sold comps map…
Walkable amenities ~0.75 mi
Loading nearby amenities…
Taxation est. · year 1
- Rental income
- $16,749
- − Mortgage interest
- −$8,402
- − Property taxes
- −$920
- − Insurance
- −$750
- − Repairs & maintenance
- −$1,340
- − Management
- −$1,340
- − Depreciation
- −$4,364
- Taxable loss
- −$367
- Est. tax savings @ 24.0%
- +$88
- After-tax cash flow
- $2,210/yr
For passive investors: Depreciation is non-cash, so a rental often shows a tax loss while cash-flowing — sheltering income. Rental losses are passive: they offset passive income freely, and up to $25,000/yr can offset ordinary (W-2) income if you actively participate and your MAGI is under $100k (phasing out to $0 by $150k); unused losses carry forward. On sale, claimed depreciation is recaptured at up to 25%, and gains may owe capital-gains tax (a 1031 exchange can defer both). Figures are a year-1 estimate at your 24.0% rate — not tax advice; consult a CPA.
Schools (NCES district)
- District
- Jefferson City
- NCES district ID
- 2916190
- Math proficiency
- 34% ▼ -1.00%
- Reading proficiency
- 48% ▲ 5.00%
- Median HH income
- $51,903
- Composite
- 35.45/100
- National rank
- #4930
- State rank
- #121 of 324 in MO
Livability — Jefferson City
- Score
- 83/100
- State rank
- #7
- US rank
- #838
Category grades
Schools grade is shown separately in the Schools card above.
Census & demographics
- Census place
- Jefferson City, MO
- City population
- 41,145
- Population (ZIP)
- 29,777
Population outlook (Cole County) Hauer SSP2
- Today (2025)
- 78,107 people
- By 2030
- 78,089 · +-0.0%
- By 2040
- 76,814 · -1.7%
- By 2050
- 74,515 · -4.6%
- By 2075
- 67,687 · -13.3%
- By 2100
- 55,023 · -29.6%
Race, ethnicity, and origin ACS 2023
- Neighborhood character
- Predominantly White (73%)
- Race & ethnicity
- White 73% Black 19% Two or more races 5% Hispanic / Latino 3%
- Common ancestry
- Slovak 2% Lithuanian 2% Italian 1%
- Foreign-born
- 3% · Canada
- Languages at home
- 96% English-only · Spanish 2%
Political lean MEDSL · Cole
- 2024 margin
- Solid R (+34.4) · D 32.1% · R 66.5% · Other 1.4%
- 2008→2024 swing
- -7.5pp toward R · 2008: -26.9pp · 2024: -34.4pp
- All cycles
- 2024: R+34.4 2020: R+33.9 2016: R+36.8 2012: R+33.7 2008: R+26.9
Not yet ingested
- Civics
- —
Market trends
- HPI YoY
- ▼ -86.16%
- Current HPI
- 209.3832
- Rent YoY
- —
- Metro
- —
- State GDP YoY
- ▲ 1.84%
- F500 in state
- 20
Industry mix (Fortune 500 HQ in MO)
| Industry | F500 HQs | Revenue |
|---|---|---|
| Healthcare | 1 | $163B |
|
||
| Insurance | 1 | $21B |
|
||
| Industrial Technology | 1 | $17B |
|
||
| Retail | 1 | $16B |
|
||
| Industrial Distribution | 1 | $10B |
|
||
| Utilities | 1 | $9B |
|
||
Price history
+0.0% since first listed4 events — show timeline
- 2026-04-26 Pending — CBORMLS
- 2026-04-26 Pending — JCMLS
- 2026-04-20 Listed $150,000 CBORMLS
- 2026-04-20 Listed $150,000 JCMLS
Property tax history
+1.8%/yrLatest (2025): $920 · +5.2% YoY. Source: county tax records.
Cash-flow waterfall
monthlySold comps — $/sqft
last 12 mo · ≤1 miLoading sold comps…