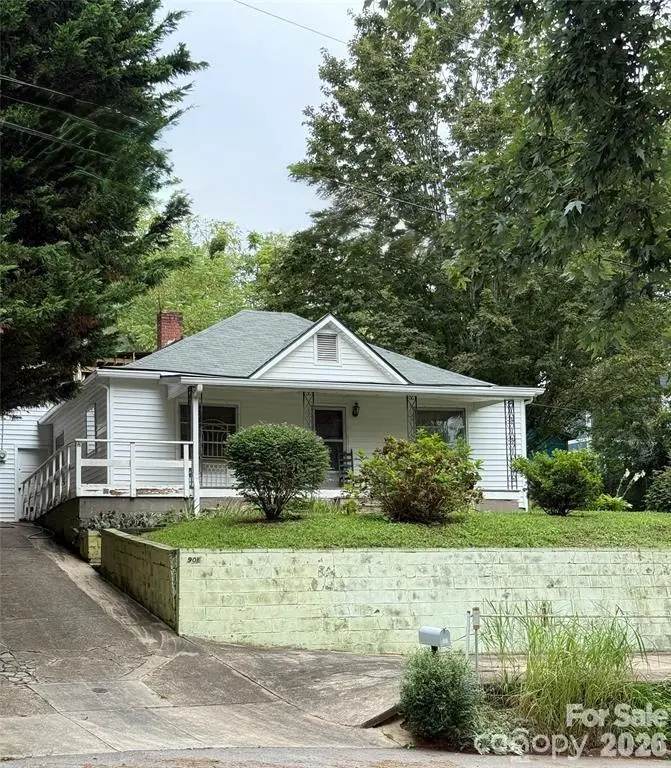
90 Tremont St · Asheville, NC
Flood risk 1/10 · Minimal
- FEMA flood zone
- X (unshaded)
- Chance of flooding over 30 yrs
- 0.0%
- Est. flood insurance / yr
- $507 – $1,088
Fire risk 1/10 · Minimal
- Est. fire insurance / yr
- $906 – $1,684
Heat risk 4/10 · Minor
- Hot days now (above 98°F)
- 7 days/yr
- Hot days in 30 yrs
- 19 days/yr
Wind risk 2/10 · Minimal
- Chance of severe wind over 30 yrs
- —
Air-quality risk 3/10 · Minor
- Unhealthy air days now
- 2 days/yr
- Unhealthy air days in 30 yrs
- 2 days/yr
Risk factors via First Street. Map © Google.
Why this score? — see what drove the D+ grade
The composite is a weighted blend of 9 inputs, each scored 0–100. Each bar is that input's sub-score; the figure is the points it added to the 100-point composite (weight × sub-score).
- ARV discount +15.0/15.0
- Cash flow +14.1/30.0
- DSCR +4.3/10.0
- Schools +4.0/10.0
- Livability +3.6/5.0
- 1% rule +3.2/10.0
- Rent growth +3.0/5.0
- Condition / age +2.5/5.0
- Appreciation +0.0/10.0
$250,000
🖨 Deal sheet (PDF) 📄 Offer letter ✓ Due diligence
Listing remarks
West Asheville RM-8 opportunity — surveyed . 22-acre property with potential for two parcels, just across the French Broad River from the River Arts District. These may e acquired separately or ourchased together. Welcome to East West Asheville, a walkable neighborhood just over the French Broad River from the River Arts District and close to Asheville’s parks, greenways, and breweries. 90 Tremont Street is a hillside property that’s been part of the community for over a century and now awaits new vision. This early 1900s three-bedroom, one-bath home has an open living and dining layout and was most recently a rental. The property is being sold As-Is, giving buyers a prime
Key facts
- Hillside property
- Room for gardening
- Outdoor living
Tags
Property features AI
Finance
- HOA & community: No HOA dues
Exterior
- Parking: Detached garage that faces the front; One covered garage space; Tandem concrete pad parking at lower front of lot
- Utilities: City water; Public sewer; Electricity connected; Cable available
- Home design: Single-family residence; Site-built construction; One story; Two or more access/exit points; Zoned RM8
- Construction: Wood construction; Fiberglass roof; Crawl space foundation with pillar/post/pier supports; Built on site
- Exterior features: Covered front porch; Partial fencing; Sloped lot; Roads are concrete/paved and publicly maintained
Interior
- Bedrooms: Three bedrooms on the main level
- Flooring: Wood floors
- Bathrooms: One full bathroom (main level)
- Heating & cooling: Forced air heating (oil); No central air
- Interior features: Attic with pull-down stairs; Split bedroom floor plan; Ceiling fans in some rooms; 6 total rooms
- Laundry & utility: Washer hookup on main level; Electric dryer hookup
Neighborhood map
What this means for you Summary
Snapshot
- This is a 3-bed/1.0-bath single-family listed at $250k.
Deal economics
- At list price, monthly cash flow is $37 ($440/yr) — positive.
- The deal already cash-flows at list — no discount required.
- To meet the 1% rule (rent ≥ 1% of price), the offer needs to be $204k (18.3% below list).
- Recommended offer: $204k (18.3% below list) — sets the bar for 1% rule.
- Cap rate 6.5% vs local median 2.5% in Asheville — top-decile yield for the area; either an underpriced asset or a hidden risk that comps aren't pricing in. Stress-test before assuming the spread holds.
Location & tenants
- Location reads 72/100 on livability (#96 in NC) — a middle-class / working-renter tenant base. Strengths: commute A+, health & safety A+, housing A-; Watch: crime F.
- Asheville City Schools (urban): math 39% / reading 55% proficiency, ranked #80 of 178 in NC (top 45%) — families likely to look elsewhere, expect single-tenant / working-renter base with shorter leases.
- Zoned schools: Hall Fletcher Elementary (math 27% / reading 42%, grade F, #835 of 1,410 statewide, top 62%, 307 students, 58% FRL); Asheville Middle (math 38% / reading 51%, grade D, #169 of 475 statewide, top 37%, 589 students, 48% FRL); Asheville High (math 52% / reading 65%, grade C, #235 of 535 statewide, top 45%, 1,166 students, 33% FRL) — zoned schools at 47% FRL track the district average.
- Market conditions: Rents rising (+2.1%/yr); 333 active listings in the ZIP; 19 comparable units currently listed for rent nearby; rentals at typical pace (median 23d on market — plan ~3-4 weeks tenant-placement turnaround); 3,305 units permitted in Buncombe County in 2024 (1,855 in 5+ unit buildings).
- This rent runs 39% of the median local income ($63k/yr) — at the standard rent-burdened threshold; future hikes will face affordability resistance.
Forward outlook
- Local home prices are declining (-3.0%/yr); year-one equity from $2k of loan paydown is wiped out by about $8k of value loss. Plan a longer hold.
- Buncombe County population projected at +24% by 2050 — long-run rental-demand tailwind backs the buy-and-hold thesis.
Negotiation context
- It's been on market 101 days — a 9% lower offer ($228k) is reasonable based on typical stale-listing flexibility.
Risks & watch-outs
- Watch-outs: built in 1905 — expect roof / HVAC / electrical / plumbing capex.
Questions for the listing agent
- It's been on market 101 days. Have you received any prior offers? Is the seller open to a 18% concession, seller financing, or rate buy-down credit?
- Built in 1905 — when were the roof, HVAC, electrical panel, plumbing, and water heater last replaced?
- Why hasn't it sold? Are there any deal-killer items the seller is aware of (foundation, flood, title, zoning, code violations)?
- Is there a deadline driving the sale (1031 exchange, divorce, estate, relocation)? That informs how much negotiation room exists.
- Schools are B-rated — typically a magnet for longer-tenancy family renters. What's the average tenant stay here, and is there a school-zone premium baked into asking?
- Crime grade is F in this area — have there been break-ins, vandalism, or insurance claims at this property in the last 3 years? What carrier currently insures it and at what premium?
- The area grade is low — what's the realistic commute time and amenity access for the typical tenant pool here? Any planned neighborhood developments (good or bad) we should know about?
- What's the average days-on-market for RENTAL listings here right now (not sales)? A rising rental-DOM trend means longer vacancies and softer asking-rent achievability than the comps imply.
- What's the recent tenant-quality profile in this submarket — average credit score on applications, eviction rate, late-payment / NSF rate, and stable-employment percentage? A property-management company in the area should have these aggregated.
- How much new for-sale + rental construction is in the pipeline within 1–3 miles? Heavy new supply typically softens prices + rents 12–24 months out; constrained supply supports both.
Investment metrics
- 1% rule
- 0.82% ✗
- Cap rate
- 6.47%
- Cash-on-cash
- 0.63%
- DSCR
- 1.03
- GRM
- 10.2
CMA / ARV
- ARV (on-the-fly)
- $371,884
- Comps found
- 12
Show comp detail 12 sales within ~0.75 mi
| Address | Dist | Beds/Ba | Sqft | Sold | Price | $/sf | Match |
|---|---|---|---|---|---|---|---|
| 33 Euclid Blvd | 0.37mi | 3/1.0 | 990 (+4%) | 0mo | $374,000 | $378 | 77 |
| 20 Michigan Ave | 0.46mi | 2/1.0 (-1) | 1,019 (+7%) | 5mo | $385,000 | $378 | 58 |
| 49 Euclid Blvd | 0.37mi | 2/1.5 (-1) | 1,018 (+6%) | 11mo | $462,500 | $454 | 56 |
| 43 Montana Ave | 0.57mi | 2/1.0 (-1) | 911 (-5%) | 10mo | $440,000 | $483 | 52 |
| 43 Wilmington St | 0.25mi | 3/2.0 | 1,086 (+14%) | 14mo | $385,000 | $355 | 50 |
| 74 Brucemont Cir | 0.74mi | 3/1.0 | 882 (-8%) | 6mo | $377,000 | $427 | 47 |
| 77 Baker Ave | 0.49mi | 3/2.0 | 1,088 (+14%) | 9mo | $360,000 | $331 | 43 |
| 107 Riverview Dr | 0.40mi | 4/3.0 (+1) | 1,081 (+13%) | 4mo | $437,000 | $404 | 43 |
| 76 Allen St | 0.69mi | 2/1.0 (-1) | 865 (-10%) | 9mo | $385,000 | $445 | 40 |
| 11 Club St | 0.71mi | 2/1.0 (-1) | 881 (-8%) | 12mo | $321,000 | $364 | 39 |
| 32 Florida Pl | 0.73mi | 2/1.0 (-1) | 1,068 (+12%) | 6mo | $415,000 | $389 | 37 |
| 187 Montana Ave | 0.71mi | 2/1.0 (-1) | 1,069 (+12%) | 14mo | $360,000 | $337 | 30 |
Match score weights: distance 35% · size 25% · config 20% · recency 20%. Top-matched comps best support the ARV.
Projected returns pro-forma
-3.0% appreciation · 2.06% rent growth · sell at horizon
- IRR
- -16.3%
- Equity multiple
- 0.43×
- Total profit
- $-40,153
- Equity at exit
- $37,276
- IRR
- -9.7%
- Equity multiple
- 0.43×
- Total profit
- $-39,916
- Equity at exit
- $21,615
Cash invested: $70,000 (down + closing). Projections, not guarantees.
Landlord ↔ Tenant lean methodology
- Overall (STATE)
- 85 Strongly Landlord-Friendly
- State North Carolina
- 85 Strongly Landlord-Friendly · R+3
- County
- — inherits STATE
- City
- — inherits STATE
ZIP-level market 28806
- Rents YoY
- 2.1%
- Active inventory
- 333
- Price-to-rent
- 10.2×
Monthly cashflow live
- Estimated rent
- $2,041 high interval (Pro) →
- Mortgage (P&I)
- −$1,311
- Tax from tax record
- −$161 /mo · $1,931/yr
- Insurance
- −$104
- HOA
- −$0
- Vacancy / Maint / Mgmt
- −$429
- Net cashflow
- $37
Break-even live
Sensitivity live
| Price | -10% $178 | -5% $107 | +0% $37 | +5% $-34 | +10% $-105 |
|---|---|---|---|---|---|
| Rent | -10% $-125 | -5% $-44 | +0% $37 | +5% $117 | +10% $198 |
| Rate | -1.0pp $163 | -0.5pp $100 | base $37 | +0.5pp $-28 | +1.0pp $-94 |
UW: 25.0% down · 7.5% · 30yr · 1.5% tax · 5.0% vac · 8.0% maint · 8.0% mgmt
Financing live
Cash to close
- Down payment
- $62,500
- Closing costs
- $7,500
- Reserves months
- —
- Total cash needed
- —
Loan-product check · same deal, 3 products live
Conventional
25% down · 7.5% · 30yr
- Down + closing
- —
- Monthly P&I
- —
- Monthly cashflow
- —
- DSCR
- —
- Eligible?
- —
Personal DTI + credit; lowest rate.
DSCR
20% down · 8.5% · 30yr
- Down + closing
- —
- Monthly P&I
- —
- Monthly cashflow
- —
- DSCR
- —
- Eligible?
- —
No personal income docs; deal must DSCR.
Hard money
10% down · 12.0% · 12mo
- Down + closing
- —
- Monthly P&I
- —
- Monthly cashflow
- —
- DSCR
- —
- Eligible?
- —
Short-term bridge; refi at stabilization.
Rent comps 19 comps
| Address | Beds | Baths | Sqft | Rent | $/sqft | DOM | Units | Dist |
|---|---|---|---|---|---|---|---|---|
| 50 Logan Ave Unit B Asheville, NC | 2.0 | 1.0 | 800 | $1,650 | $2.06 | 25d | 1 | 0.41mi |
| 25 Parkman Pl Asheville, NC | 2.0 | 1.0 | 1000 | $2,200 | $2.20 | 25d | 1 | 0.60mi |
| 6 Townview Dr Asheville, NC | 3.0 | 2.0 | 1100 | $1,700 | $1.55 | 45d | 1 | 0.64mi |
| 8 Townview Dr Asheville, NC | 3.0 | 2.0 | 1100 | $1,700 | $1.55 | 45d | 1 | 0.64mi |
| 146 Roberts St Asheville, NC | 1.0–2.0 | 1.0–2.0 | 995 | $2,578 | $2.59 | 15d | 19 | 0.70mi |
| 275 Hazel Mill Rd Asheville, NC | 2.0 | 2.0 | 1211 | $2,037 | $1.68 | 15d | 4 | 0.71mi |
| 25 Nevada Ave Unit 201 Asheville, NC | 2.0 | 2.0 | 960 | $1,845 | $1.92 | 15d | 1 | 0.85mi |
| 136 Louisiana Ave Unit 1 Asheville, NC | 2.0 | 1.0 | 1050 | $1,450 | $1.38 | 23d | 1 | 0.87mi |
| 146 Stewart St Asheville, NC | 3.0 | 2.0 | 888 | $1,500 | $1.69 | 25d | 1 | 0.99mi |
| 360 Hilliard Ave Asheville, NC | 1.0–2.0 | 1.0–2.0 | 844 | $1,800 | $2.13 | 23d | 10 | 0.99mi |
| 363 Hilliard Ave Asheville, NC | 2.0 | 1.0–2.0 | 809 | $2,495 | $3.08 | 15d | 14 | 1.00mi |
| 21 Kentucky Dr Asheville, NC | 3.0 | 1.0 | 864 | $1,800 | $2.08 | 25d | 1 | 1.02mi |
| 21 Brevard Rd Unit B Asheville, NC | 2.0 | 1.0 | 1000 | $1,700 | $1.70 | 25d | 1 | 1.05mi |
| 11 Walton St Asheville, NC | 3.0 | 2.0 | 1018 | $1,995 | $1.96 | 25d | 1 | 1.17mi |
| 226 Hilliard Ave Asheville, NC | 2.0 | 1.0–2.0 | 862 | $3,300 | $3.83 | 15d | 92 | 1.20mi |
| 919 Haywood Rd Asheville, NC | 1.0–2.0 | 1.0–2.0 | 1010 | $1,950 | $1.93 | 15d | 6 | 1.29mi |
| 20 Lee Garden Ln Asheville, NC | 1.0–3.0 | 1.0–2.0 | 880 | $1,182 | $1.34 | 15d | 11 | 1.36mi |
| 3 Lee Garden Ln Asheville, NC | 2.0 | 2.5 | 1086 | $2,500 | $2.30 | 15d | 1 | 1.37mi |
| 1 Page Ave Asheville, NC | 1.0–2.0 | 1.0–2.0 | 1609 | $4,200 | $2.61 | 15d | 5 | 1.40mi |
Listing history 17 events
-
2026-06-22days on market $250,000 Active 101 DOM
-
2026-06-18days on market $250,000 Active 98 DOM
-
2026-06-17days on market $250,000 Active 97 DOM
-
2026-06-16days on market $250,000 Active 96 DOM
-
2026-06-15days on market $250,000 Active 95 DOM
-
2026-06-14days on market $250,000 Active 93 DOM
-
2026-06-10days on market $250,000 Active 90 DOM
-
2026-06-09days on market $250,000 Active 89 DOM
-
2026-06-08days on market $250,000 Active 88 DOM
-
2026-06-07days on market $250,000 Active 87 DOM
-
2026-06-05days on market $250,000 Active 84 DOM
-
2026-06-03days on market $250,000 Active 83 DOM
-
2026-06-02days on market $250,000 Active 82 DOM
-
2026-06-01days on market $250,000 Active 81 DOM
-
2026-05-31days on market $250,000 Active 80 DOM
-
2026-05-30days on market $250,000 Active 79 DOM
-
2026-03-12$250,000 Active
ⓘ Source: listings_history table (triggers on properties + properties_extension) + one-shot
backfill from property_details.listing_events for pre-trigger history.
Tax reassessment forecast NC · Resets to sale price
- Current annual tax
- $1,931 · $161/mo
- Projected year-2 tax
- $2,050 · $171/mo
- Expected delta
- +$119/yr (+$10/mo · 6.2%)
ⓘ Screening estimate from a state-policy table — verify with the county assessor before closing.
Climate risk First Street
- Flood 1/10 Low FEMA zone X (unshaded) · 0% chance over 30 yrs
- Wildfire 1/10 Low
- Heat 4/10 Moderate 7 d/yr ≥98°F today · 19 d/yr by 30 yrs out
- Wind 2/10 Low
- Air quality 3/10 Moderate 2 unhealthy d/yr today · 2 by 30 yrs out
Nearby sold comps map
Loading sold comps map…
Walkable amenities ~0.75 mi
Loading nearby amenities…
Taxation est. · year 1
- Rental income
- $24,498
- − Mortgage interest
- −$14,004
- − Property taxes
- −$1,931
- − Insurance
- −$1,250
- − Repairs & maintenance
- −$1,960
- − Management
- −$1,960
- − Depreciation
- −$7,273
- Taxable loss
- −$3,880
- Est. tax savings @ 24.0%
- +$931
- After-tax cash flow
- $1,371/yr
For passive investors: Depreciation is non-cash, so a rental often shows a tax loss while cash-flowing — sheltering income. Rental losses are passive: they offset passive income freely, and up to $25,000/yr can offset ordinary (W-2) income if you actively participate and your MAGI is under $100k (phasing out to $0 by $150k); unused losses carry forward. On sale, claimed depreciation is recaptured at up to 25%, and gains may owe capital-gains tax (a 1031 exchange can defer both). Figures are a year-1 estimate at your 24.0% rate — not tax advice; consult a CPA.
Schools (NCES district)
- District
- Asheville City Schools
- NCES district ID
- 3700270
- Math proficiency
- 39% ▼ -7.00%
- Reading proficiency
- 55% ▼ -4.00%
- Median HH income
- $42,367
- Composite
- 39.51/100
- National rank
- #3948
- State rank
- #80 of 178 in NC
Livability — Asheville
- Score
- 72/100
- State rank
- #96
- US rank
- #6307
Category grades
Schools grade is shown separately in the Schools card above.
Census & demographics
- Census place
- Asheville, NC
- County
- Buncombe County · 241,085 people
- City population
- 137,611
- Metro
- Asheville, NC
- Population (ZIP)
- 43,433
- Household income
- $63,273
- Rent vs Own
- Severe rent burden
- 1783.0
Population outlook (Buncombe County) Hauer SSP2
- Today (2025)
- 286,475 people
- By 2030
- 302,237 · +5.5%
- By 2040
- 330,687 · +15.4%
- By 2050
- 356,370 · +24.4%
- By 2075
- 409,383 · +42.9%
- By 2100
- 437,270 · +52.6%
Race, ethnicity, and origin ACS 2023
- Neighborhood character
- Predominantly White (77%)
- Race & ethnicity
- White 77% Hispanic / Latino 11% Two or more races 9% Black 6% Asian 2%
- Hispanic origin (detail)
- Mexican 6%
- Common ancestry
- Serbian 3% Slovak 3% Italian 3%
- Foreign-born
- 10% · Canada, China
- Languages at home
- 86% English-only · Spanish 9% Russian/Polish/Slavic 3% Other Indo-European 2%
Political lean MEDSL · Buncombe
- 2024 margin
- Strong D (+24.8) · D 61.7% · R 36.9% · Other 1.4%
- 2008→2024 swing
- +10.9pp toward D · 2008: 13.9pp · 2024: 24.8pp
- All cycles
- 2024: D+24.8 2020: D+21.1 2016: D+14.6 2012: D+12.4 2008: D+13.9
Not yet ingested
- Civics
- —
Market trends
- HPI YoY
- ▼ -271.16%
- Current HPI
- 350.3071
- Rent YoY
- ▲ 2.06%
- Metro
- Asheville, NC
- State GDP YoY
- ▲ 3.28%
- F500 in state
- 26
Industry mix (Fortune 500 HQ in NC)
| Industry | F500 HQs | Revenue |
|---|---|---|
| Financial Services | 2 | $213B |
|
||
| Retail | 2 | $95B |
|
||
| Industrial Conglomerate | 1 | $38B |
|
||
| Metals / Steel | 1 | $35B |
|
||
| Utilities | 1 | $30B |
|
||
| Industrial Machinery | 1 | $19B |
|
||
Price history
1 event — show timeline
- 2026-03-12 Listed $250,000 CANOPYMLS as Distributed by MLS Grid
Property tax history
+3.1%/yrLatest (2025): $1,931 · +6.3% YoY. Source: county tax records.
Cash-flow waterfall
monthlySold comps — $/sqft
last 12 mo · ≤1 miLoading sold comps…